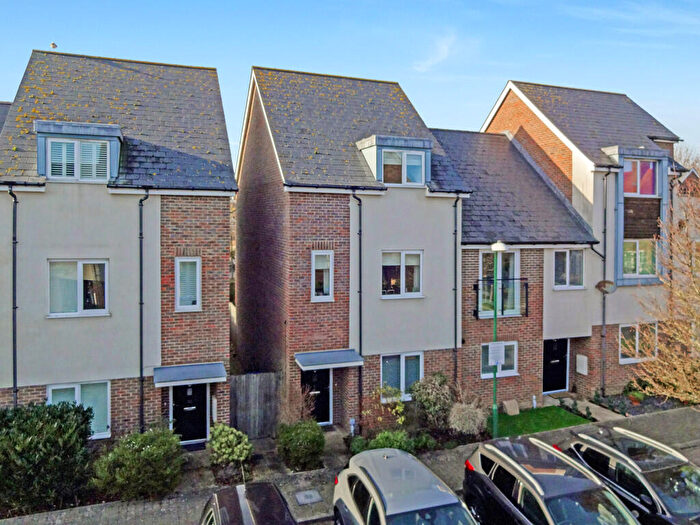
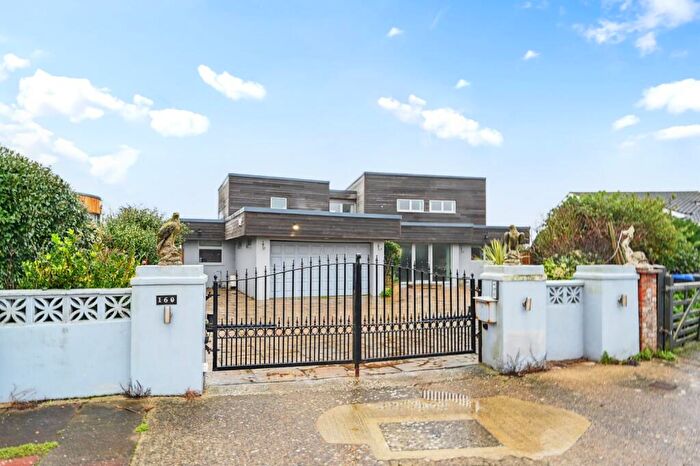
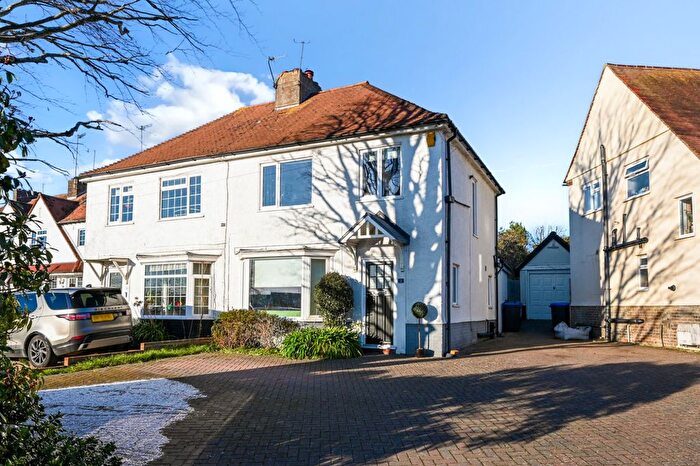
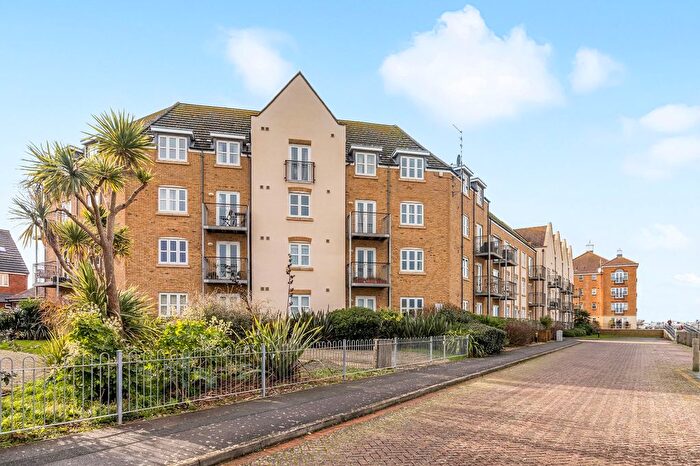
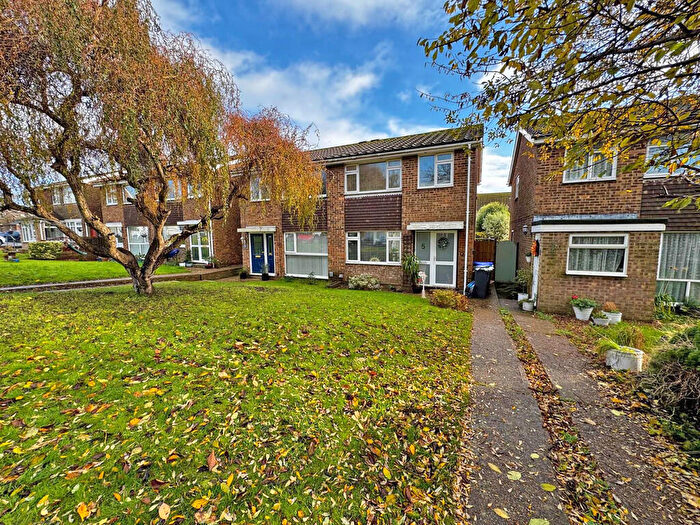
Houses for sale & to rent in Southlands, Shoreham-by-sea
House Prices in Southlands
Properties in Southlands have an average house price of £387,138.00 and had 171 Property Transactions within the last 3 years¹.
Southlands is an area in Shoreham-by-sea, West Sussex with 1,692 households², where the most expensive property was sold for £650,000.00.
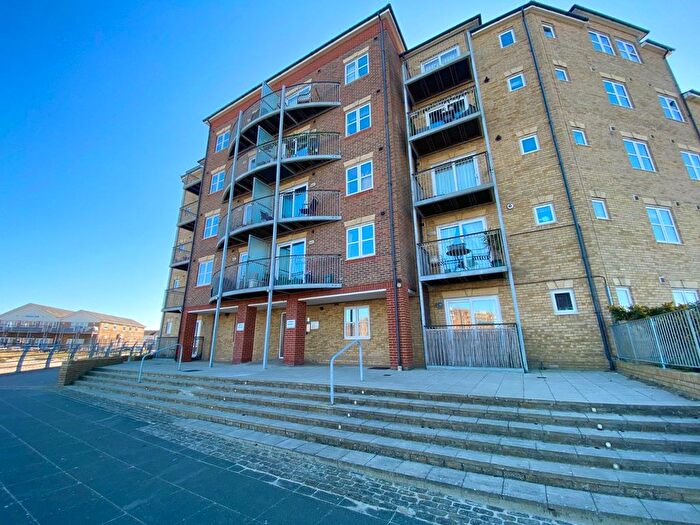
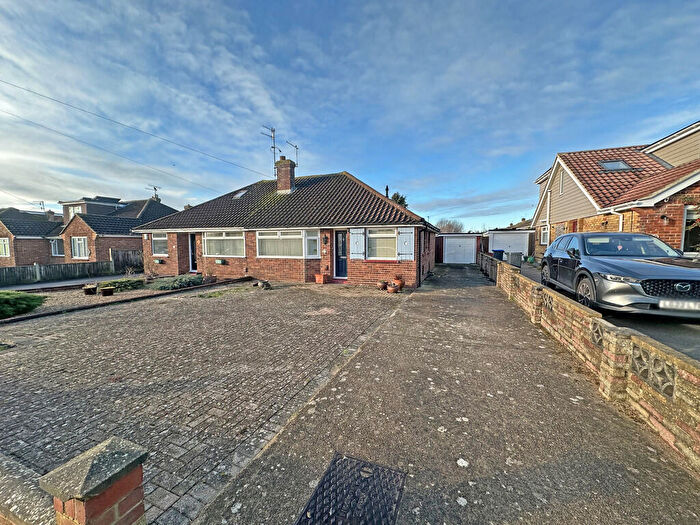
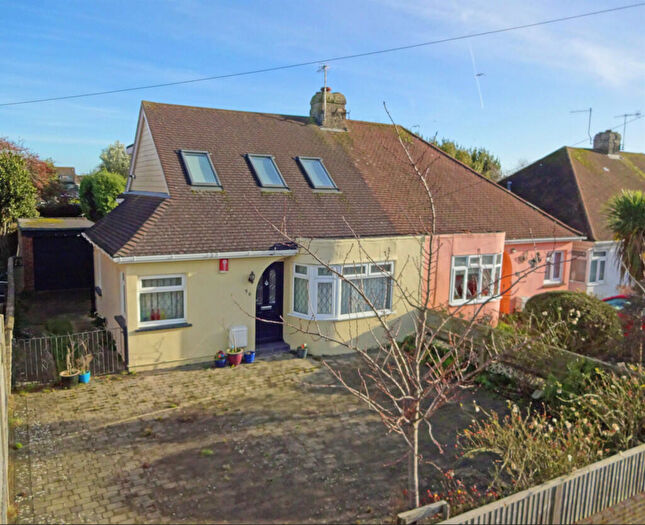
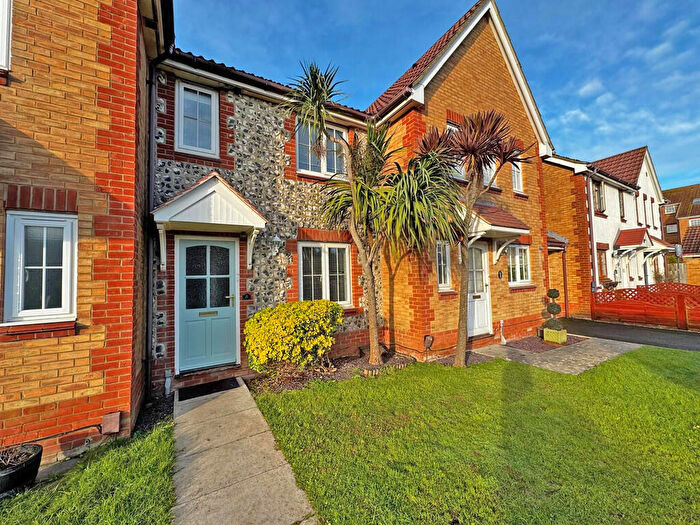
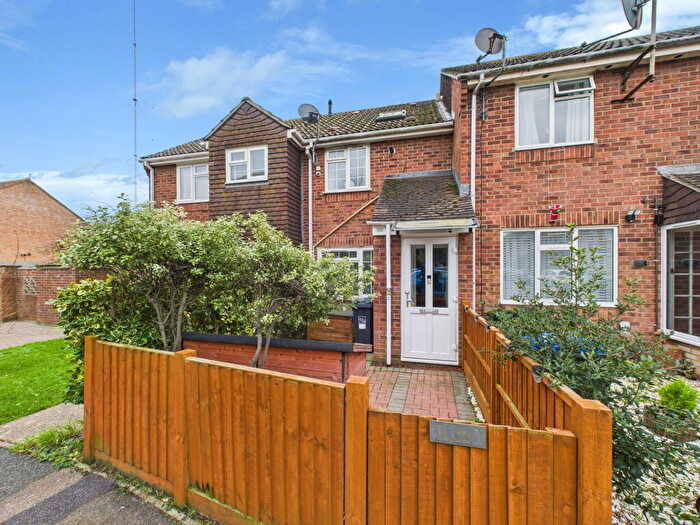
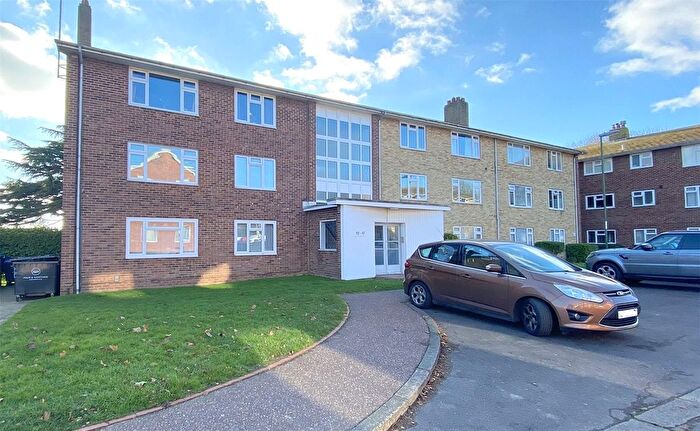
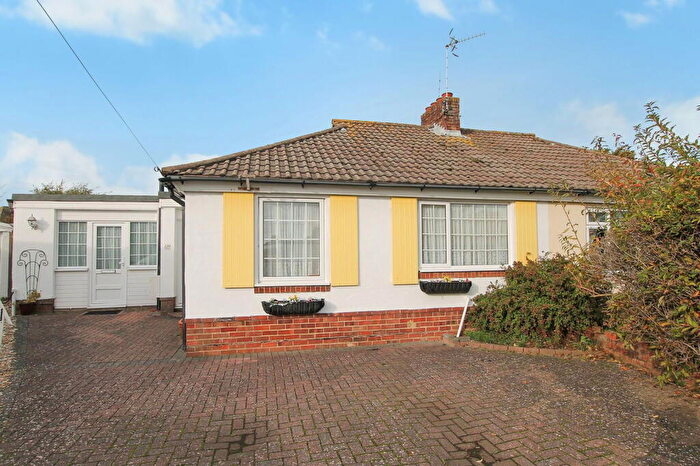
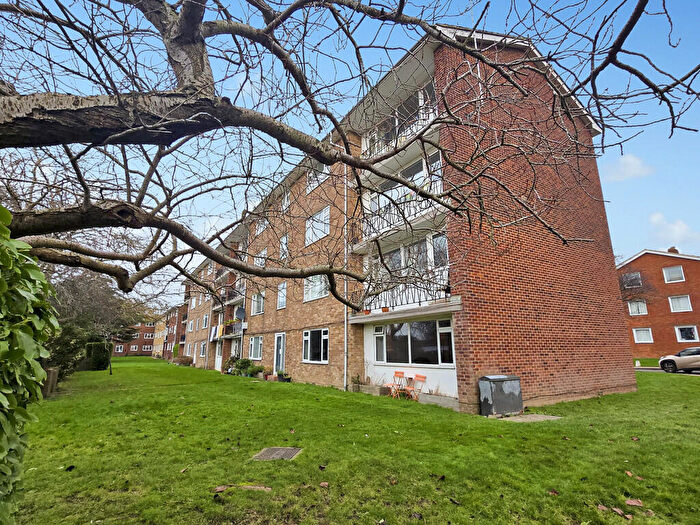
Properties for sale in Southlands
Roads and Postcodes in Southlands
Navigate through our locations to find the location of your next house in Southlands, Shoreham-by-sea for sale or to rent.
| Streets | Postcodes |
|---|---|
| Arundel Close | BN43 6LR BN43 6LS BN43 6LX |
| Buci Crescent | BN43 6LB BN43 6LW |
| Clarendon Road | BN43 6YF BN43 6YG |
| Crown Road | BN43 6GB BN43 6GD BN43 6GE |
| Elizabeth Road | BN43 6YJ |
| Fairfield Close | BN43 6BH |
| Franklin Road | BN43 6YD BN43 6YE |
| Hammy Close | BN43 6BL |
| Hammy Lane | BN43 6BJ BN43 6GF BN43 6GL |
| Hammy Way | BN43 6GG BN43 6GH |
| King George Road | BN43 6YL BN43 6YN |
| Kingsland Close | BN43 6NQ BN43 6NR |
| Kingston Close | BN43 6LP |
| Kingston Lane | BN43 6YB |
| Kingston Way | BN43 6YA |
| Lennox Road | BN43 6GN |
| Longshore Drive | BN43 6DJ |
| Mansell Road | BN43 6GP BN43 6GQ |
| Middle Road | BN43 6LL |
| Monarch Way | BN43 6DL |
| Montford Close | BN43 6YP |
| Nursery Close | BN43 6GJ |
| Parklands | BN43 6NN |
| Pebble Way | BN43 6AQ |
| Royal George Parade | BN43 6TB |
| Shirley Close | BN43 6YH |
| Southview Close | BN43 6LJ |
| Stoney Lane | BN43 6LA BN43 6LY BN43 6LZ BN43 6NA BN43 6NB BN43 6ND |
| Upper Shoreham Road | BN43 6TA BN43 6TQ |
| Williams Road | BN43 6BP BN43 6BQ |
| Wilmot Road | BN43 6BN BN43 6NE BN43 6NG BN43 6NH BN43 6NL BN43 6BU BN43 6NF BN43 6NJ |
Transport near Southlands
- FAQ
- Price Paid By Year
- Property Type Price
Frequently asked questions about Southlands
What is the average price for a property for sale in Southlands?
The average price for a property for sale in Southlands is £387,138. This amount is 15% lower than the average price in Shoreham-by-sea. There are 866 property listings for sale in Southlands.
What streets have the most expensive properties for sale in Southlands?
The streets with the most expensive properties for sale in Southlands are Southview Close at an average of £496,583, Hammy Close at an average of £469,000 and Kingston Way at an average of £468,333.
What streets have the most affordable properties for sale in Southlands?
The streets with the most affordable properties for sale in Southlands are Parklands at an average of £269,333, Buci Crescent at an average of £301,111 and Elizabeth Road at an average of £314,000.
Which train stations are available in or near Southlands?
Some of the train stations available in or near Southlands are Southwick, Shoreham-By-Sea and Fishersgate.
Property Price Paid in Southlands by Year
The average sold property price by year was:
| Year | Average Sold Price | Price Change |
Sold Properties
|
|---|---|---|---|
| 2025 | £378,388 | -2% |
34 Properties |
| 2024 | £385,698 | -1% |
49 Properties |
| 2023 | £388,986 | -1% |
44 Properties |
| 2022 | £393,657 | 7% |
44 Properties |
| 2021 | £364,940 | 8% |
78 Properties |
| 2020 | £335,181 | 5% |
47 Properties |
| 2019 | £317,893 | 3% |
57 Properties |
| 2018 | £307,622 | -11% |
49 Properties |
| 2017 | £341,939 | 13% |
107 Properties |
| 2016 | £297,132 | 9% |
62 Properties |
| 2015 | £270,316 | 9% |
45 Properties |
| 2014 | £245,962 | 7% |
64 Properties |
| 2013 | £227,990 | 6% |
37 Properties |
| 2012 | £215,106 | 7% |
43 Properties |
| 2011 | £200,986 | -5% |
58 Properties |
| 2010 | £210,213 | 14% |
32 Properties |
| 2009 | £180,127 | -7% |
33 Properties |
| 2008 | £193,498 | -4% |
39 Properties |
| 2007 | £201,774 | 1% |
71 Properties |
| 2006 | £200,646 | 9% |
87 Properties |
| 2005 | £183,324 | 11% |
60 Properties |
| 2004 | £163,706 | 6% |
63 Properties |
| 2003 | £153,409 | 14% |
70 Properties |
| 2002 | £132,314 | 16% |
52 Properties |
| 2001 | £111,155 | 14% |
72 Properties |
| 2000 | £95,075 | 19% |
60 Properties |
| 1999 | £76,958 | 14% |
63 Properties |
| 1998 | £65,970 | 6% |
73 Properties |
| 1997 | £62,270 | 17% |
64 Properties |
| 1996 | £51,985 | -10% |
53 Properties |
| 1995 | £57,405 | - |
43 Properties |
Property Price per Property Type in Southlands
Here you can find historic sold price data in order to help with your property search.
The average Property Paid Price for specific property types in the last three years are:
| Property Type | Average Sold Price | Sold Properties |
|---|---|---|
| Semi Detached House | £407,794.00 | 101 Semi Detached Houses |
| Detached House | £447,828.00 | 16 Detached Houses |
| Terraced House | £362,516.00 | 36 Terraced Houses |
| Flat | £266,536.00 | 18 Flats |

