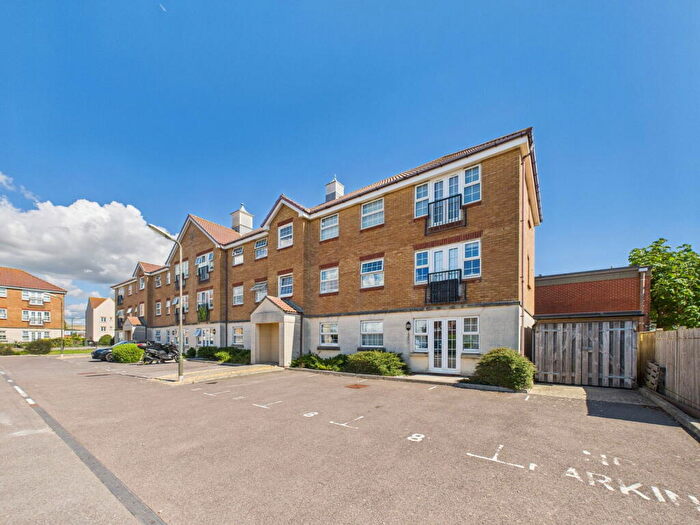
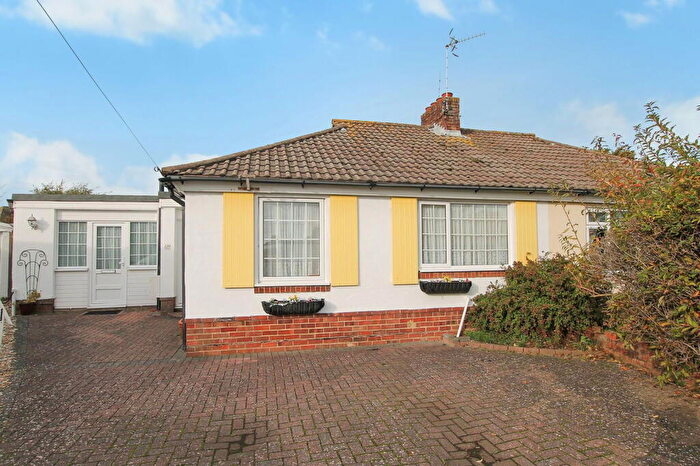
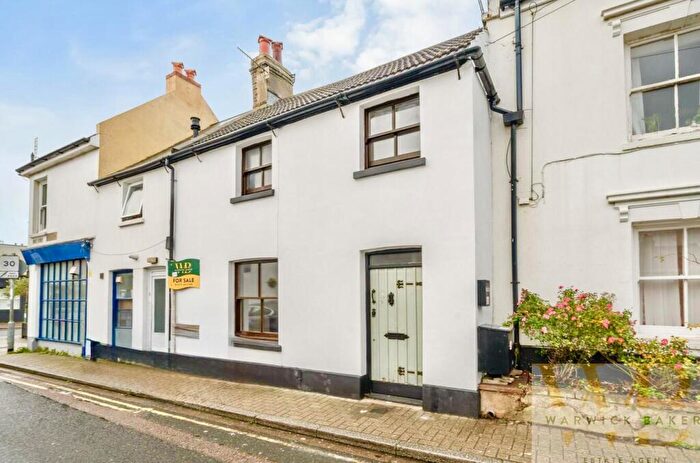
Houses for sale & to rent in Buckingham, Shoreham-by-sea
House Prices in Buckingham
Properties in Buckingham have an average house price of £504,773.00 and had 207 Property Transactions within the last 3 years¹.
Buckingham is an area in Shoreham-by-sea, West Sussex with 1,639 households², where the most expensive property was sold for £1,450,000.00.
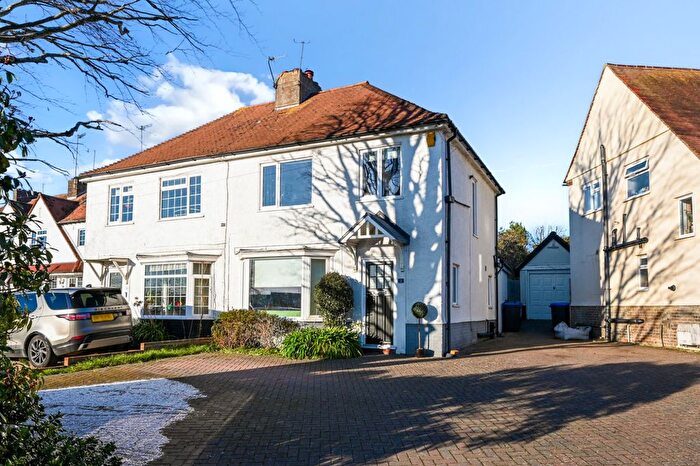
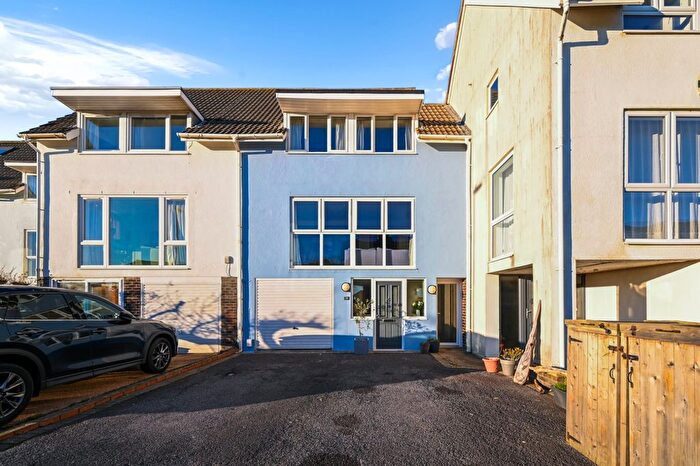
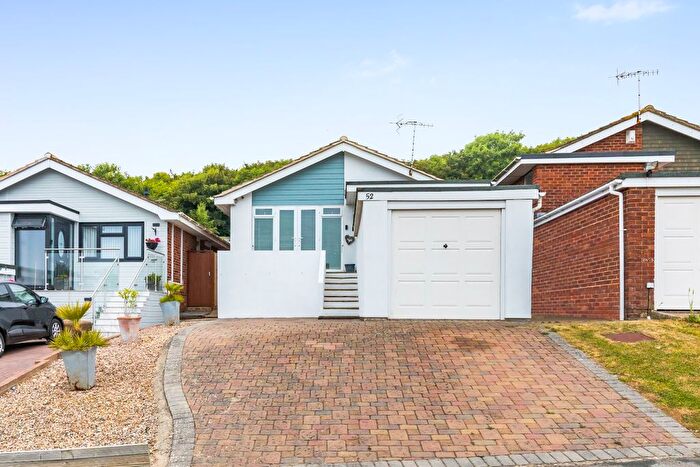
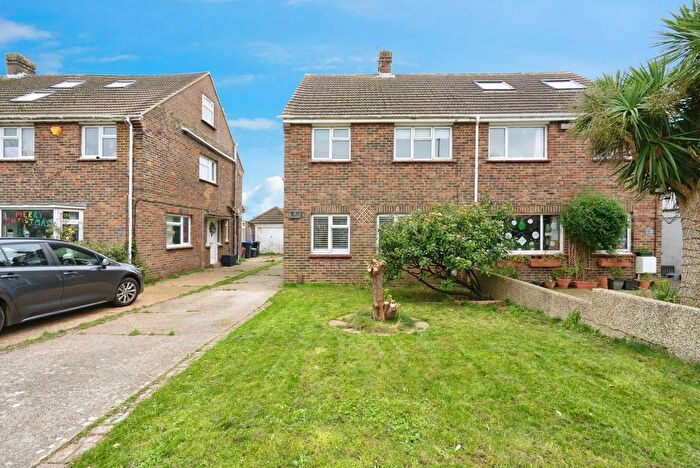
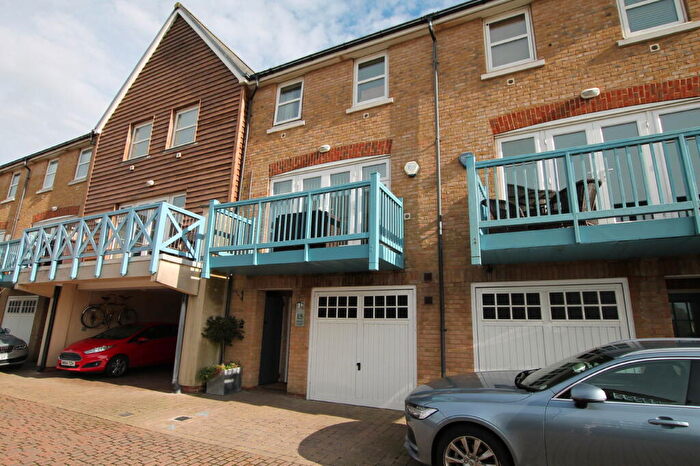
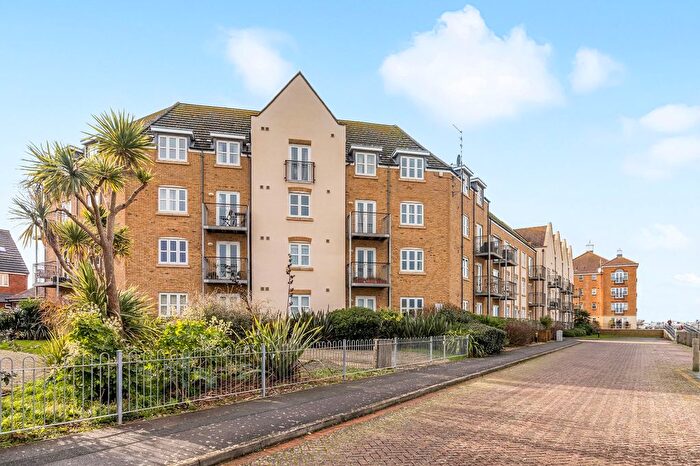
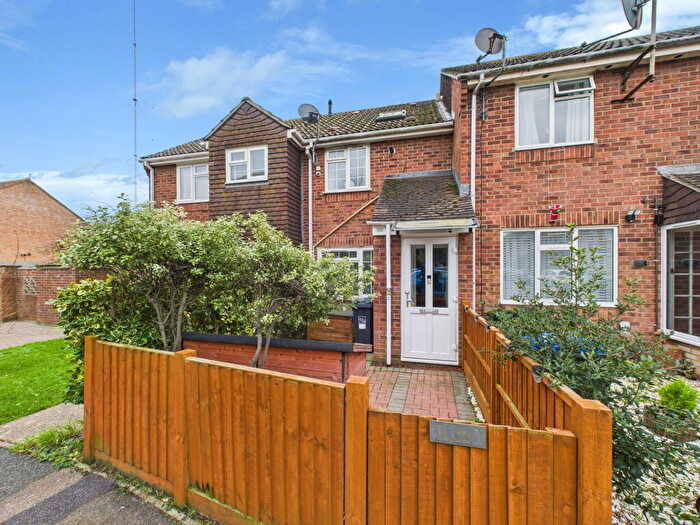
Properties for sale in Buckingham
Roads and Postcodes in Buckingham
Navigate through our locations to find the location of your next house in Buckingham, Shoreham-by-sea for sale or to rent.
| Streets | Postcodes |
|---|---|
| Amberley Close | BN43 5GY |
| Annington Gardens | BN43 5GS |
| Ashlings Way | BN43 6JT |
| Bay Tree Close | BN43 6JN |
| Berberis Court | BN43 6JA |
| Bergamot Crescent | BN43 6JH |
| Blackpatch Grove | BN43 5GT |
| Buckingham Mews | BN43 6AJ |
| Chanctonbury Drive | BN43 5FR BN43 5FS BN43 5GW |
| Cissbury Way | BN43 5FW |
| Coventina Close | BN43 6DF |
| Cypress Close | BN43 6AE |
| Downside | BN43 6HB BN43 6HD BN43 6HE BN43 6HF BN43 6HG BN43 6HH |
| Downside Close | BN43 6AF |
| Downsway | BN43 5GN |
| Edburton Gardens | BN43 5GR |
| Elm Close | BN43 5GP |
| Fennel Walk | BN43 6JD |
| Garden Close | BN43 6BR BN43 6BS |
| Greenways Crescent | BN43 6HP BN43 6HQ BN43 6HR BN43 6HS |
| Japonica Close | BN43 6JL |
| Juniper Walk | BN43 6JE |
| Lavender Hill | BN43 6JB |
| Marjoram Place | BN43 6HZ |
| Mill Avenue | BN43 5GF |
| Mill Hill | BN43 5FA BN43 5TG BN43 5TH |
| Mill Hill Close | BN43 5TP |
| Mill Hill Drive | BN43 5TJ BN43 5TL |
| Mill Hill Gardens | BN43 5TN |
| New Barn Close | BN43 6HJ |
| New Barn Road | BN43 6HL BN43 6HN |
| Newtimber Gardens | BN43 5GQ |
| Norman Crescent | BN43 6AH |
| Normans Court | BN43 5FT |
| Parkside | BN43 6HA |
| Ravensbourne Avenue | BN43 6AA BN43 6AB |
| Ravensbourne Close | BN43 6AD |
| Rosemary Drive | BN43 6HT |
| Saffron Close | BN43 6JF |
| Saxons | BN43 5JE |
| Slonk Hill Road | BN43 6HX BN43 6HY |
| Steyning Road | BN43 5FD BN43 5FH |
| Tarragon Way | BN43 6JG |
| The Drive | BN43 5GA BN43 5GB BN43 5GD BN43 5GE |
| The Driveway | BN43 5GG |
| The Lynchetts | BN43 5GZ |
| The Orchard | BN43 6JP |
| Thyme Close | BN43 6JJ |
| Tottington Way | BN43 6HU |
| Truleigh Way | BN43 6HW |
| Upper Shoreham Road | BN43 5QE BN43 6BA BN43 6BD BN43 6BF BN43 6BG BN43 6TD |
| Warwick Walk | BN43 5FY |
| Wessex Walk | BN43 5FZ |
| Westmoreland Walk | BN43 5FX |
| Wolstonbury Walk | BN43 5GU |
| Wood View Court | BN43 6AL |
| Woodview | BN43 6AG |
Transport near Buckingham
- FAQ
- Price Paid By Year
- Property Type Price
Frequently asked questions about Buckingham
What is the average price for a property for sale in Buckingham?
The average price for a property for sale in Buckingham is £504,773. This amount is 10% higher than the average price in Shoreham-by-sea. There are 1,982 property listings for sale in Buckingham.
What streets have the most expensive properties for sale in Buckingham?
The streets with the most expensive properties for sale in Buckingham are Mill Hill at an average of £1,116,250, The Driveway at an average of £762,000 and Parkside at an average of £747,290.
What streets have the most affordable properties for sale in Buckingham?
The streets with the most affordable properties for sale in Buckingham are Normans Court at an average of £213,666, Wessex Walk at an average of £322,500 and Cissbury Way at an average of £327,833.
Which train stations are available in or near Buckingham?
Some of the train stations available in or near Buckingham are Shoreham-By-Sea, Southwick and Fishersgate.
Property Price Paid in Buckingham by Year
The average sold property price by year was:
| Year | Average Sold Price | Price Change |
Sold Properties
|
|---|---|---|---|
| 2025 | £492,476 | -2% |
36 Properties |
| 2024 | £501,777 | 4% |
63 Properties |
| 2023 | £481,717 | -11% |
48 Properties |
| 2022 | £533,741 | 8% |
60 Properties |
| 2021 | £490,529 | 12% |
60 Properties |
| 2020 | £433,916 | 4% |
49 Properties |
| 2019 | £418,503 | 4% |
75 Properties |
| 2018 | £402,354 | 4% |
69 Properties |
| 2017 | £385,834 | -10% |
46 Properties |
| 2016 | £423,050 | 17% |
60 Properties |
| 2015 | £351,688 | 11% |
81 Properties |
| 2014 | £313,552 | 9% |
69 Properties |
| 2013 | £284,941 | 0,5% |
71 Properties |
| 2012 | £283,602 | 1% |
51 Properties |
| 2011 | £282,131 | 5% |
54 Properties |
| 2010 | £266,780 | 6% |
62 Properties |
| 2009 | £250,370 | -4% |
55 Properties |
| 2008 | £261,387 | -2% |
45 Properties |
| 2007 | £266,268 | 9% |
94 Properties |
| 2006 | £242,230 | 7% |
84 Properties |
| 2005 | £225,495 | 4% |
80 Properties |
| 2004 | £217,390 | 12% |
77 Properties |
| 2003 | £192,259 | 7% |
73 Properties |
| 2002 | £179,247 | 25% |
94 Properties |
| 2001 | £135,230 | 4% |
89 Properties |
| 2000 | £129,871 | 21% |
78 Properties |
| 1999 | £102,531 | 13% |
80 Properties |
| 1998 | £89,419 | 5% |
85 Properties |
| 1997 | £85,196 | 14% |
75 Properties |
| 1996 | £72,995 | 4% |
86 Properties |
| 1995 | £70,145 | - |
89 Properties |
Property Price per Property Type in Buckingham
Here you can find historic sold price data in order to help with your property search.
The average Property Paid Price for specific property types in the last three years are:
| Property Type | Average Sold Price | Sold Properties |
|---|---|---|
| Semi Detached House | £479,239.00 | 82 Semi Detached Houses |
| Detached House | £620,413.00 | 75 Detached Houses |
| Terraced House | £397,079.00 | 44 Terraced Houses |
| Flat | £198,000.00 | 6 Flats |

