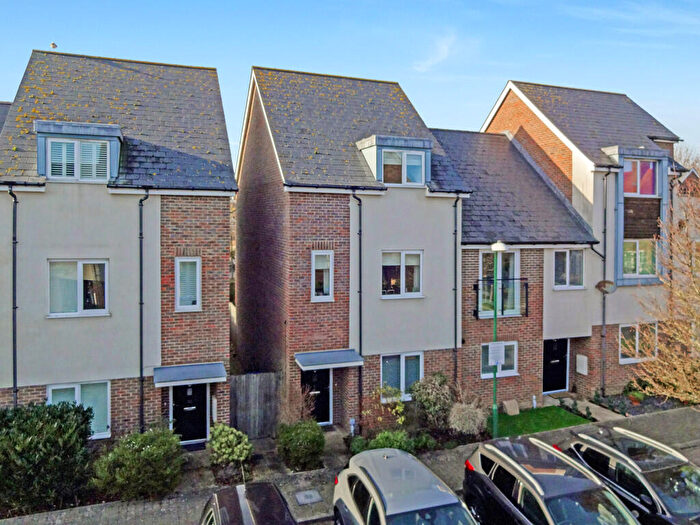
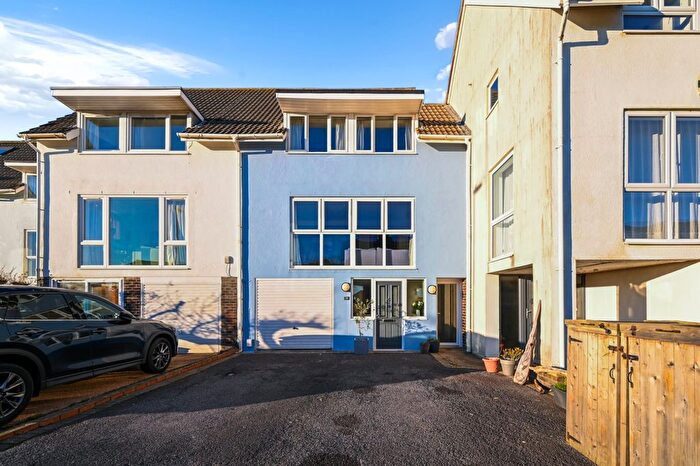
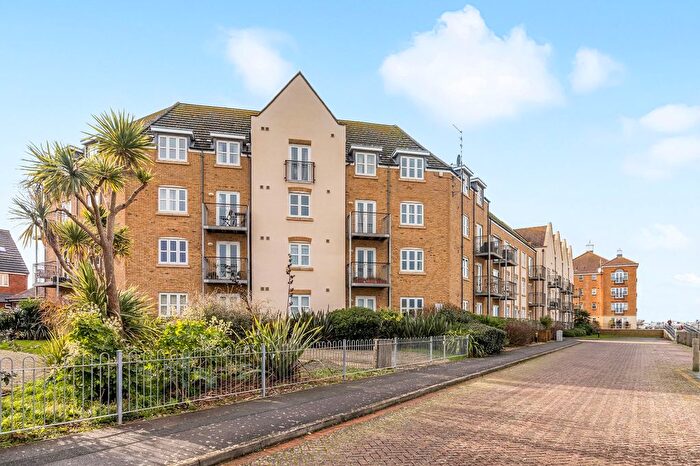
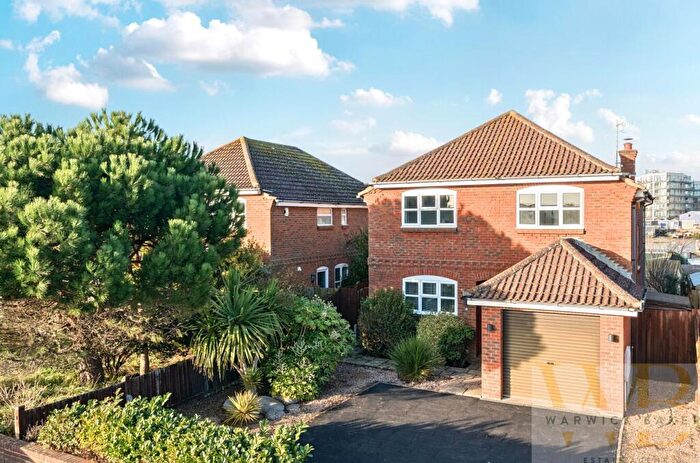
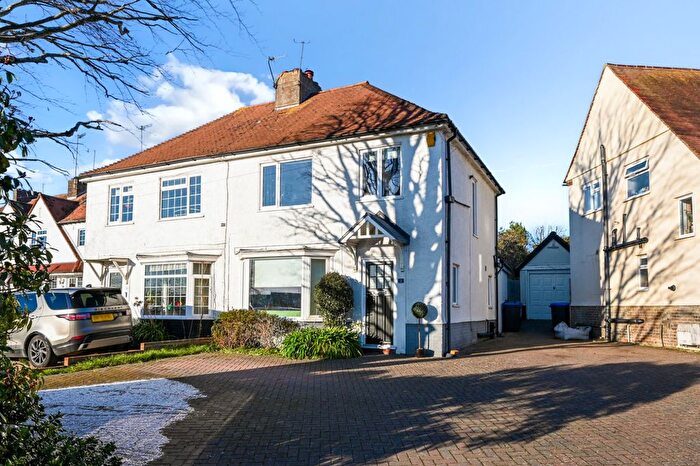
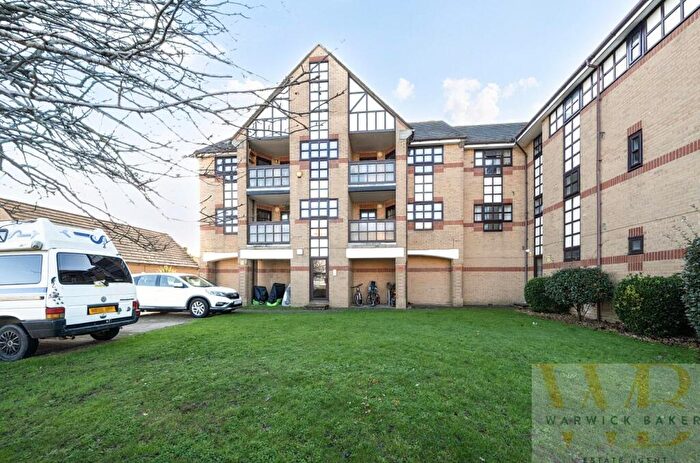
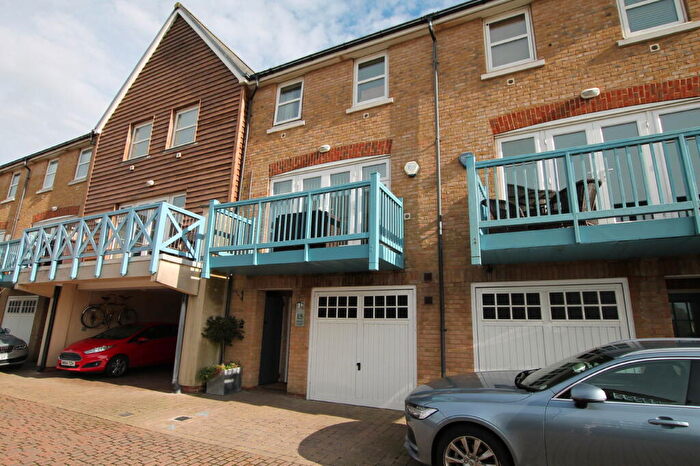
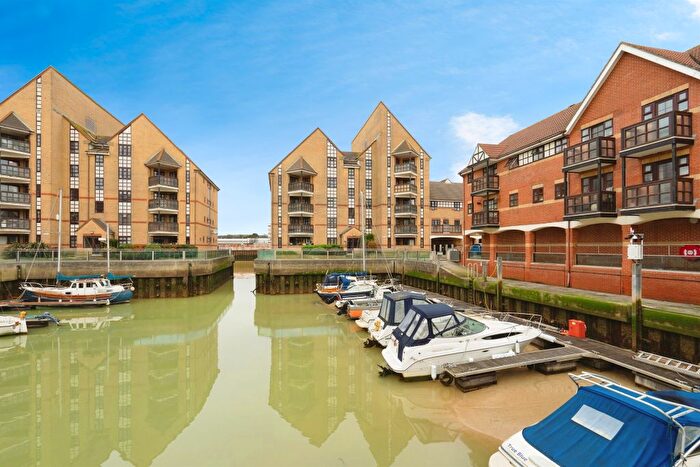
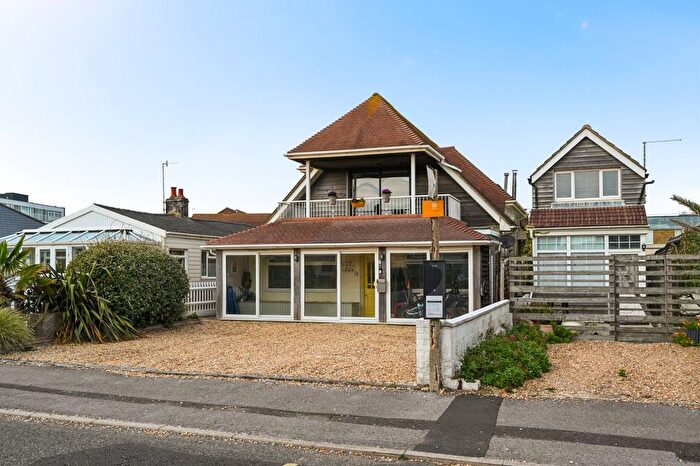
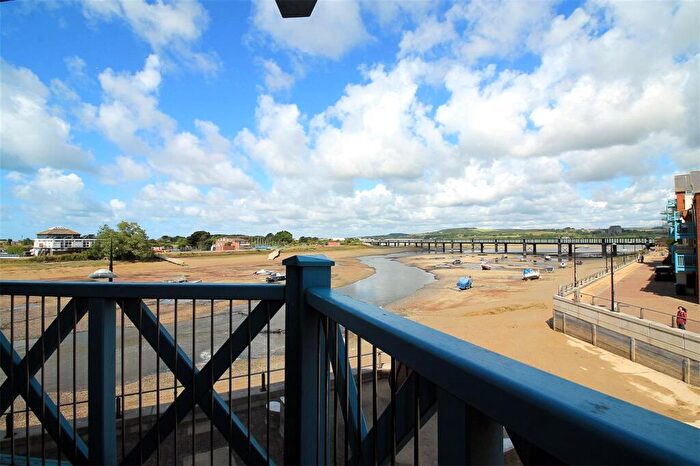
Houses for sale & to rent in Marine, Shoreham-by-sea
House Prices in Marine
Properties in Marine have an average house price of £531,766.00 and had 308 Property Transactions within the last 3 years¹.
Marine is an area in Shoreham-by-sea, West Sussex with 2,065 households², where the most expensive property was sold for £2,785,000.00.
Properties for sale in Marine
Roads and Postcodes in Marine
Navigate through our locations to find the location of your next house in Marine, Shoreham-by-sea for sale or to rent.
| Streets | Postcodes |
|---|---|
| Admirals Walk | BN43 5RX |
| Anchor Close | BN43 5BY BN43 5BZ |
| Beach Green | BN43 5LQ BN43 5YA BN43 5YD BN43 5YE BN43 5YG BN43 5YL |
| Beach Road | BN43 5LJ |
| Benbow Close | BN43 5RY |
| Bluebird Close | BN43 5PL |
| Brighton Road | BN43 5LD BN43 5LT BN43 5YH |
| Britannia Avenue | BN43 5PJ BN43 5PX |
| Cheal Close | BN43 5RQ |
| Collingwood Court | BN43 5SB |
| East Meadway | BN43 5RF |
| Emerald Quay | BN43 5EW BN43 5JH BN43 5JJ BN43 5JL BN43 5JN BN43 5JP BN43 5JQ BN43 5JR BN43 5JS BN43 5JX BN43 5JY |
| Falcon Close | BN43 5HN |
| Ferry Road | BN43 5RA BN43 5SE BN43 5YJ |
| Feversham Close | BN43 5HD |
| Fishermans Walk | BN43 5LW |
| Flag Square | BN43 5RZ |
| Fort Haven | BN43 5HY |
| Fowey Close | BN43 5HE |
| Hancock Way | BN43 5JG BN43 5JT |
| Harbour Way | BN43 5BF BN43 5BG BN43 5BX BN43 5HG BN43 5HH BN43 5HJ BN43 5HZ BN43 5PH |
| Hardy Close | BN43 5SA |
| Harriet Place | BN43 5PG BN43 5PU |
| Havenside | BN43 5LN |
| Hopewell Close | BN43 5PN |
| Joseph Walk | BN43 5PP |
| Kings Crescent | BN43 5LE |
| Kings Gap | BN43 5QU |
| Kings Walk | BN43 5LG |
| Kingston Bay Road | BN43 5HP |
| Lower Beach Road | BN43 5RR |
| Mardyke | BN43 5LL |
| Mariners Close | BN43 5LU |
| Old Fort Road | BN43 5HA BN43 5HB BN43 5HL BN43 5HR BN43 5RG BN43 5RJ BN43 5RL |
| Ormonde Way | BN43 5YB |
| Osprey Walk | BN43 5PW |
| Providence Way | BN43 5QF |
| Raleigh Close | BN43 5LX |
| River Close | BN43 5YF |
| Riverside | BN43 5RU BN43 5RW |
| Riverside Road | BN43 5RB BN43 5RT |
| Sea Spray Avenue | BN43 5PR |
| Seaford Way | BN43 5PT |
| Seahaven Gardens | BN43 5NX |
| Shingle Road | BN43 5RH |
| South Beach | BN43 5LY |
| Sussex Wharf | BN43 5BH BN43 5BJ BN43 5PD BN43 5PE BN43 5PF BN43 5PS |
| The Burrells | BN43 5HF |
| The Marlinespike | BN43 5RD |
| The Meadway | BN43 5RN BN43 5RP |
| The Moorings | BN43 5JB |
| Weald Dyke | BN43 5LP |
| West Beach | BN43 5LF |
| Widewater Court | BN43 5LS |
| Winterton Way | BN43 5RE |
| Woodards View | BN43 5LH BN43 5LR |
Transport near Marine
- FAQ
- Price Paid By Year
- Property Type Price
Frequently asked questions about Marine
What is the average price for a property for sale in Marine?
The average price for a property for sale in Marine is £531,766. This amount is 16% higher than the average price in Shoreham-by-sea. There are 1,198 property listings for sale in Marine.
What streets have the most expensive properties for sale in Marine?
The streets with the most expensive properties for sale in Marine are Old Fort Road at an average of £1,186,810, Feversham Close at an average of £785,000 and The Burrells at an average of £756,666.
What streets have the most affordable properties for sale in Marine?
The streets with the most affordable properties for sale in Marine are Sussex Wharf at an average of £271,176, Emerald Quay at an average of £296,377 and Ferry Road at an average of £339,666.
Which train stations are available in or near Marine?
Some of the train stations available in or near Marine are Shoreham-By-Sea, Southwick and Fishersgate.
Property Price Paid in Marine by Year
The average sold property price by year was:
| Year | Average Sold Price | Price Change |
Sold Properties
|
|---|---|---|---|
| 2025 | £470,159 | -6% |
38 Properties |
| 2024 | £498,435 | -13% |
95 Properties |
| 2023 | £564,067 | 0,3% |
86 Properties |
| 2022 | £562,435 | 21% |
89 Properties |
| 2021 | £445,353 | -7% |
124 Properties |
| 2020 | £475,783 | 15% |
78 Properties |
| 2019 | £402,275 | -1% |
92 Properties |
| 2018 | £406,650 | 16% |
94 Properties |
| 2017 | £342,701 | -24% |
110 Properties |
| 2016 | £425,585 | 23% |
108 Properties |
| 2015 | £328,951 | 7% |
139 Properties |
| 2014 | £304,624 | 17% |
135 Properties |
| 2013 | £251,934 | -12% |
119 Properties |
| 2012 | £282,499 | -2% |
102 Properties |
| 2011 | £287,436 | 2% |
100 Properties |
| 2010 | £282,801 | 15% |
95 Properties |
| 2009 | £240,750 | 8% |
81 Properties |
| 2008 | £221,243 | -10% |
94 Properties |
| 2007 | £243,585 | 11% |
255 Properties |
| 2006 | £217,274 | -5% |
240 Properties |
| 2005 | £227,266 | 5% |
125 Properties |
| 2004 | £216,597 | 9% |
127 Properties |
| 2003 | £197,567 | 12% |
136 Properties |
| 2002 | £174,403 | 17% |
150 Properties |
| 2001 | £144,289 | 10% |
152 Properties |
| 2000 | £130,215 | 21% |
132 Properties |
| 1999 | £102,428 | 14% |
136 Properties |
| 1998 | £88,594 | 13% |
109 Properties |
| 1997 | £76,739 | 11% |
118 Properties |
| 1996 | £68,640 | 1% |
116 Properties |
| 1995 | £67,966 | - |
110 Properties |
Property Price per Property Type in Marine
Here you can find historic sold price data in order to help with your property search.
The average Property Paid Price for specific property types in the last three years are:
| Property Type | Average Sold Price | Sold Properties |
|---|---|---|
| Semi Detached House | £609,584.00 | 46 Semi Detached Houses |
| Detached House | £1,010,496.00 | 68 Detached Houses |
| Terraced House | £461,866.00 | 67 Terraced Houses |
| Flat | £284,128.00 | 127 Flats |

