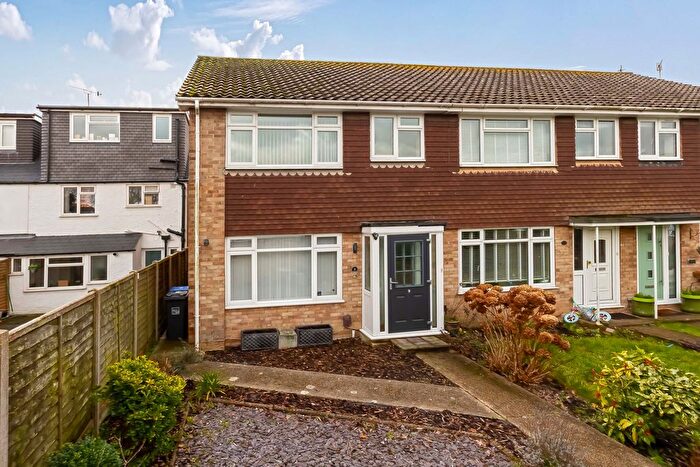
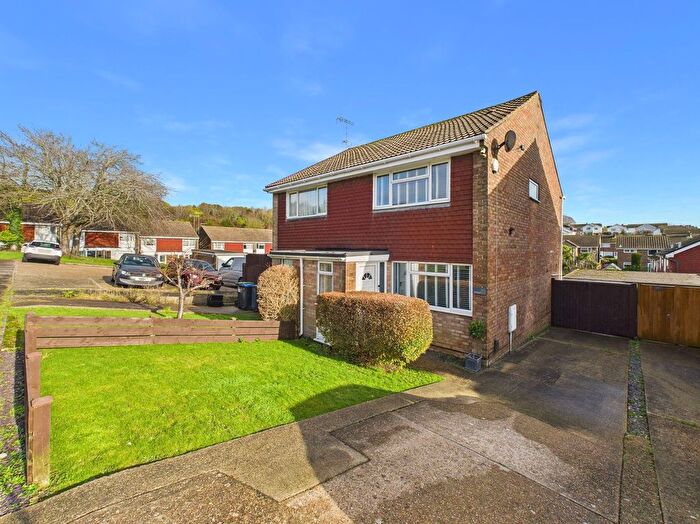
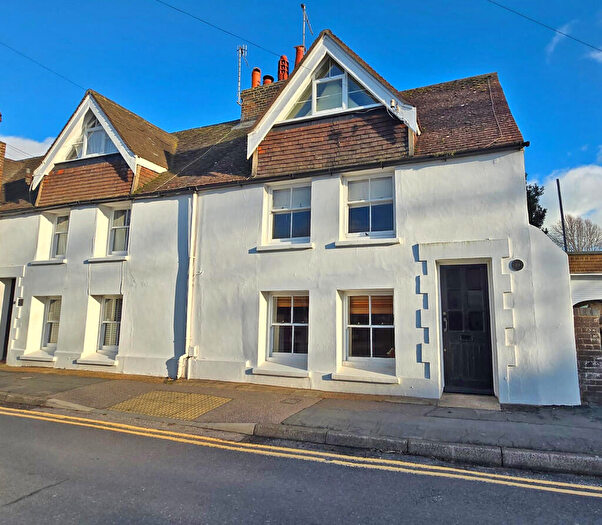
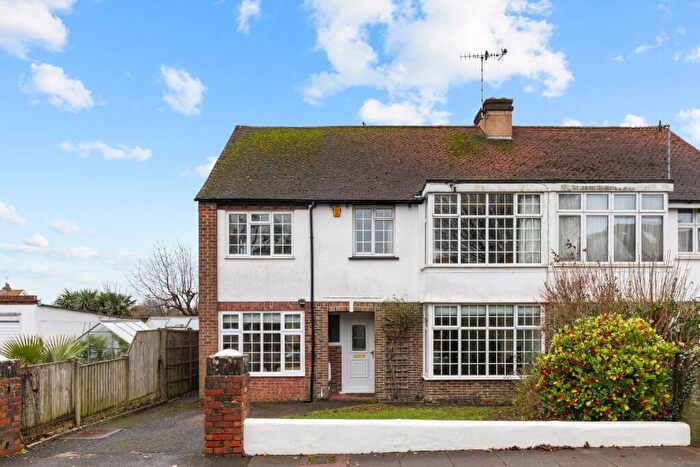
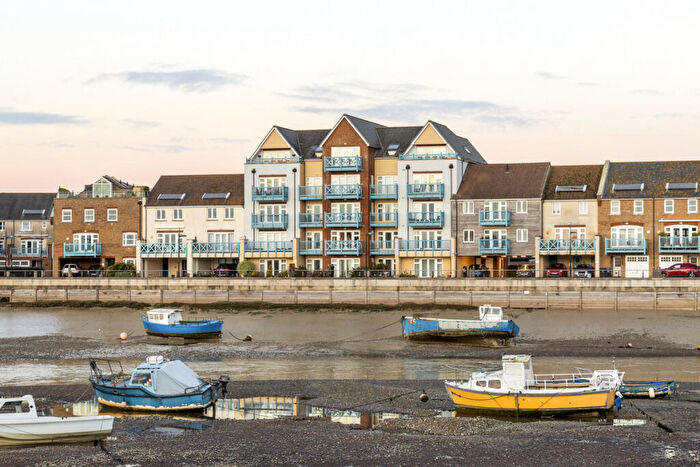
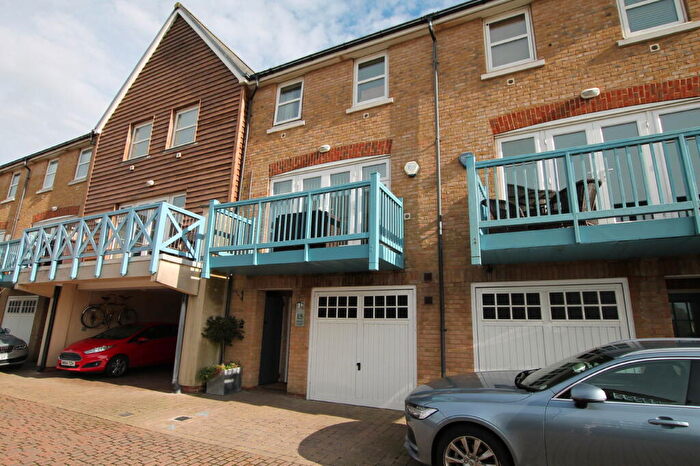
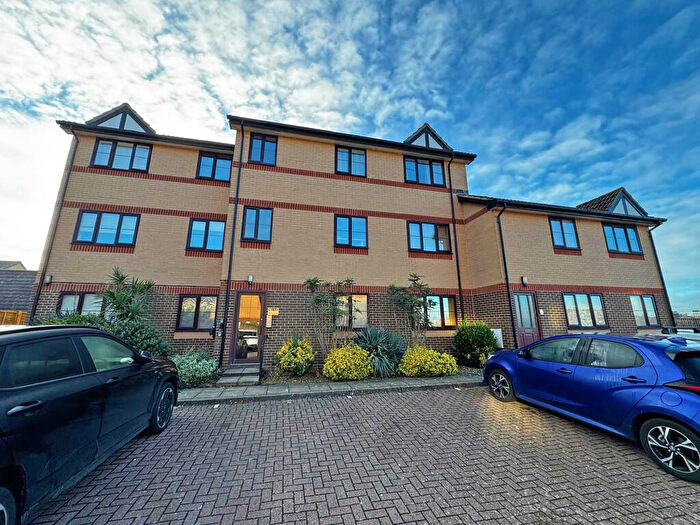
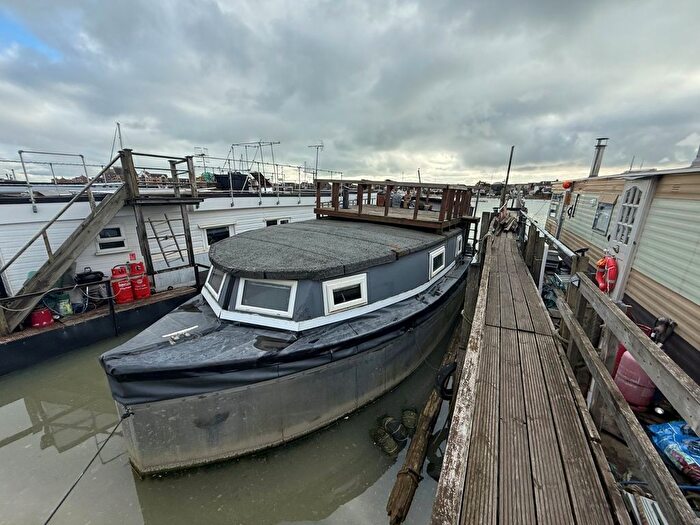
Houses for sale & to rent in St Nicolas, Shoreham-by-sea
House Prices in St Nicolas
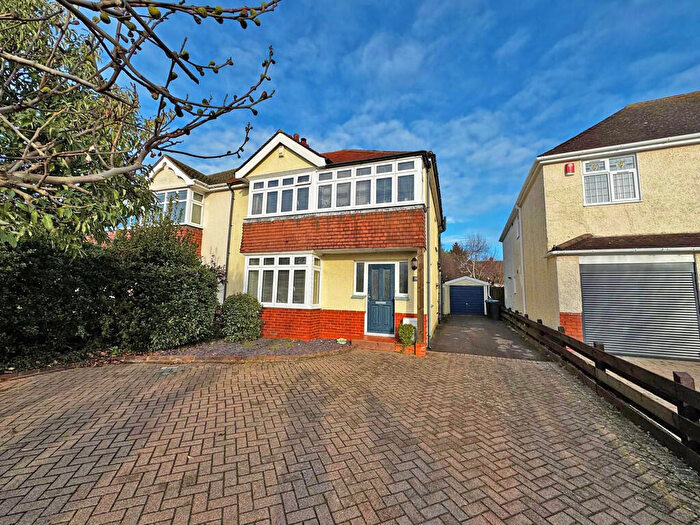
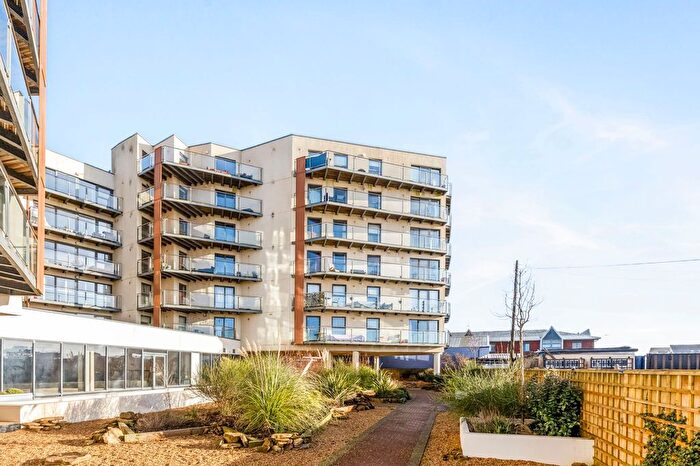
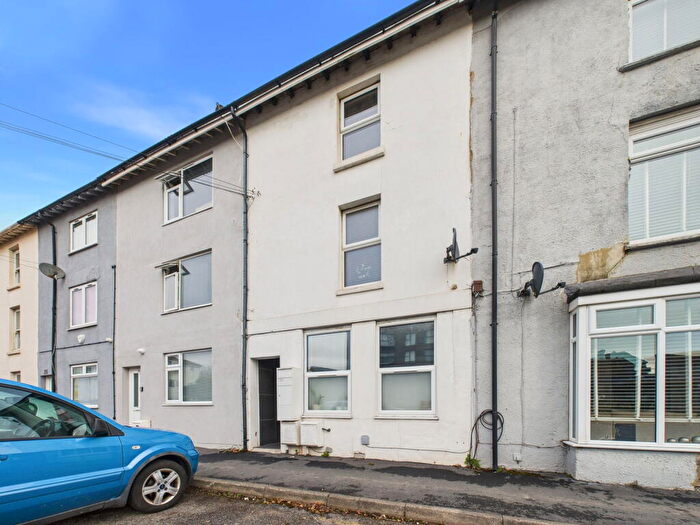
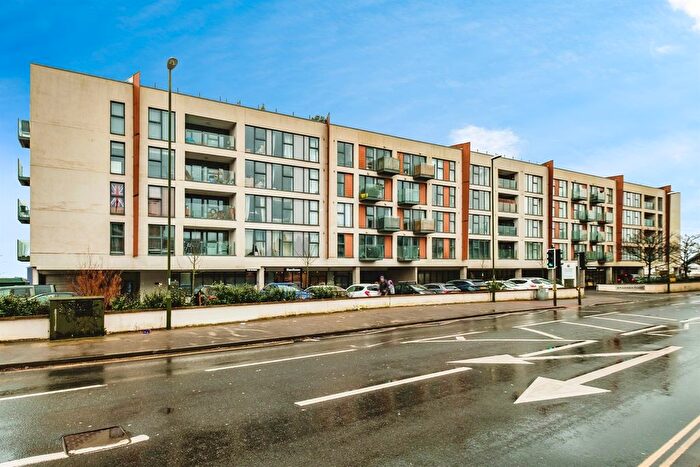
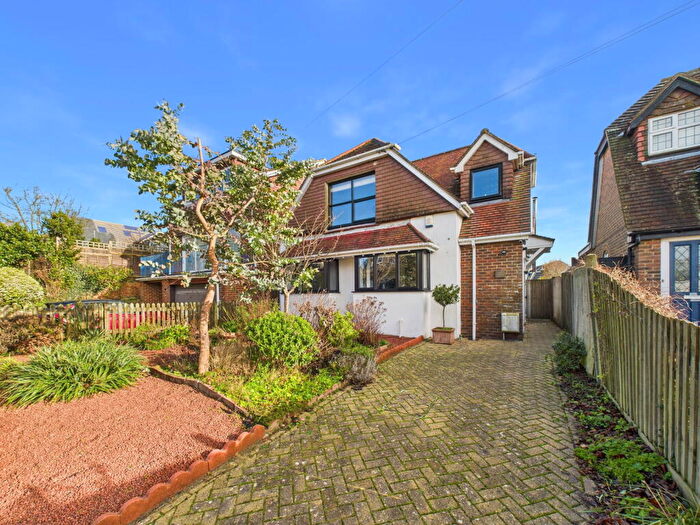
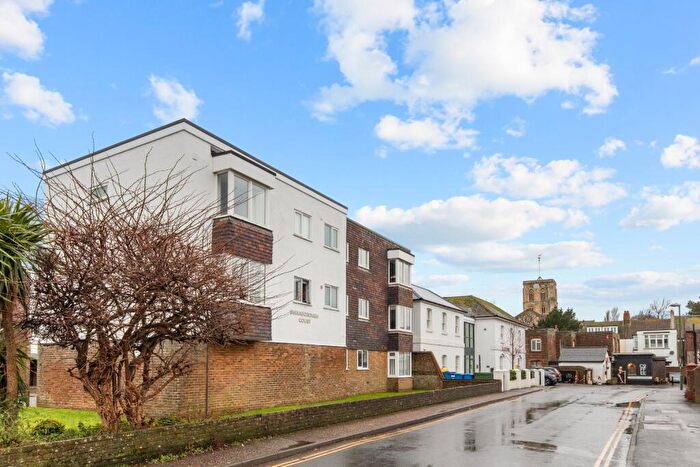
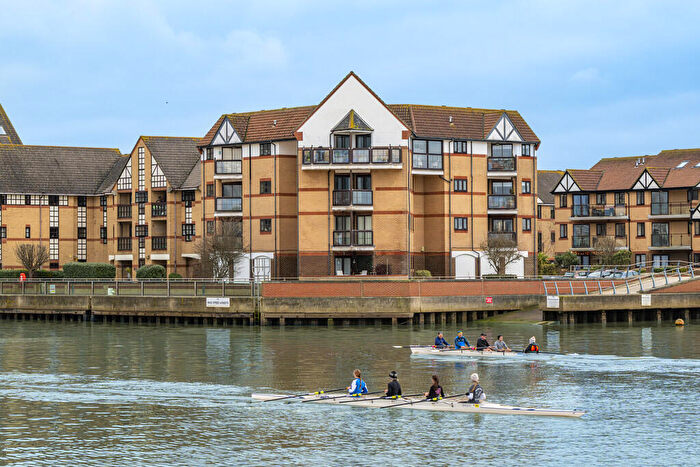
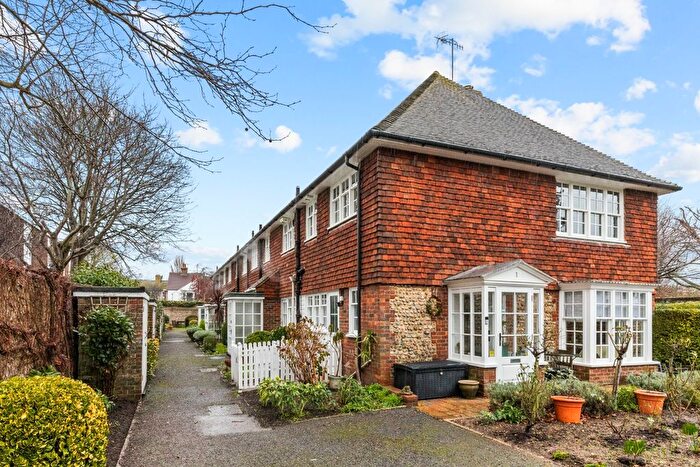
Properties in St Nicolas have an average house price of £461,685.00 and had 129 Property Transactions within the last 3 years¹.
St Nicolas is an area in Shoreham-by-sea, West Sussex with 1,719 households², where the most expensive property was sold for £1,200,000.00.
Properties for sale in St Nicolas
Roads and Postcodes in St Nicolas
Navigate through our locations to find the location of your next house in St Nicolas, Shoreham-by-sea for sale or to rent.
| Streets | Postcodes |
|---|---|
| Adur Avenue | BN43 5NL BN43 5NN |
| Adur Road | BN43 5NP |
| Buckingham Avenue | BN43 5GL |
| Buckingham Road | BN43 5TZ BN43 5UA BN43 5UB BN43 5UD |
| Buckingham Street | BN43 5TB |
| Colvill Avenue | BN43 5WN |
| Connaught Avenue | BN43 5WJ BN43 5WL BN43 5WP |
| Downsway | BN43 5GH |
| Erringham Road | BN43 5NQ |
| Frampton Place | BN43 5SF |
| Freehold Street | BN43 5TQ |
| Greenacres | BN43 5WY BN43 5XL |
| Hamfield Avenue | BN43 5TY |
| Hebe Road | BN43 5WE |
| Lagoon Way | BN43 5QN |
| Lesser Foxholes | BN43 5NT |
| Lodge Court | BN43 5NU |
| Mill Lane | BN43 5AB BN43 5AG BN43 5NA |
| Northbourne Close | BN43 5AP |
| Old Shoreham Road | BN43 5TD BN43 5TE BN43 5TF |
| Orchard Close | BN43 5UT |
| Overmead | BN43 5NS |
| Oxen Avenue | BN43 5AF BN43 5AS |
| Queens Place | BN43 5AA BN43 5AU BN43 5AT |
| Ravens Road | BN43 5AJ BN43 5AW BN43 5AX BN43 5AQ |
| Rope Walk | BN43 5WW |
| Salt Marsh Road | BN43 5QJ BN43 5QL BN43 5QP BN43 5QQ BN43 5QR BN43 5QS |
| Southdown Road | BN43 5AL BN43 5AN BN43 5AY BN43 5WT |
| St Nicolas Lane | BN43 5NH BN43 5NY |
| Steyning Road | BN43 5NG |
| Swiss Gardens | BN43 5WH |
| The Avenue | BN43 5GJ |
| The Close | BN43 5AH BN43 5AR |
| The Paddock | BN43 5NW |
| The Rowans | BN43 5PQ |
| The Street | BN43 5NJ |
| Upper Shoreham Road | BN43 5NB BN43 5ND BN43 5NE BN43 5NF BN43 5QA BN43 5QB BN43 5QD BN43 5WQ |
| Valentine Close | BN43 5NR |
| Victoria Road | BN43 5LA BN43 5WR BN43 5WS |
| Windlesham Gardens | BN43 5AD BN43 5AZ |
| Windlesham Road | BN43 5AE |
Transport near St Nicolas
- FAQ
- Price Paid By Year
- Property Type Price
Frequently asked questions about St Nicolas
What is the average price for a property for sale in St Nicolas?
The average price for a property for sale in St Nicolas is £461,685. This amount is 3% higher than the average price in Shoreham-by-sea. There are 1,001 property listings for sale in St Nicolas.
What streets have the most expensive properties for sale in St Nicolas?
The streets with the most expensive properties for sale in St Nicolas are Windlesham Gardens at an average of £960,000, Erringham Road at an average of £950,000 and Mill Lane at an average of £870,200.
What streets have the most affordable properties for sale in St Nicolas?
The streets with the most affordable properties for sale in St Nicolas are Swiss Gardens at an average of £150,882, Buckingham Street at an average of £198,884 and The Close at an average of £295,833.
Which train stations are available in or near St Nicolas?
Some of the train stations available in or near St Nicolas are Shoreham-By-Sea, Southwick and Lancing.
Property Price Paid in St Nicolas by Year
The average sold property price by year was:
| Year | Average Sold Price | Price Change |
Sold Properties
|
|---|---|---|---|
| 2025 | £480,158 | 3% |
34 Properties |
| 2024 | £465,138 | 5% |
50 Properties |
| 2023 | £443,892 | -15% |
45 Properties |
| 2022 | £508,863 | -5% |
79 Properties |
| 2021 | £533,080 | 6% |
67 Properties |
| 2020 | £499,576 | 27% |
63 Properties |
| 2019 | £366,078 | -14% |
66 Properties |
| 2018 | £418,204 | 2% |
89 Properties |
| 2017 | £410,341 | 7% |
82 Properties |
| 2016 | £380,036 | 9% |
87 Properties |
| 2015 | £345,520 | -9% |
85 Properties |
| 2014 | £376,452 | 15% |
74 Properties |
| 2013 | £318,395 | 6% |
63 Properties |
| 2012 | £300,806 | 7% |
66 Properties |
| 2011 | £279,849 | -1% |
80 Properties |
| 2010 | £283,061 | 8% |
56 Properties |
| 2009 | £259,821 | - |
57 Properties |
| 2008 | £259,857 | -8% |
52 Properties |
| 2007 | £280,998 | 17% |
91 Properties |
| 2006 | £233,204 | 8% |
108 Properties |
| 2005 | £213,987 | -11% |
126 Properties |
| 2004 | £236,822 | 19% |
67 Properties |
| 2003 | £192,352 | 2% |
84 Properties |
| 2002 | £189,278 | 23% |
95 Properties |
| 2001 | £145,822 | 8% |
88 Properties |
| 2000 | £133,869 | -0,3% |
85 Properties |
| 1999 | £134,294 | 28% |
97 Properties |
| 1998 | £96,160 | 20% |
82 Properties |
| 1997 | £76,592 | 1% |
80 Properties |
| 1996 | £75,567 | 2% |
89 Properties |
| 1995 | £74,326 | - |
80 Properties |
Property Price per Property Type in St Nicolas
Here you can find historic sold price data in order to help with your property search.
The average Property Paid Price for specific property types in the last three years are:
| Property Type | Average Sold Price | Sold Properties |
|---|---|---|
| Semi Detached House | £577,263.00 | 38 Semi Detached Houses |
| Detached House | £698,785.00 | 21 Detached Houses |
| Terraced House | £423,115.00 | 38 Terraced Houses |
| Flat | £214,643.00 | 32 Flats |

