
Houses for sale & to rent in SN8 3BY, Burbage And The Bedwyns, Marlborough
House Prices in SN8 3BY, Burbage And The Bedwyns
Properties in SN8 3BY have no sales history available within the last 3 years. SN8 3BY is a postcode in Burbage And The Bedwyns, an area in Marlborough, Wiltshire, with 14 households².
Previously listed properties near SN8 3BY
![]()
If you are looking to sell your house, let it out, or receive a property valuation, an expert can help you.
Click the button below to get started.
Price Paid in SN8 3BY, Burbage And The Bedwyns
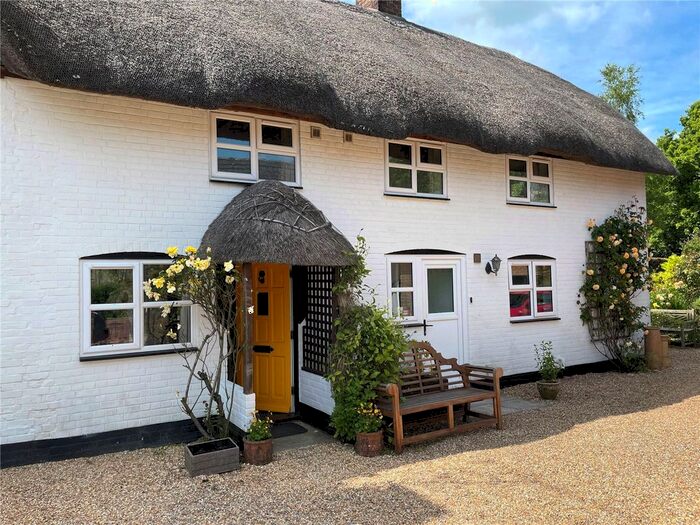
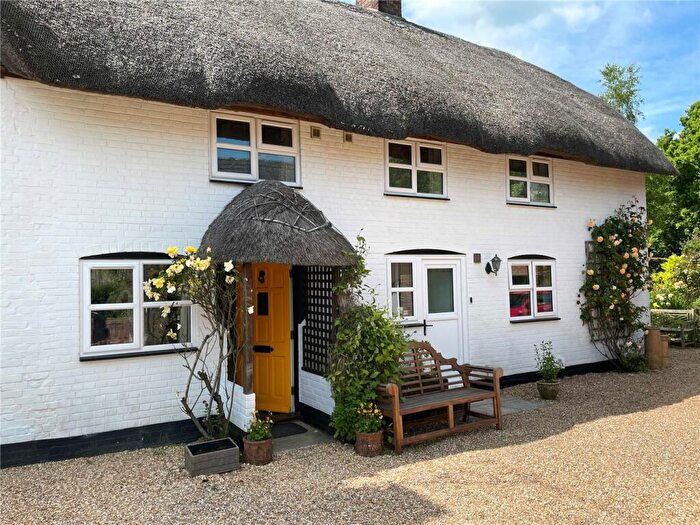
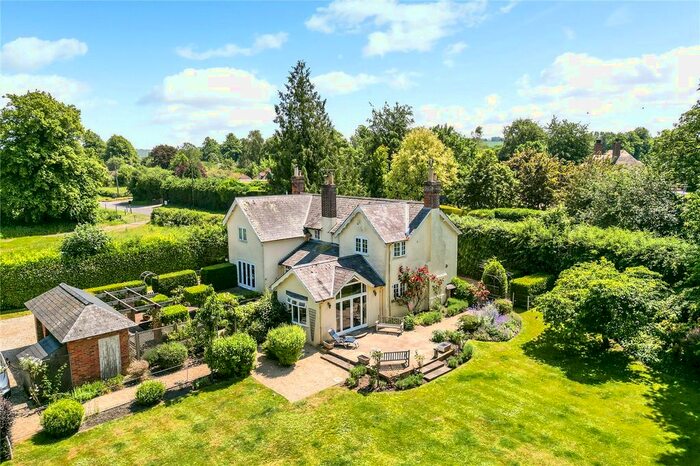
ROSE COTTAGE SN8 3BY, Burbage And The Bedwyns Marlborough
Property ROSE COTTAGE has been sold 3 times. The last time it was sold was in 03/10/2023 and the sold price was £27,500.00.
This other property, sold as a freehold on 03/10/2023, is a 176 sqm detached house with an EPC rating of D.
| Date | Price | Property Type | Tenure | Classification |
|---|---|---|---|---|
| 03/10/2023 | £27,500.00 | Other Property | freehold | Established Building |
| 15/02/2021 | £500,000.00 | Detached House | freehold | Established Building |
| 10/05/2001 | £188,500.00 | Detached House | freehold | Established Building |
MAYFIELD SN8 3BY, Burbage And The Bedwyns Marlborough
Property MAYFIELD has been sold 1 time. The last time it was sold was in 10/08/2018 and the sold price was £1,500,000.00.
This is a Detached House which was sold as a freehold in 10/08/2018
| Date | Price | Property Type | Tenure | Classification |
|---|---|---|---|---|
| 10/08/2018 | £1,500,000.00 | Detached House | freehold | Established Building |
OLD RAILWAY STATION SN8 3BY, Burbage And The Bedwyns Marlborough
Property OLD RAILWAY STATION has been sold 2 times. The last time it was sold was in 01/09/2015 and the sold price was £950,000.00.
This detached house, sold as a freehold on 01/09/2015, is a 334 sqm detached house with an EPC rating of D.
| Date | Price | Property Type | Tenure | Classification |
|---|---|---|---|---|
| 01/09/2015 | £950,000.00 | Detached House | freehold | Established Building |
| 09/05/2007 | £700,000.00 | Detached House | freehold | Established Building |
MOAT COTTAGE SN8 3BY, Burbage And The Bedwyns Marlborough
Property MOAT COTTAGE has been sold 2 times. The last time it was sold was in 16/11/2010 and the sold price was £854,000.00.
This detached house, sold as a freehold on 16/11/2010, is a 181 sqm detached house with an EPC rating of F.
| Date | Price | Property Type | Tenure | Classification |
|---|---|---|---|---|
| 16/11/2010 | £854,000.00 | Detached House | freehold | Established Building |
| 19/03/2004 | £580,000.00 | Detached House | freehold | Established Building |
CHAPEL HOUSE SN8 3BY, Burbage And The Bedwyns Marlborough
Property CHAPEL HOUSE has been sold 2 times. The last time it was sold was in 28/08/2009 and the sold price was £815,000.00.
This is a Detached House which was sold as a freehold in 28/08/2009
| Date | Price | Property Type | Tenure | Classification |
|---|---|---|---|---|
| 28/08/2009 | £815,000.00 | Detached House | freehold | Established Building |
| 13/04/1998 | £390,000.00 | Detached House | freehold | Established Building |
HIDDEN COTTAGE SN8 3BY, Burbage And The Bedwyns Marlborough
Property HIDDEN COTTAGE has been sold 1 time. The last time it was sold was in 06/12/2002 and the sold price was £249,000.00.
This is a Detached House which was sold as a freehold in 06/12/2002
| Date | Price | Property Type | Tenure | Classification |
|---|---|---|---|---|
| 06/12/2002 | £249,000.00 | Detached House | freehold | Established Building |
278 SN8 3BY, Burbage And The Bedwyns Marlborough
Property 278 has been sold 2 times. The last time it was sold was in 17/10/2002 and the sold price was £307,000.00.
This detached house, sold as a freehold on 17/10/2002, is a 186 sqm detached house with an EPC rating of E.
| Date | Price | Property Type | Tenure | Classification |
|---|---|---|---|---|
| 17/10/2002 | £307,000.00 | Detached House | freehold | Established Building |
| 15/10/1999 | £220,000.00 | Detached House | freehold | Established Building |
Transport near SN8 3BY

House price paid reports for SN8 3BY
Click on the buttons below to see price paid reports by year or property price:
- Price Paid By Year
Property Price Paid in SN8 3BY by Year
The average sold property price by year was:
| Year | Average Sold Price | Price Change |
Sold Properties
|
|---|---|---|---|
| 2021 | £500,000 | -200% |
1 Property |
| 2018 | £1,500,000 | 37% |
1 Property |
| 2015 | £950,000 | 10% |
1 Property |
| 2010 | £854,000 | 5% |
1 Property |
| 2009 | £815,000 | 14% |
1 Property |
| 2007 | £700,000 | 17% |
1 Property |
| 2004 | £580,000 | 52% |
1 Property |
| 2002 | £278,000 | 32% |
2 Properties |
| 2001 | £188,500 | -17% |
1 Property |
| 1999 | £220,000 | -77% |
1 Property |
| 1998 | £390,000 | - |
1 Property |