
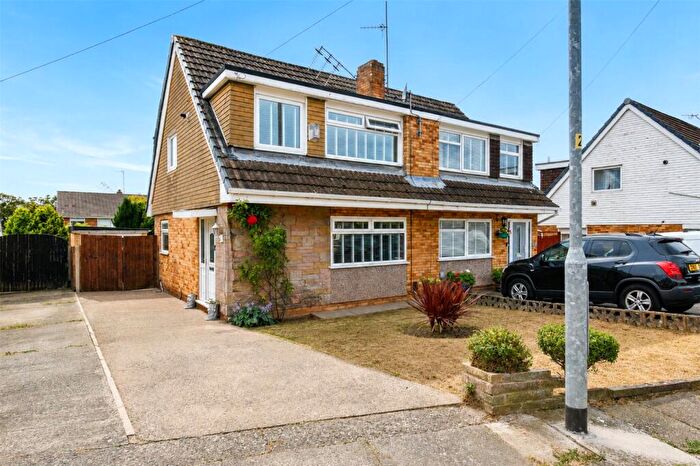
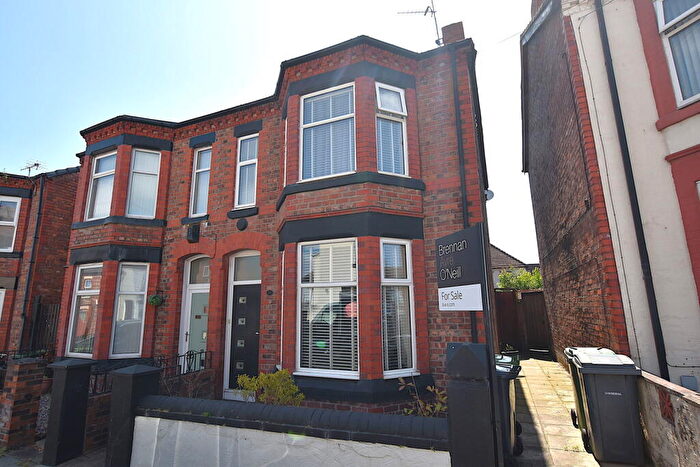
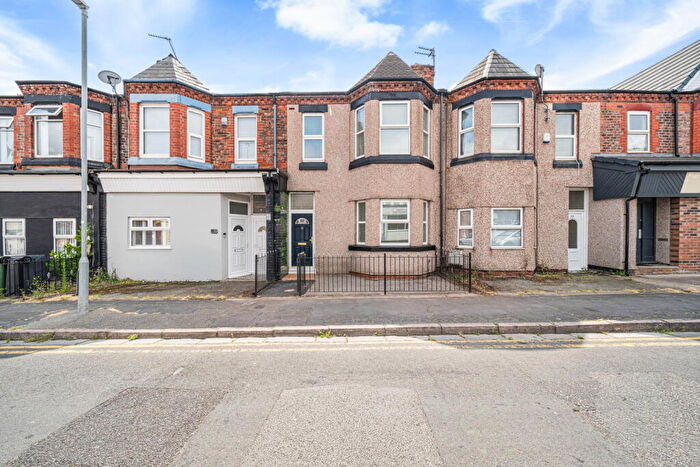
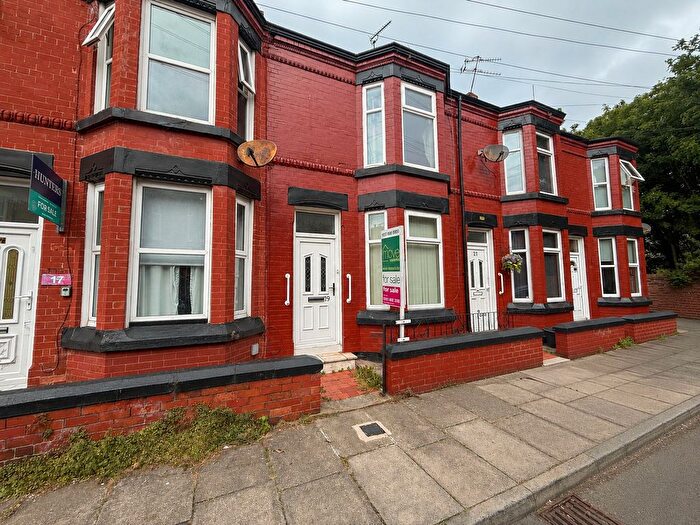
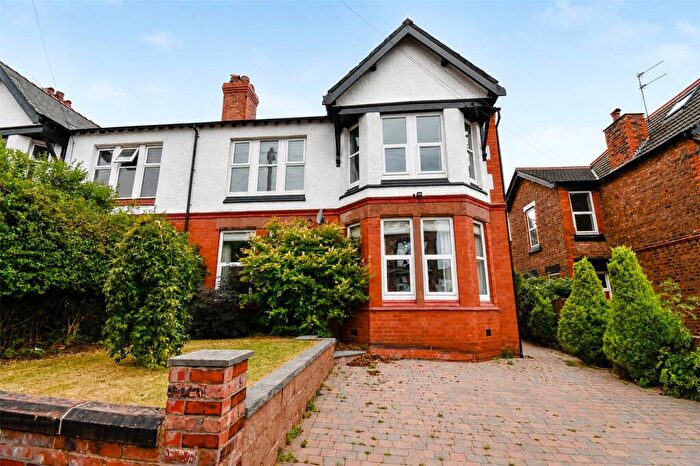
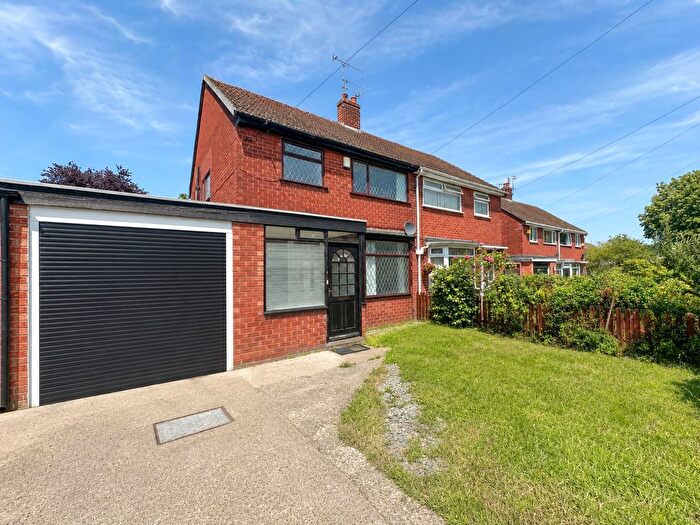
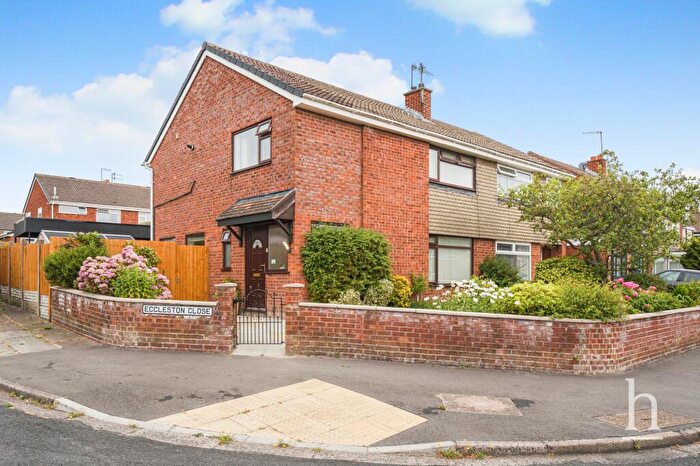
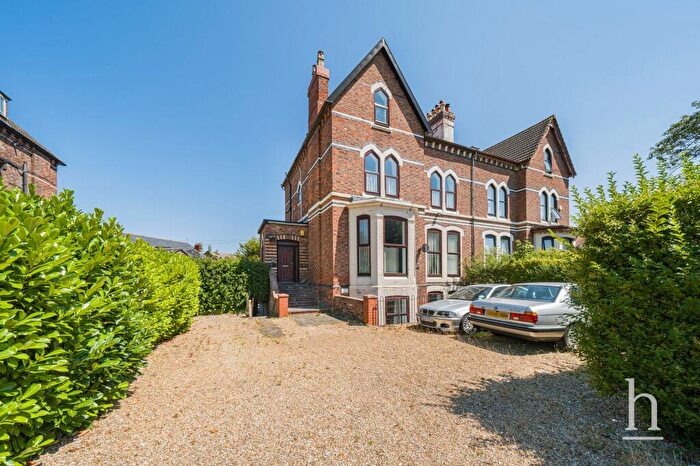
Houses for sale in Prenton, Wirral
House Prices in Prenton
Properties in Prenton have an average house price of £230k and had 1,570 Property Transactions within the last 3 years.¹
Prenton is an area in Wirral with 17,177 households², where the most expensive property was sold for £1.5M.
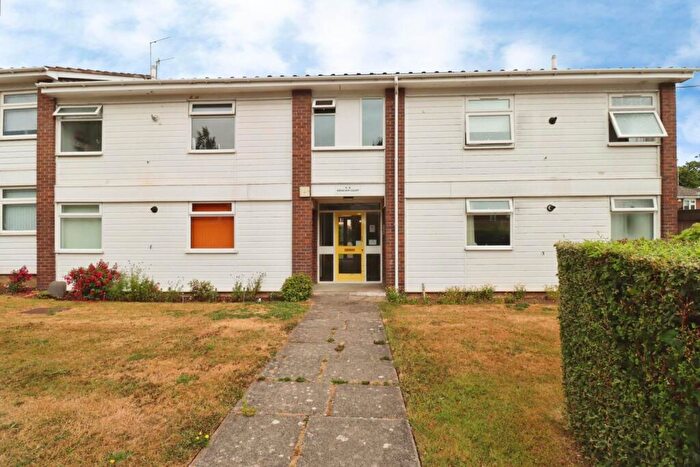
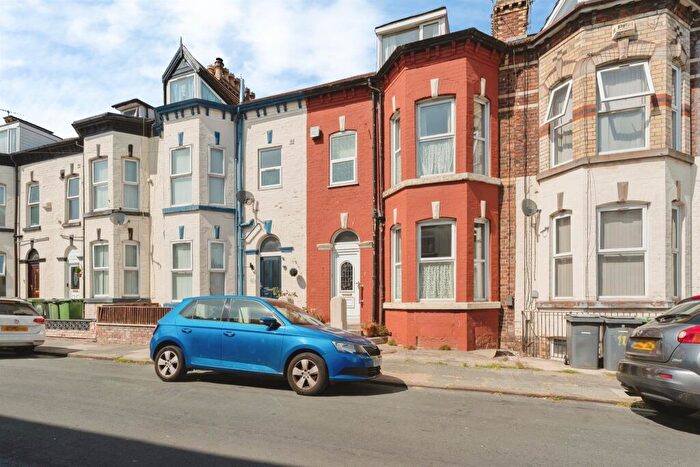
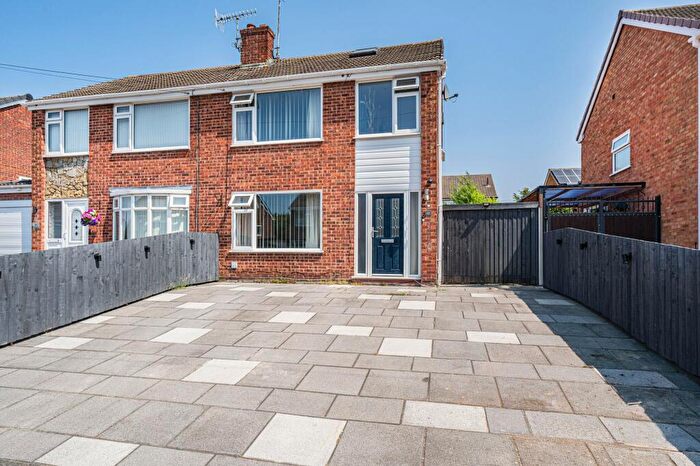
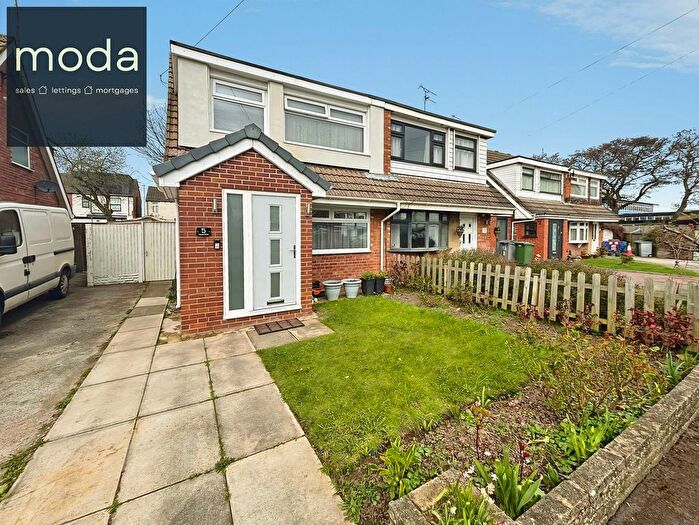
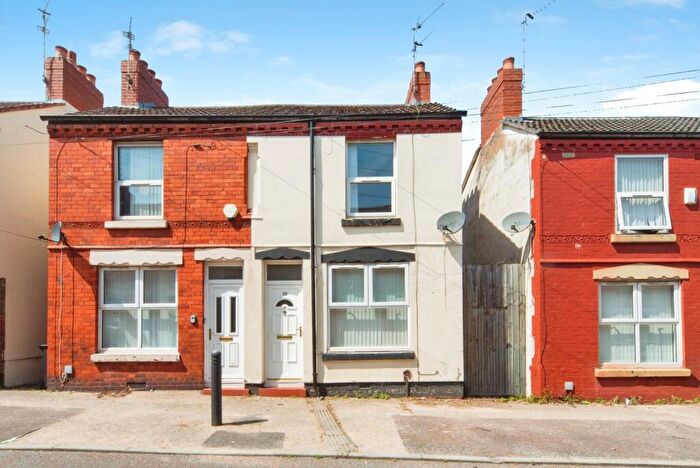
Properties for sale in Prenton
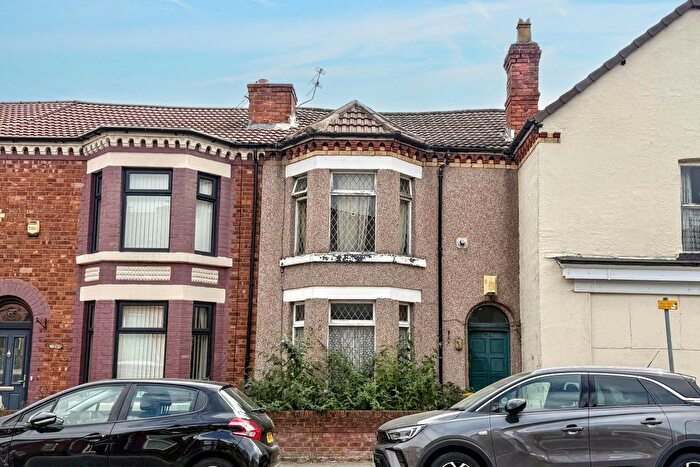
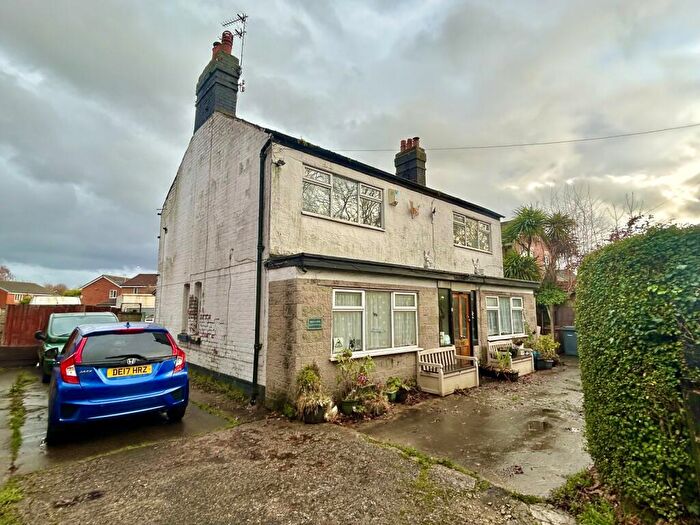
![]()
If you are looking to sell your house, let it out, or receive a property valuation, an expert can help you.
Click the button below to get started.
Neighbourhoods in Prenton
Navigate through our locations to find the location of your next house in Prenton, Wirral for sale or to rent.
Property price trends in Prenton
According to the latest Land Registry data, the average home in Prenton sold for £262,706 in 2026. That figure comes from a substantial record of 18,444 sales logged over the past 31 years.
Prices have continued to climb over the last three years. Compared with 2023, when the typical sale came in around £228,685, that's a rise of roughly 14.9%.
Looking back five years, average prices are up about 7.8% since 2021, a gain of around £19,056 in cash terms.
Zoom out to the past decade for the fuller picture. Back in 2016, homes here averaged £184,604, so the typical sold price has climbed about 42.3% since then, roughly 3.6% a year. Stretch the view to fifteen years and that annual pace holds at about 3.4%.
Frequently asked questions about Prenton
What is the average price for a property for sale in Prenton?
The average price for a property for sale in Prenton is £230,494. This amount is 3% lower than the average price in Wirral. There are 5,142 property listings for sale in Prenton.
What locations have the most expensive properties for sale in Prenton?
The locations with the most expensive properties for sale in Prenton are Claughton at an average of £251,505, Prenton at an average of £239,837 and Oxton at an average of £217,261.
What locations have the most affordable properties for sale in Prenton?
The locations with the most affordable properties for sale in Prenton are Birkenhead And Tranmere at an average of £174,006 and Bidston And St James at an average of £213,380.
Which train stations are available in or near Prenton?
Some of the train stations available in or near Prenton are Upton, Birkenhead Park and Birkenhead North.
Property Price Paid in Prenton by Year
The average sold property price by year was:
| Year | Average Sold Price | Price Change |
Sold Properties
|
|---|---|---|---|
| 2026 | £262,706 | 9% |
30 Properties |
| 2025 | £238,120 | 6% |
506 Properties |
| 2024 | £223,360 | -2% |
555 Properties |
| 2023 | £228,685 | 0,3% |
479 Properties |
| 2022 | £228,058 | -7% |
655 Properties |
| 2021 | £243,650 | 15% |
747 Properties |
| 2020 | £207,977 | 14% |
561 Properties |
| 2019 | £179,251 | -1% |
573 Properties |
| 2018 | £180,987 | 2% |
565 Properties |
| 2017 | £177,291 | -4% |
611 Properties |
Property Price per Property Type in Prenton
Here you can find historic sold price data in order to help with your property search.
The average Property Paid Price for specific property types in the last three years are:
| Property Type | Average Sold Price | Sold Properties |
|---|---|---|
| Semi Detached House | £243,236.00 | 599 Semi Detached Houses |
| Detached House | £415,172.00 | 275 Detached Houses |
| Terraced House | £174,827.00 | 275 Terraced Houses |
| Flat | £128,091.00 | 421 Flats |
Transport in Prenton
Please see below transportation links in this area:
