
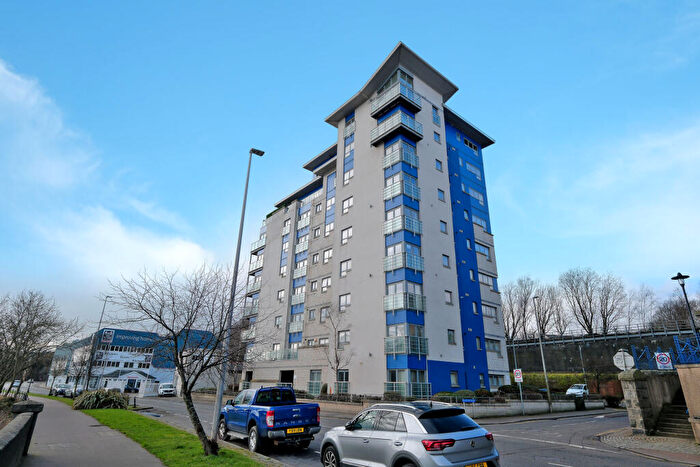
Houses for sale & to rent in George St/Harbour, Aberdeen
House Prices in George St/Harbour
Properties in George St/Harbour have an average house price of £84k and had 756 Property Transactions within the last 3 years¹.
George St/Harbour is an area in Aberdeen, Aberdeen City with 10,251 households², where the most expensive property was sold for £353k.
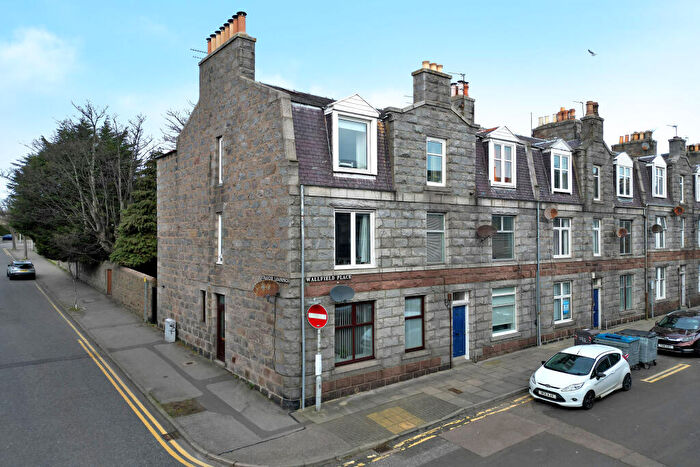
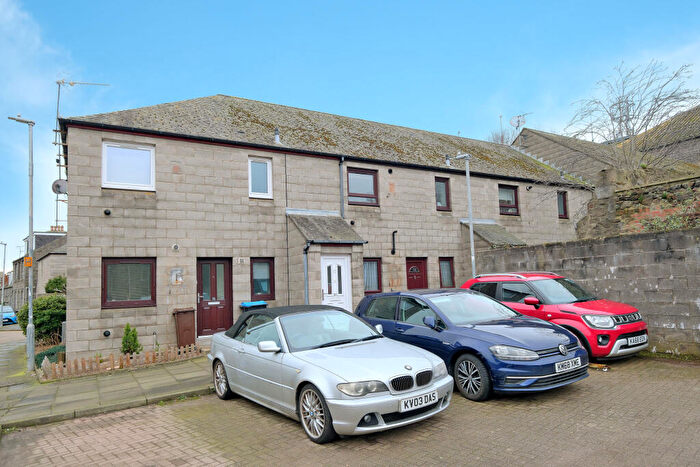
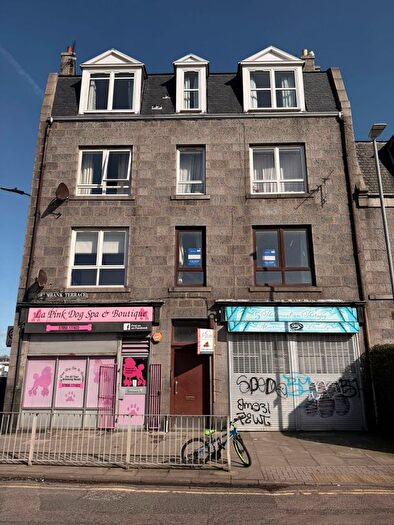
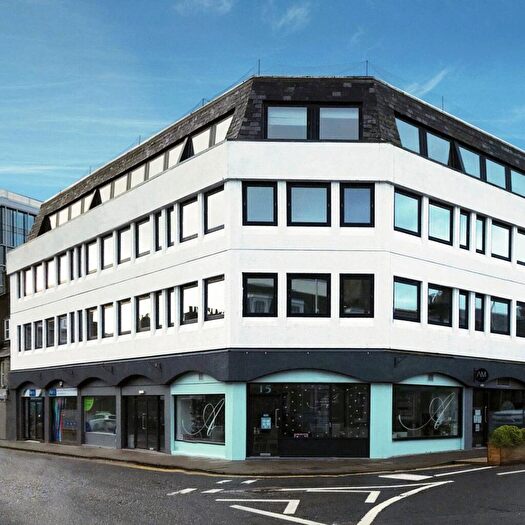
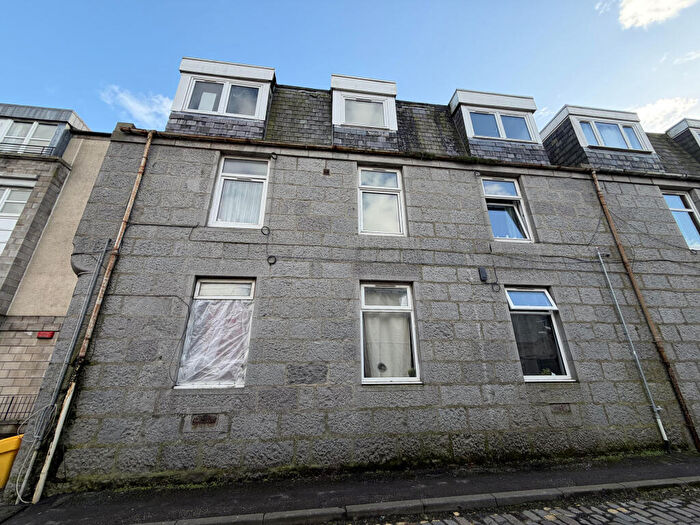
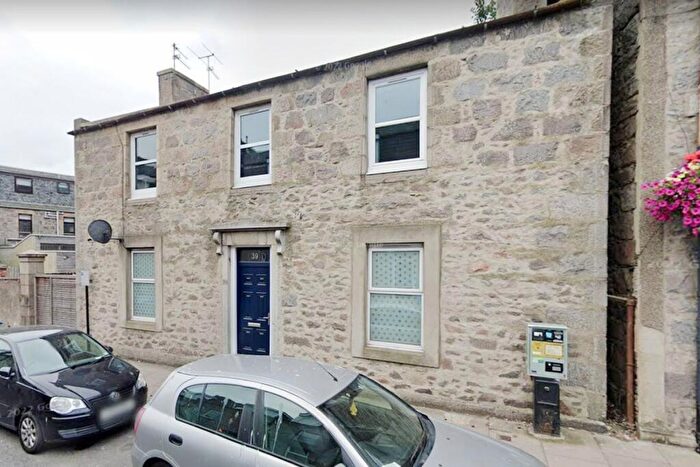
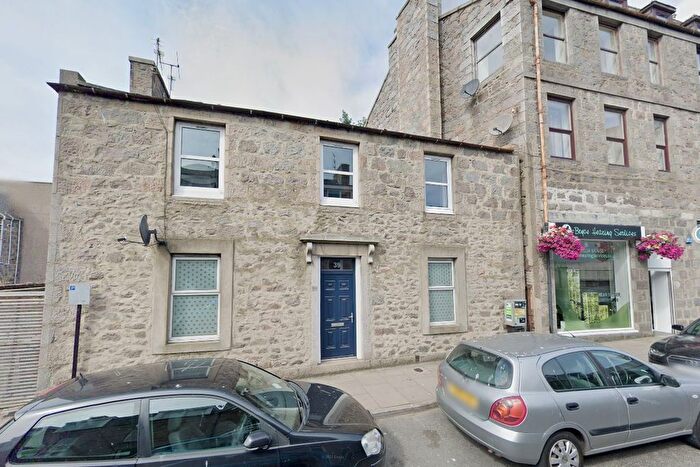
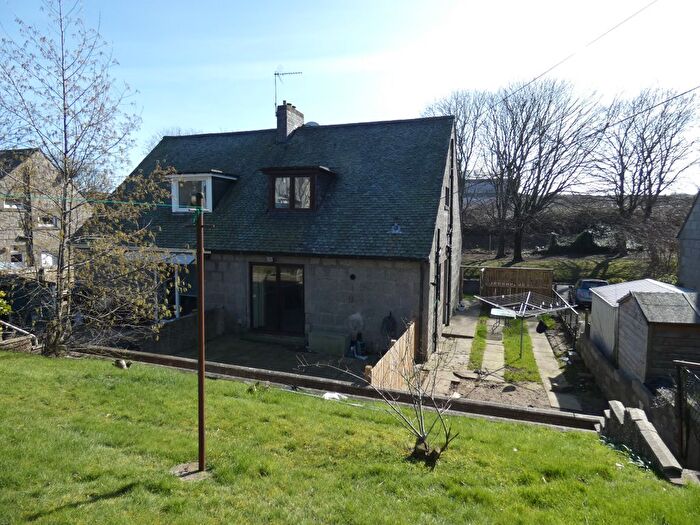
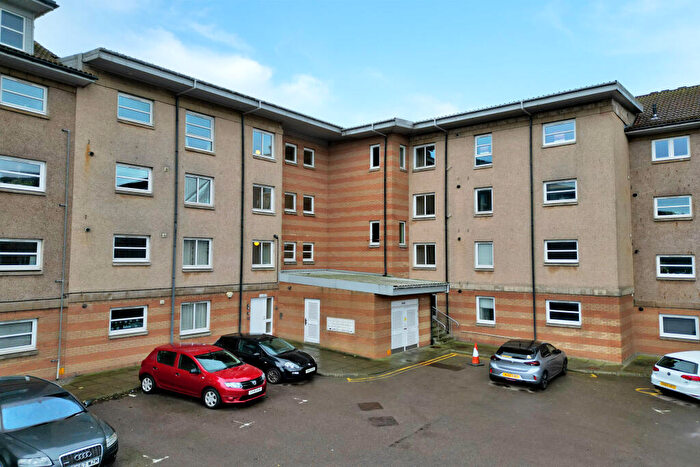
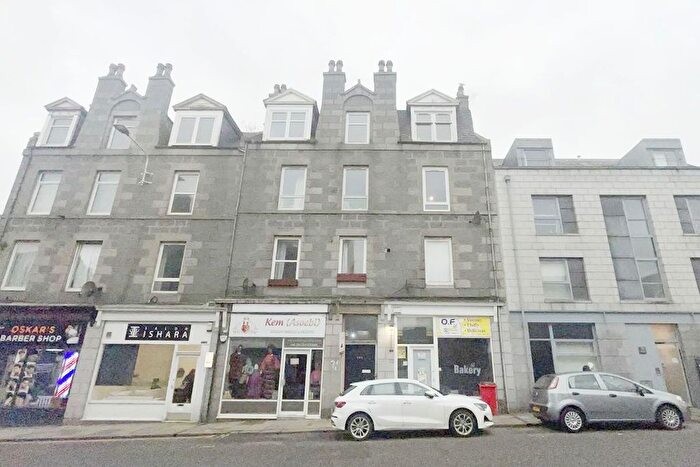
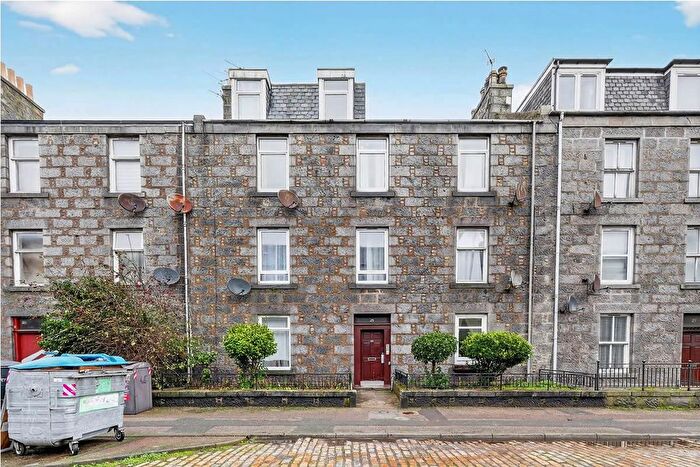
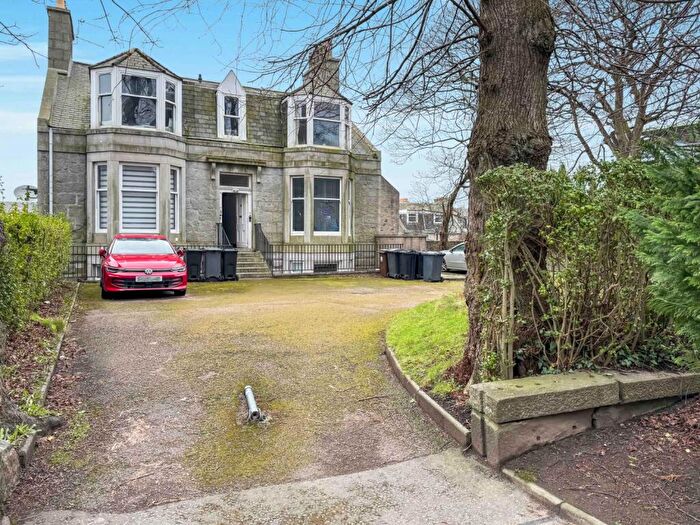
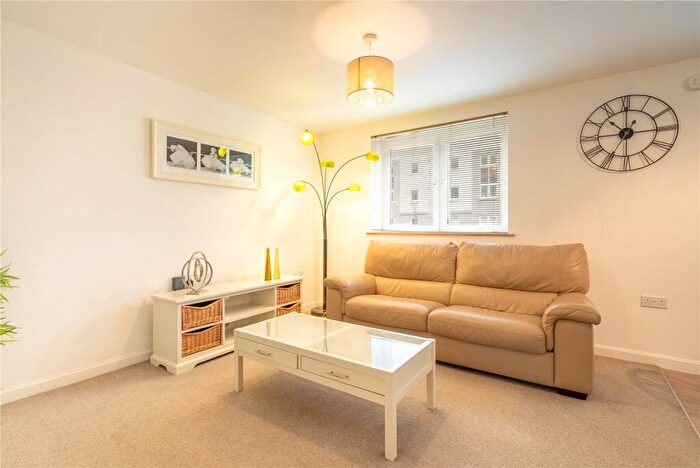
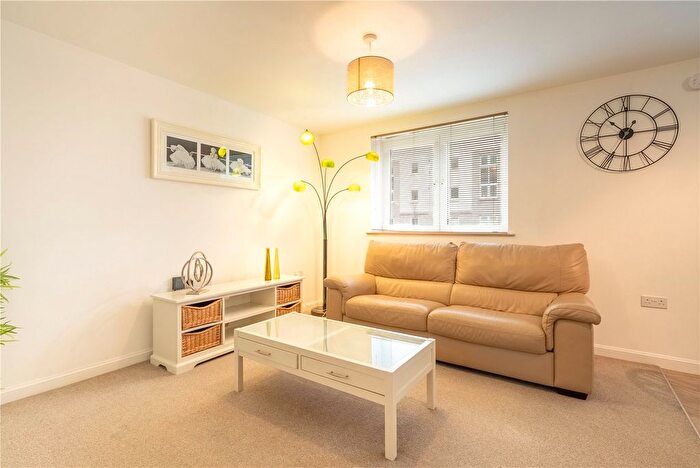
Properties for sale in George St/Harbour
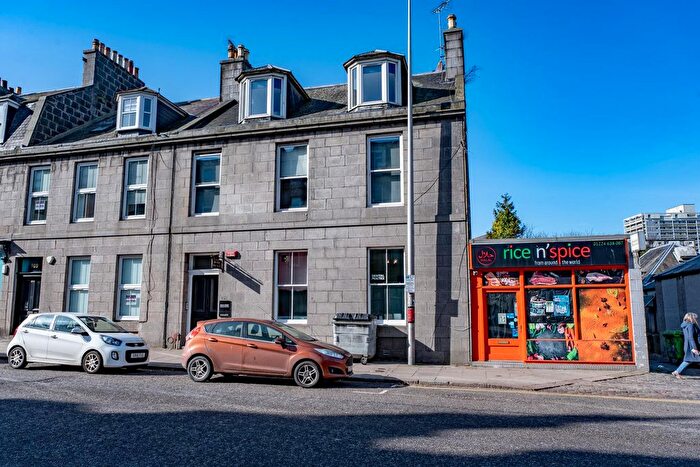
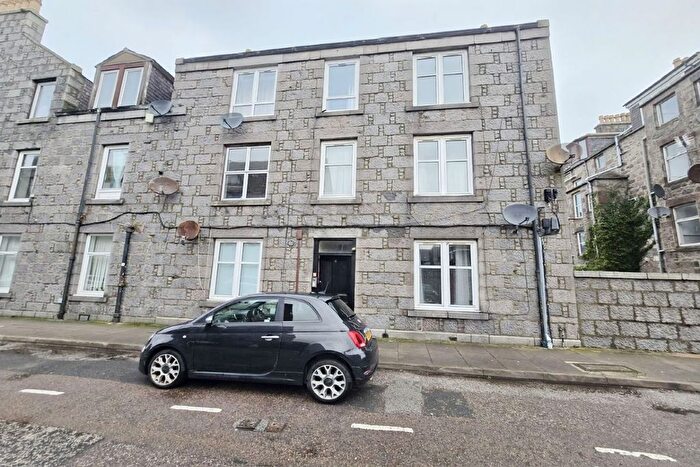
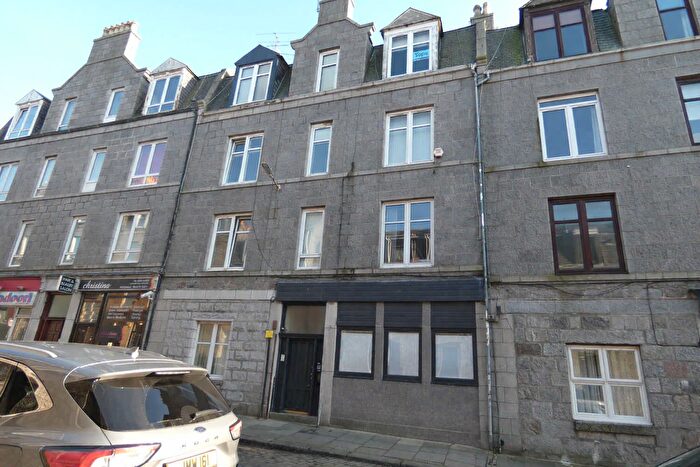
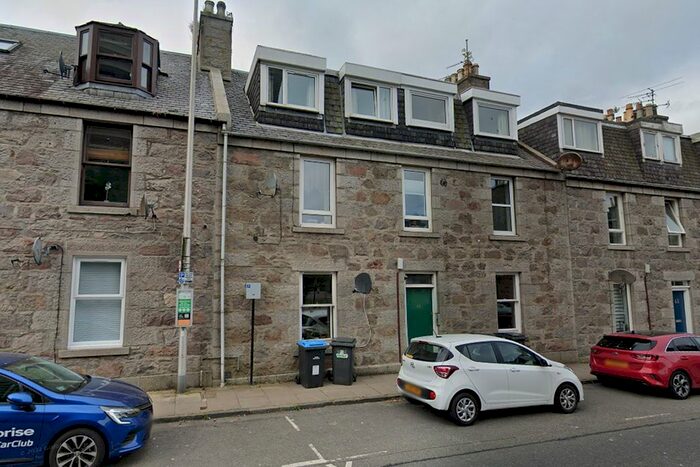
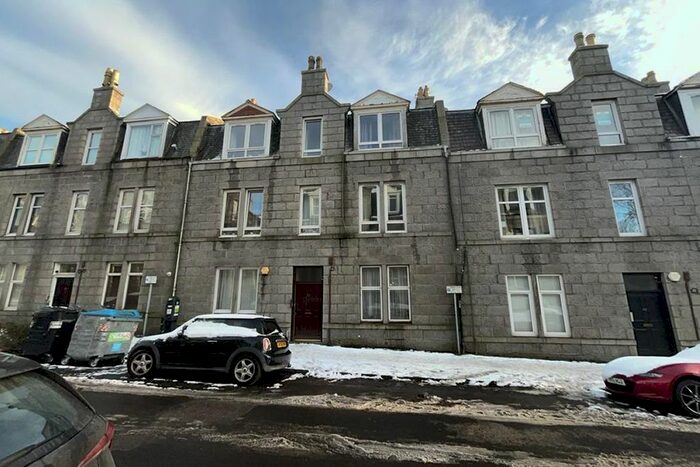
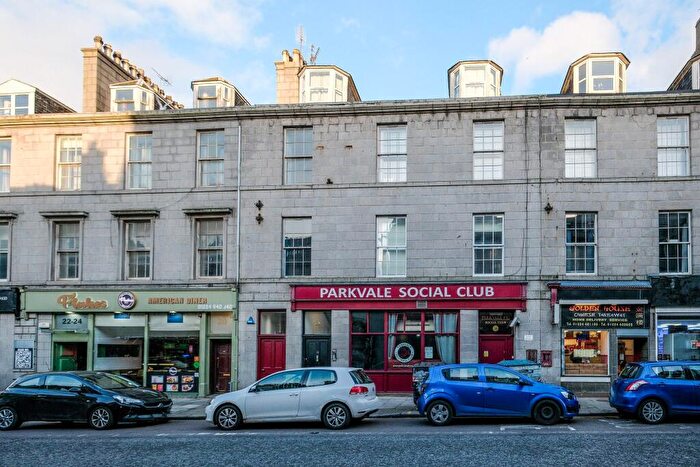
![]()
If you are looking to sell your house, let it out, or receive a property valuation, an expert can help you.
Click the button below to get started.


Roads and Postcodes in George St/Harbour
Navigate through our locations to find the location of your next house in George St/Harbour, Aberdeen for sale or to rent.
Transport near George St/Harbour

- FAQ
- Price Paid By Year
Frequently asked questions about George St/Harbour
What is the average price for a property for sale in George St/Harbour?
The average price for a property for sale in George St/Harbour is £84,311. This amount is 44% lower than the average price in Aberdeen. There are 1,722 property listings for sale in George St/Harbour.
What streets have the most expensive properties for sale in George St/Harbour?
The streets with the most expensive properties for sale in George St/Harbour are Middle Row at an average of £300,000, North Square at an average of £300,000 and Pilot Square at an average of £245,000.
What streets have the most affordable properties for sale in George St/Harbour?
The streets with the most affordable properties for sale in George St/Harbour are Hutcheon Court at an average of £28,500, Marischal Court at an average of £37,500 and Merkland Road at an average of £37,833.
Which train stations are available in or near George St/Harbour?
Some of the train stations available in or near George St/Harbour are Aberdeen, Dyce and Portlethen.
Property Price Paid in George St/Harbour by Year
The average sold property price by year was:
| Year | Average Sold Price | Price Change |
Sold Properties
|
|---|---|---|---|
| 2025 | £79,919 | -10% |
274 Properties |
| 2024 | £88,008 | 3% |
220 Properties |
| 2023 | £85,798 | -11% |
262 Properties |
| 2022 | £94,954 | -2% |
502 Properties |
| 2021 | £96,703 | -6% |
399 Properties |
| 2020 | £102,282 | -18% |
301 Properties |
| 2019 | £120,692 | -11% |
367 Properties |
| 2018 | £133,534 | 1% |
358 Properties |
| 2017 | £132,305 | -9% |
376 Properties |
| 2016 | £144,519 | -5% |
428 Properties |
| 2015 | £151,268 | -4% |
608 Properties |
| 2014 | £156,801 | 18% |
735 Properties |
| 2013 | £129,022 | -11% |
607 Properties |
| 2012 | £142,904 | 8% |
548 Properties |
| 2011 | £132,018 | -68% |
499 Properties |
| 2010 | £222,436 | 44% |
601 Properties |
| 2009 | £123,472 | -14% |
499 Properties |
| 2008 | £141,157 | 1% |
717 Properties |
| 2007 | £139,194 | 9% |
981 Properties |
| 2006 | £127,013 | 28% |
1,171 Properties |
| 2005 | £91,748 | -7% |
1,030 Properties |
| 2004 | £97,784 | 31% |
981 Properties |
| 2003 | £67,840 | -24% |
868 Properties |
| 2002 | £84,327 | -358% |
889 Properties |
| 2001 | £386,105 | - |
56 Properties |