
Houses for sale & to rent in Midstocket/Rosemount, Aberdeen
House Prices in Midstocket/Rosemount
Properties in Midstocket/Rosemount have an average house price of £139k and had 675 Property Transactions within the last 3 years¹.
Midstocket/Rosemount is an area in Aberdeen, Aberdeen City with 8,276 households², where the most expensive property was sold for £565k.
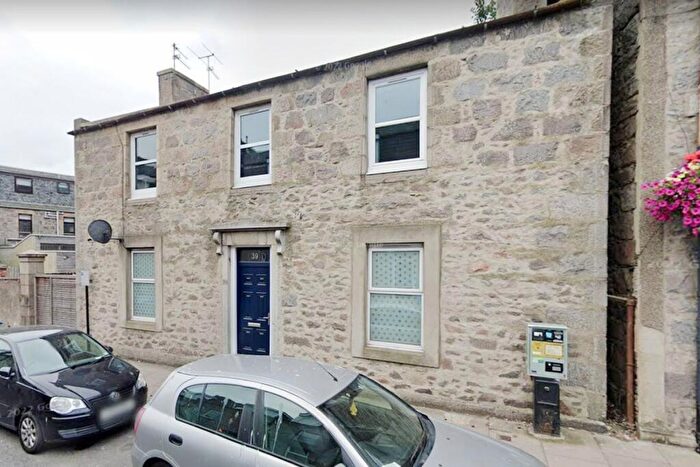
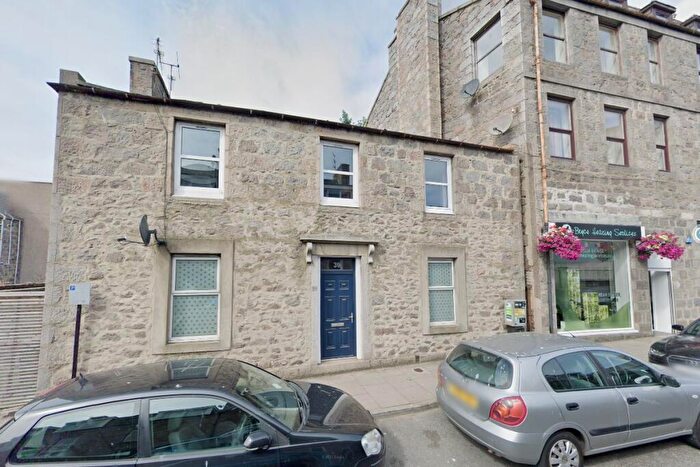
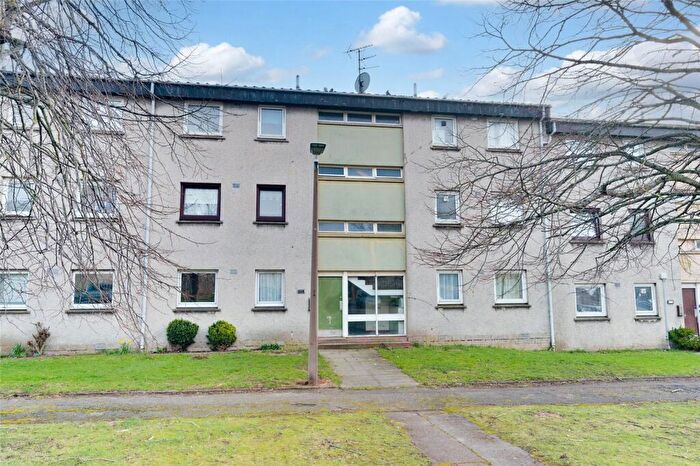
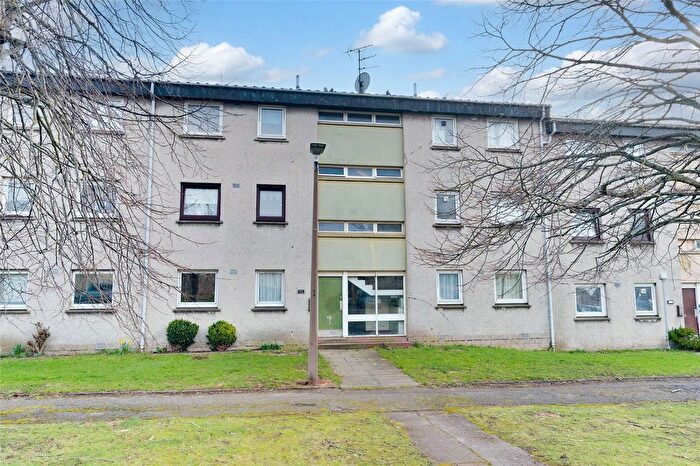
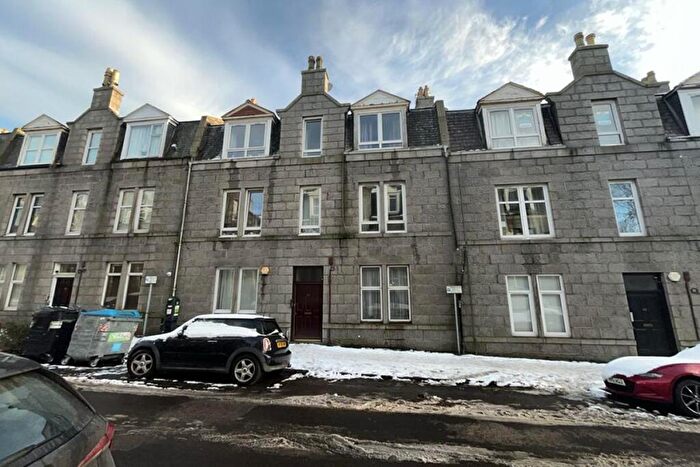
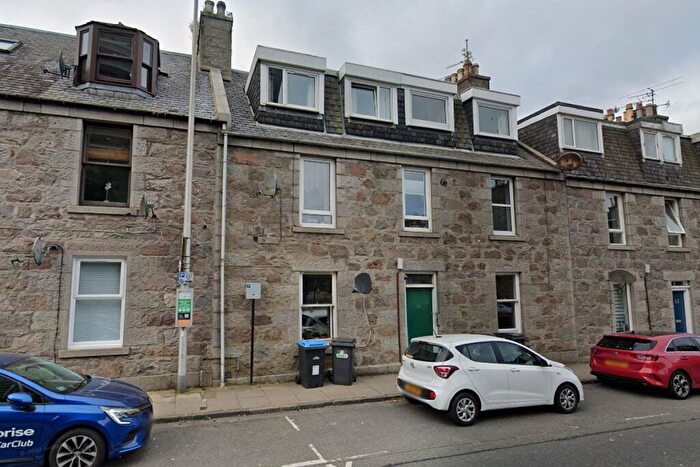
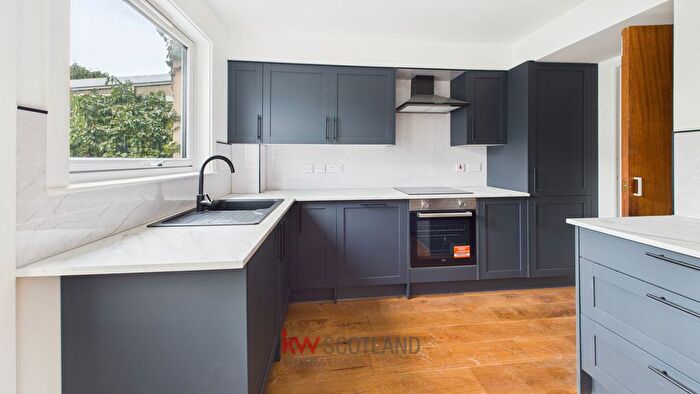
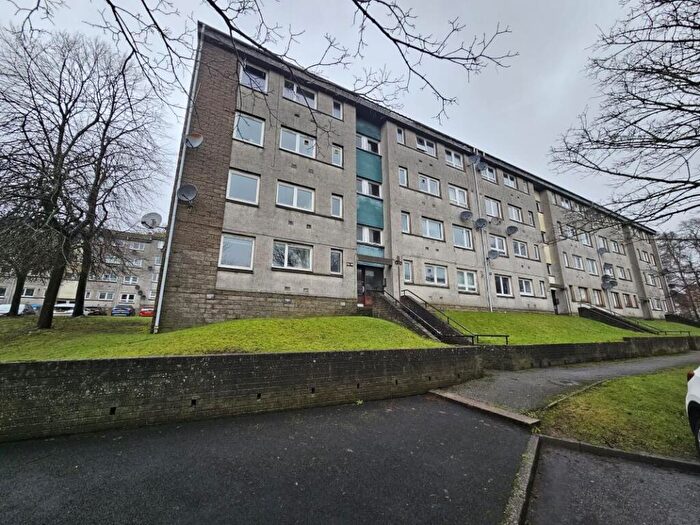
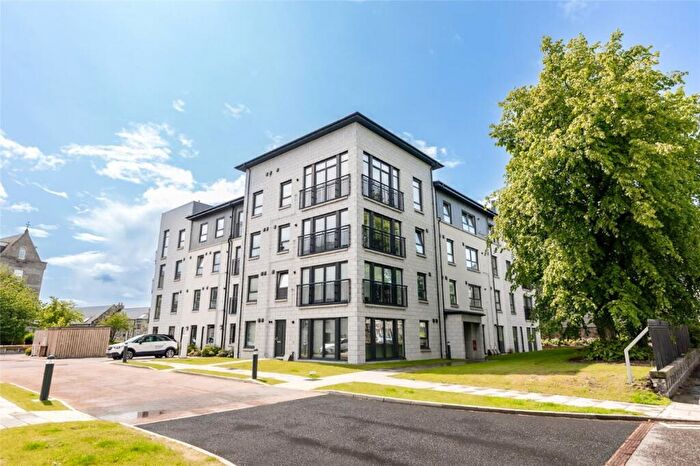
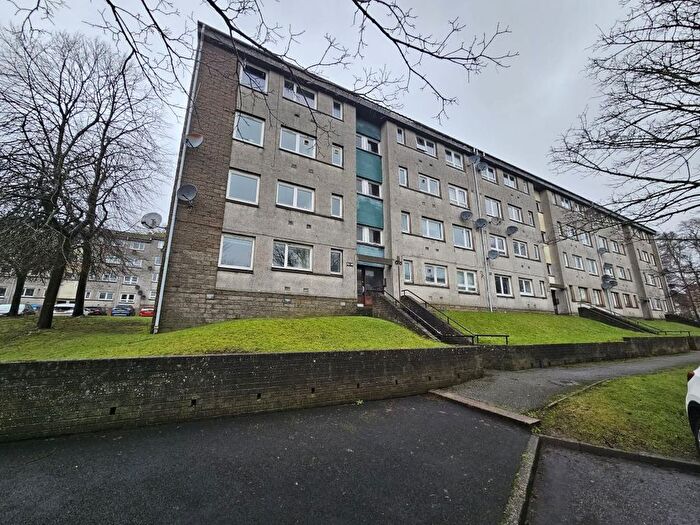
Properties for sale in Midstocket/Rosemount


![]()
If you are looking to sell your house, let it out, or receive a property valuation, an expert can help you.
Click the button below to get started.


Roads and Postcodes in Midstocket/Rosemount
Navigate through our locations to find the location of your next house in Midstocket/Rosemount, Aberdeen for sale or to rent.
Transport near Midstocket/Rosemount

- FAQ
- Price Paid By Year
Frequently asked questions about Midstocket/Rosemount
What is the average price for a property for sale in Midstocket/Rosemount?
The average price for a property for sale in Midstocket/Rosemount is £139,432. This amount is 8% lower than the average price in Aberdeen. There are 596 property listings for sale in Midstocket/Rosemount.
What streets have the most expensive properties for sale in Midstocket/Rosemount?
The streets with the most expensive properties for sale in Midstocket/Rosemount are Westburn Drive at an average of £530,000, Belvidere Street at an average of £511,671 and Kingshill Road at an average of £484,870.
What streets have the most affordable properties for sale in Midstocket/Rosemount?
The streets with the most affordable properties for sale in Midstocket/Rosemount are Cadenhead Place at an average of £42,000, Hill Street at an average of £46,666 and Leadside Road at an average of £51,264.
Which train stations are available in or near Midstocket/Rosemount?
Some of the train stations available in or near Midstocket/Rosemount are Aberdeen, Dyce and Portlethen.
Property Price Paid in Midstocket/Rosemount by Year
The average sold property price by year was:
| Year | Average Sold Price | Price Change |
Sold Properties
|
|---|---|---|---|
| 2025 | £128,580 | -8% |
216 Properties |
| 2024 | £139,108 | -7% |
209 Properties |
| 2023 | £149,079 | -0,3% |
250 Properties |
| 2022 | £149,579 | -10% |
446 Properties |
| 2021 | £164,639 | -2% |
445 Properties |
| 2020 | £167,352 | -8% |
265 Properties |
| 2019 | £180,455 | -2% |
366 Properties |
| 2018 | £183,933 | 1% |
367 Properties |
| 2017 | £182,272 | -11% |
379 Properties |
| 2016 | £202,275 | 2% |
354 Properties |
| 2015 | £199,193 | -16% |
409 Properties |
| 2014 | £230,284 | 7% |
551 Properties |
| 2013 | £213,785 | 8% |
598 Properties |
| 2012 | £197,128 | 15% |
474 Properties |
| 2011 | £168,122 | -12% |
397 Properties |
| 2010 | £187,476 | 17% |
447 Properties |
| 2009 | £156,489 | -12% |
469 Properties |
| 2008 | £174,599 | 5% |
564 Properties |
| 2007 | £165,132 | 13% |
707 Properties |
| 2006 | £144,181 | 26% |
805 Properties |
| 2005 | £105,995 | 16% |
833 Properties |
| 2004 | £89,197 | -7% |
763 Properties |
| 2003 | £95,831 | 0,1% |
742 Properties |
| 2002 | £95,699 | -71% |
730 Properties |
| 2001 | £163,884 | - |
39 Properties |