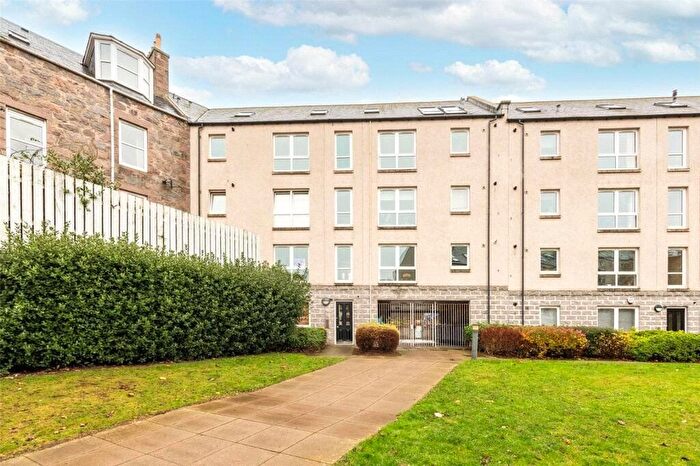
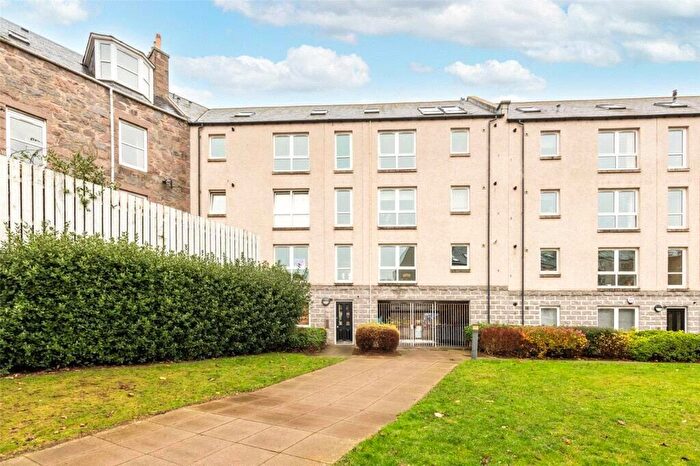
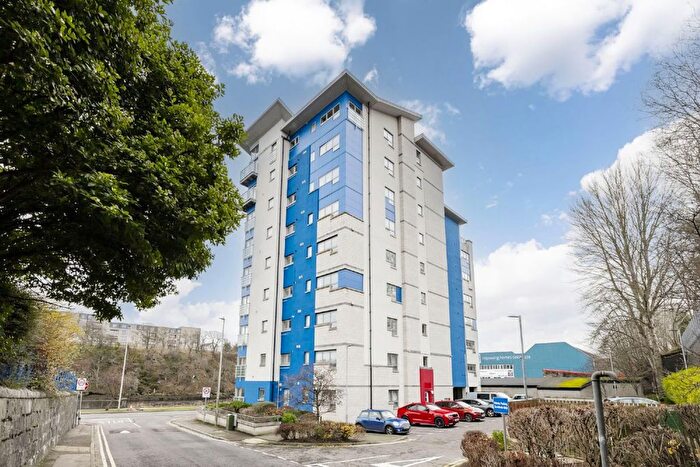
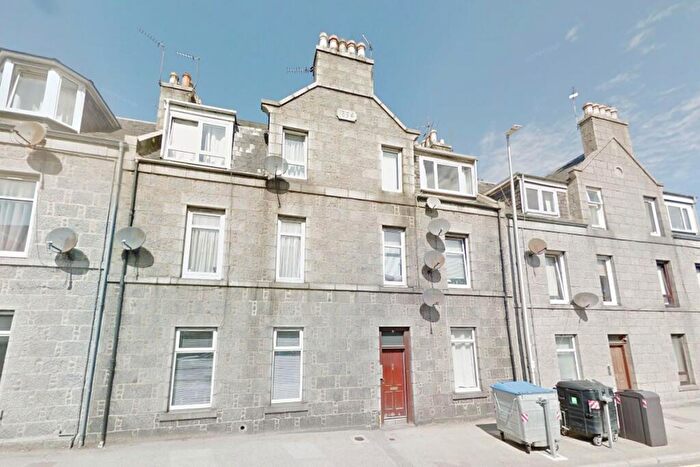
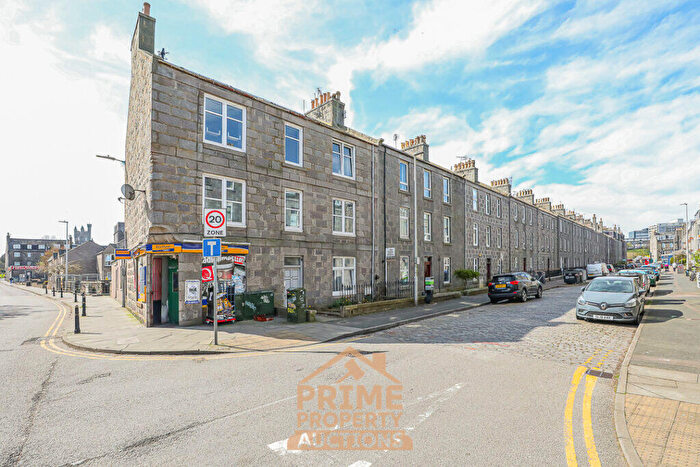
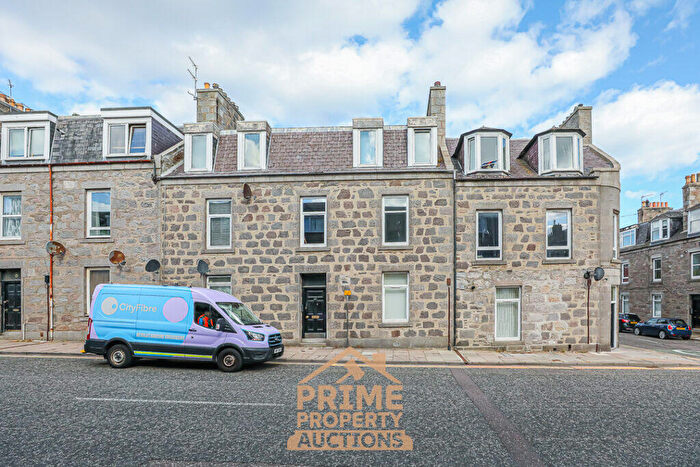
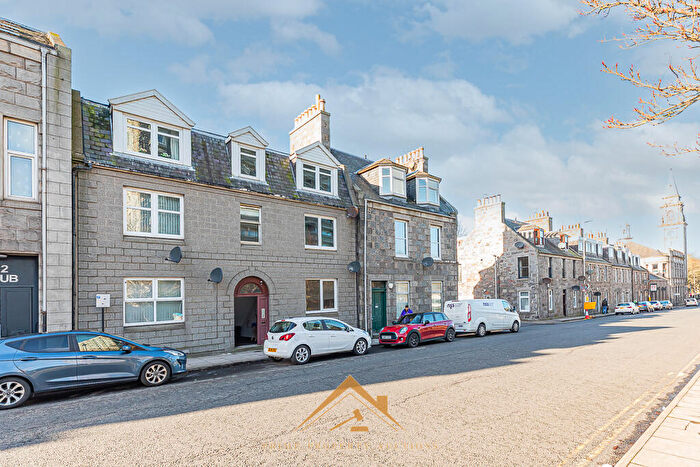
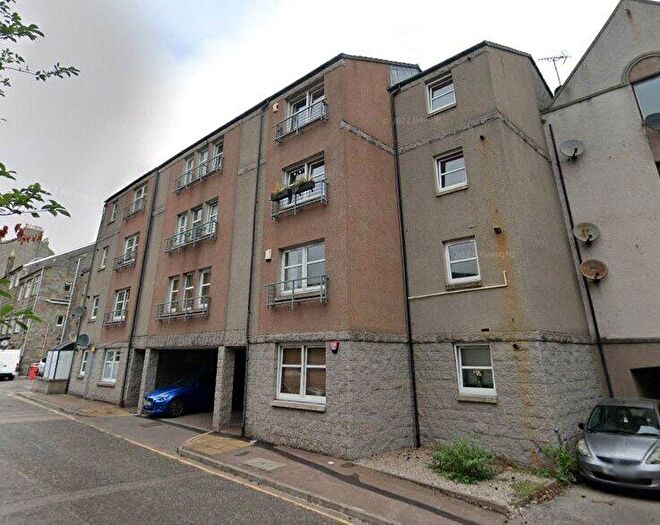
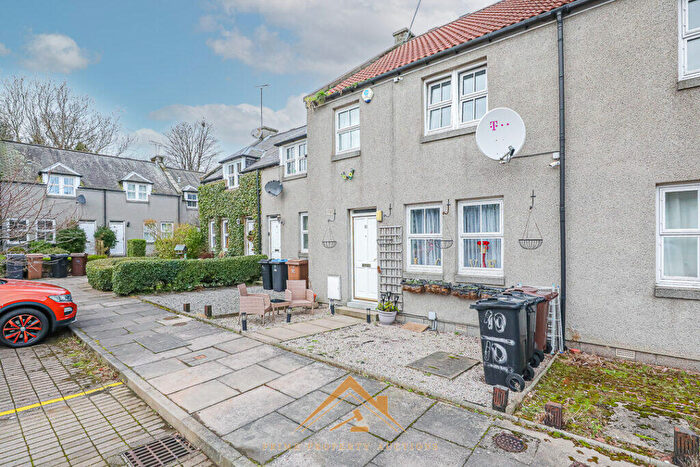
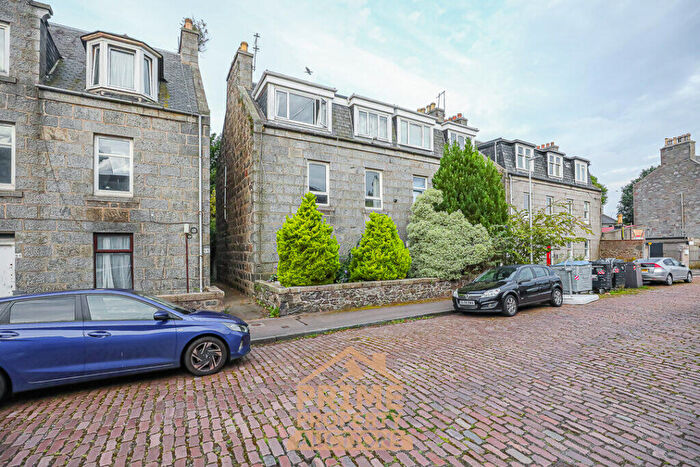
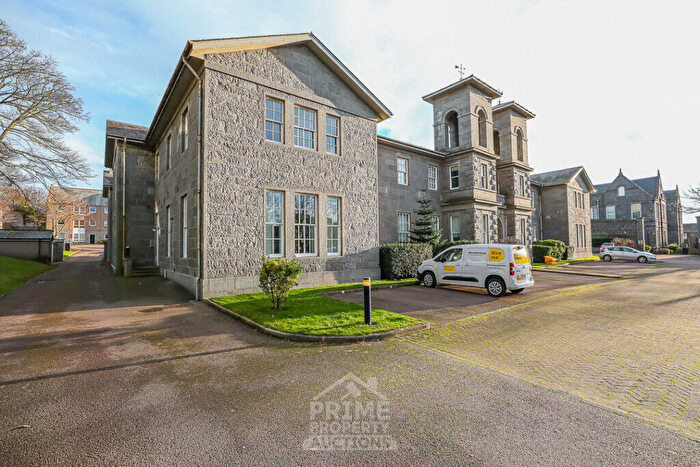
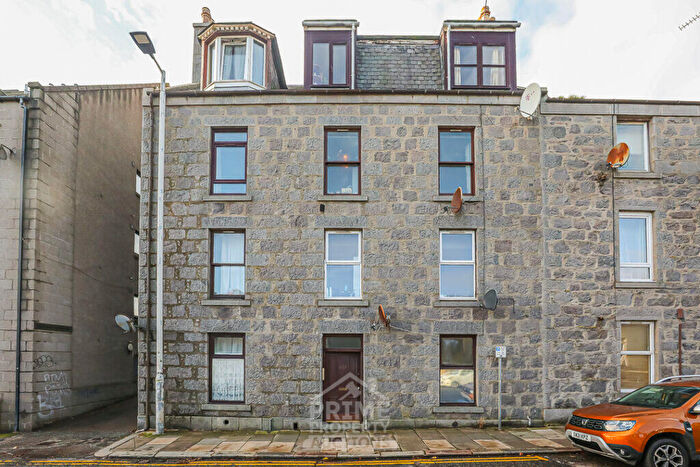
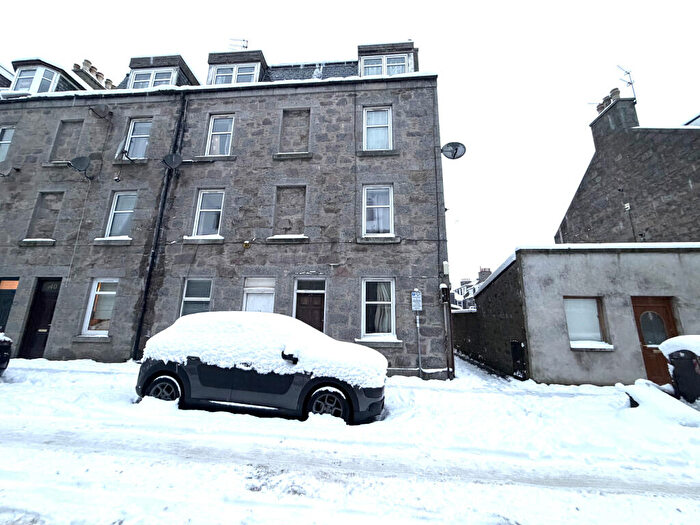
Houses for sale & to rent in Torry/Ferryhill, Aberdeen
House Prices in Torry/Ferryhill
Properties in Torry/Ferryhill have an average house price of £127,940.00 and had 566 Property Transactions within the last 3 years¹.
Torry/Ferryhill is an area in Aberdeen, Aberdeen City with 11,410 households², where the most expensive property was sold for £727,500.00.
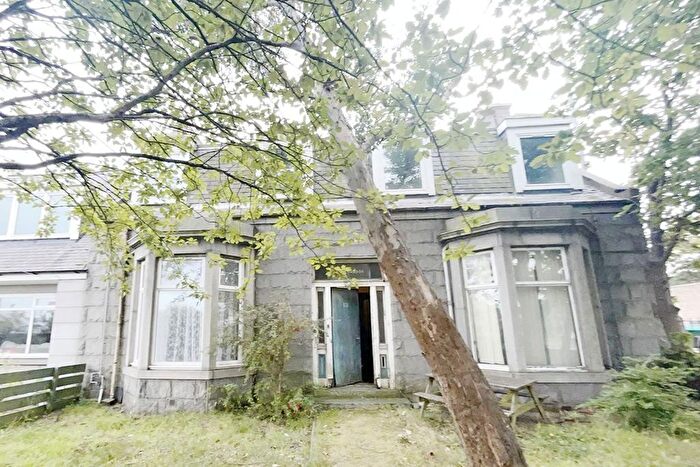
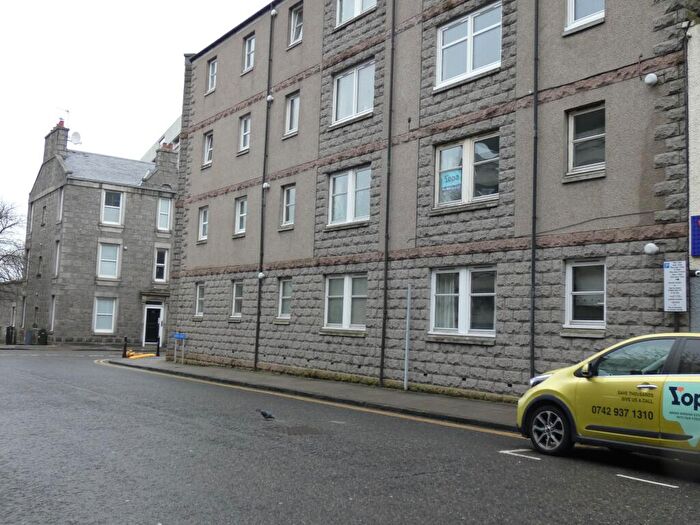
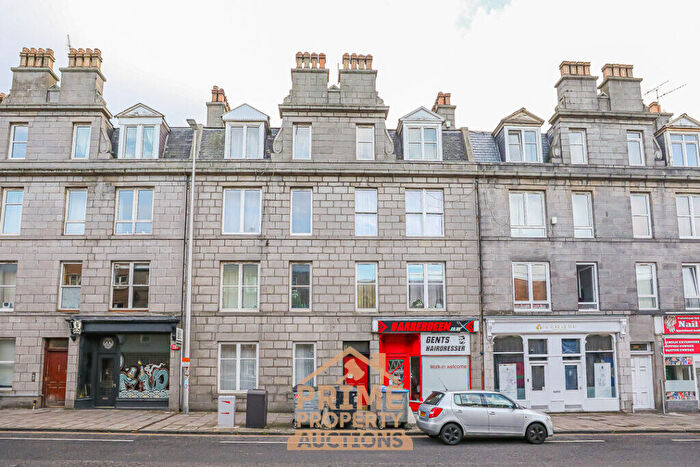
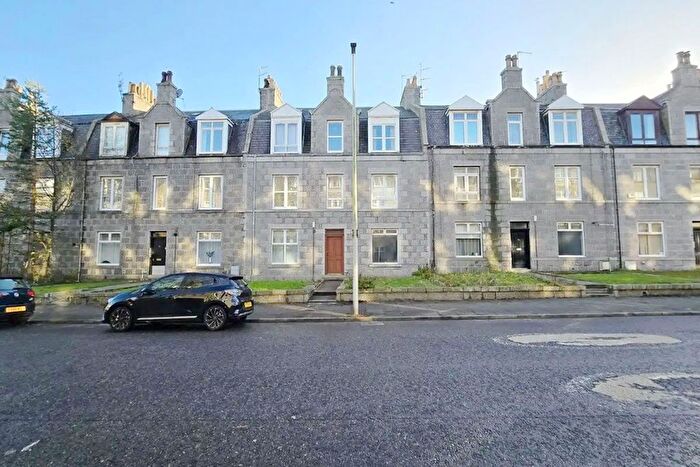
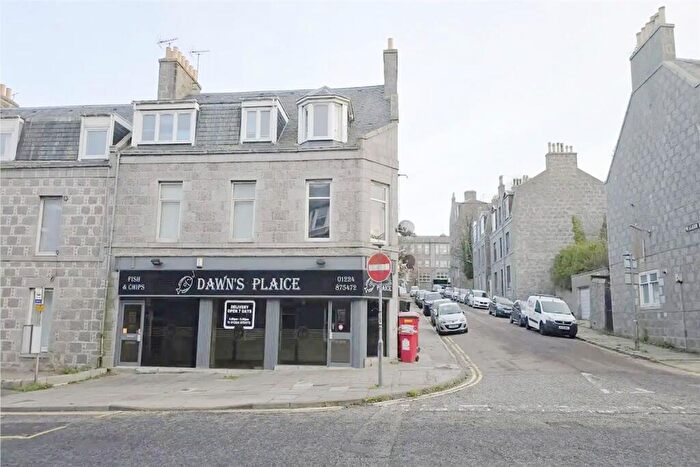
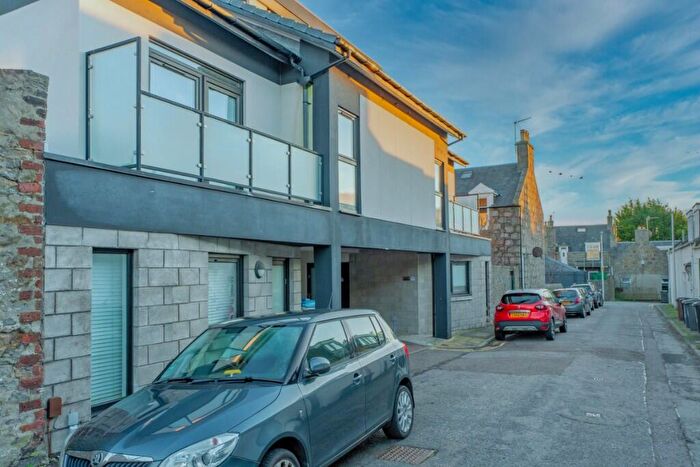
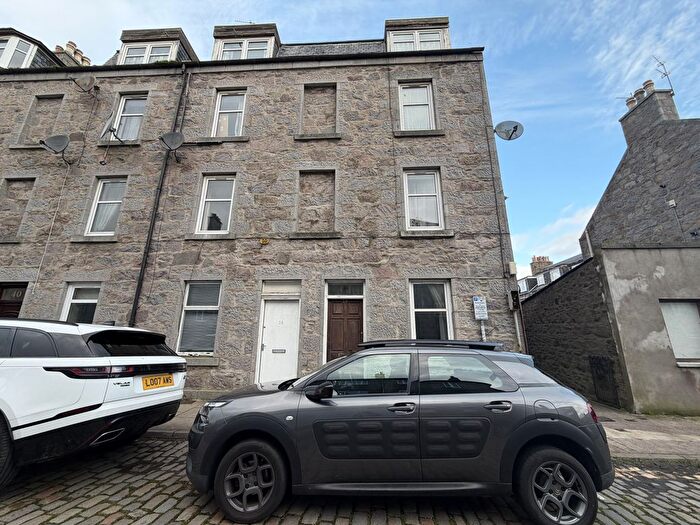
Properties for sale in Torry/Ferryhill
Roads and Postcodes in Torry/Ferryhill
Navigate through our locations to find the location of your next house in Torry/Ferryhill, Aberdeen for sale or to rent.
Transport near Torry/Ferryhill
- FAQ
- Price Paid By Year
Frequently asked questions about Torry/Ferryhill
What is the average price for a property for sale in Torry/Ferryhill?
The average price for a property for sale in Torry/Ferryhill is £127,940. This amount is 27% lower than the average price in Aberdeen. There are 1,584 property listings for sale in Torry/Ferryhill.
Which train stations are available in or near Torry/Ferryhill?
Some of the train stations available in or near Torry/Ferryhill are Aberdeen, Portlethen and Dyce.
Property Price Paid in Torry/Ferryhill by Year
The average sold property price by year was:
| Year | Average Sold Price | Price Change |
Sold Properties
|
|---|---|---|---|
| 2023 | £124,409 | -3% |
88 Properties |
| 2022 | £128,590 | -6% |
478 Properties |
| 2021 | £136,851 | 2% |
441 Properties |
| 2020 | £133,819 | -3% |
274 Properties |
| 2019 | £137,475 | -5% |
364 Properties |
| 2018 | £144,323 | -7% |
336 Properties |
| 2017 | £154,312 | -4% |
409 Properties |
| 2016 | £160,142 | -11% |
384 Properties |
| 2015 | £177,278 | 1% |
516 Properties |
| 2014 | £175,238 | 4% |
565 Properties |
| 2013 | £168,150 | 5% |
634 Properties |
| 2012 | £159,890 | -5% |
492 Properties |
| 2011 | £168,144 | 7% |
481 Properties |
| 2010 | £156,945 | 4% |
500 Properties |
| 2009 | £149,921 | -19% |
571 Properties |
| 2008 | £178,814 | -0,4% |
677 Properties |
| 2007 | £179,480 | 27% |
811 Properties |
| 2006 | £130,925 | 25% |
978 Properties |
| 2005 | £98,842 | 5% |
957 Properties |
| 2004 | £93,889 | -14% |
968 Properties |
| 2003 | £107,127 | 7% |
801 Properties |
| 2002 | £100,095 | -32% |
825 Properties |
| 2001 | £132,161 | - |
49 Properties |

