
Houses for sale & to rent in AB15 9RU, Kirkbrae View, Lower Deeside, Aberdeen
House Prices in AB15 9RU, Kirkbrae View, Lower Deeside
Properties in AB15 9RU have an average house price of £410k and had 1 Property Transaction within the last 3 years.¹ AB15 9RU is a postcode in Kirkbrae View located in Lower Deeside, an area in Aberdeen, Aberdeen City, with 8 households², where the most expensive property was sold for £410k.
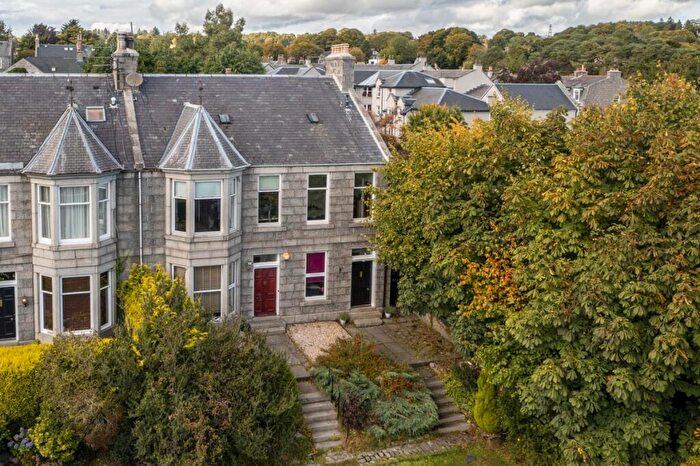
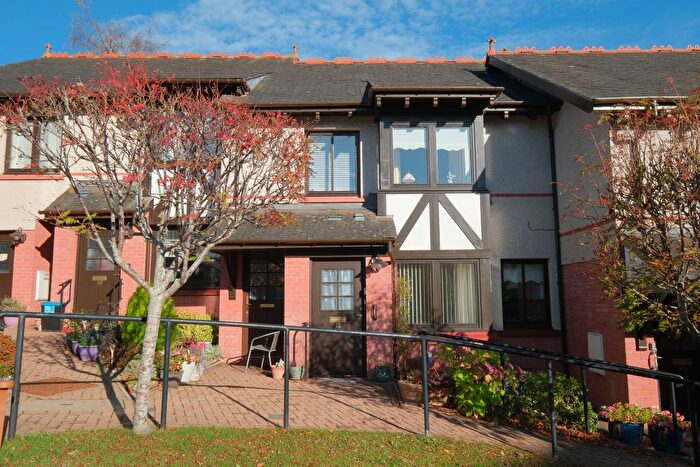
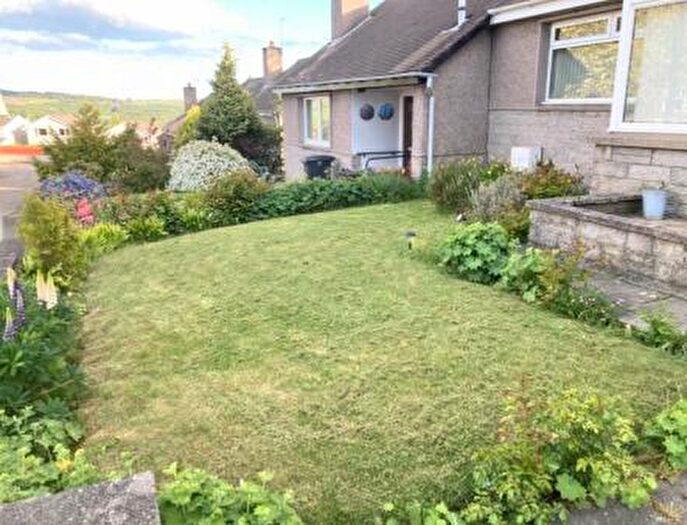
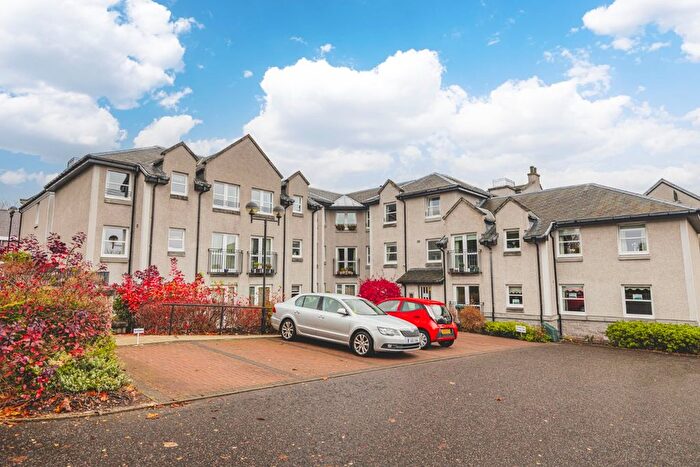
Properties for sale near AB15 9RU, Kirkbrae View
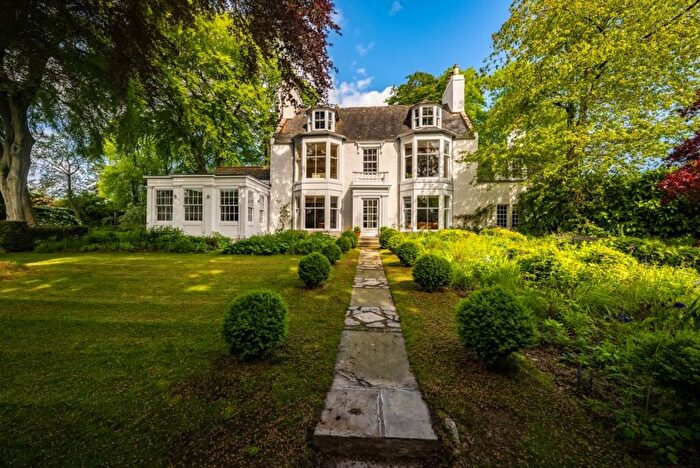
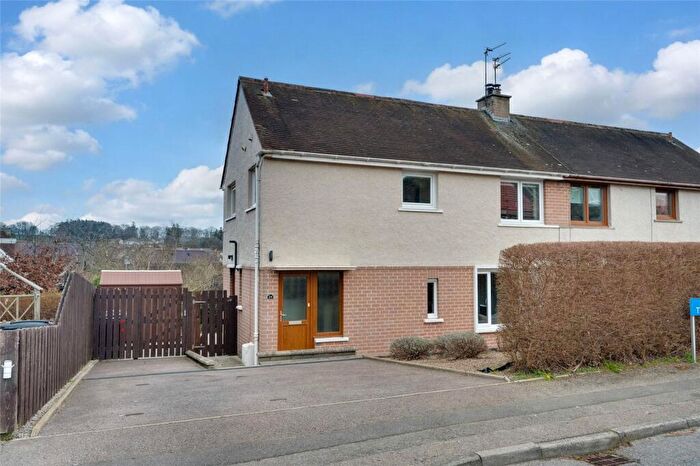


![]()
If you are looking to sell your house, let it out, or receive a property valuation, an expert can help you.
Click the button below to get started.
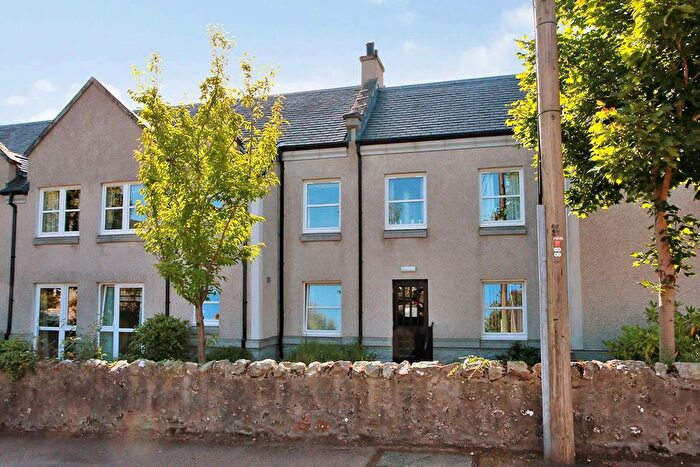
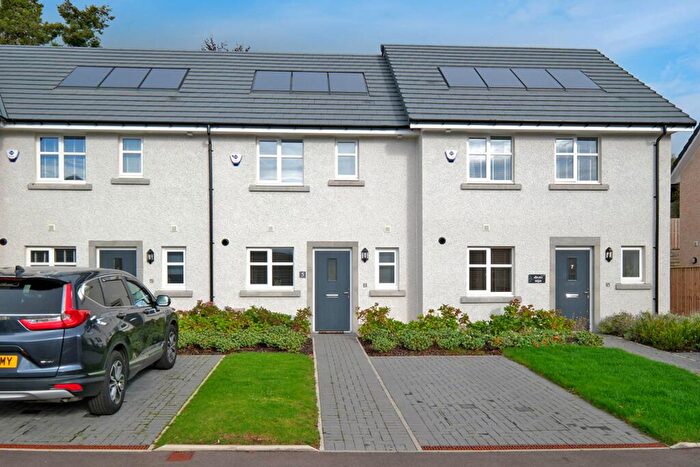
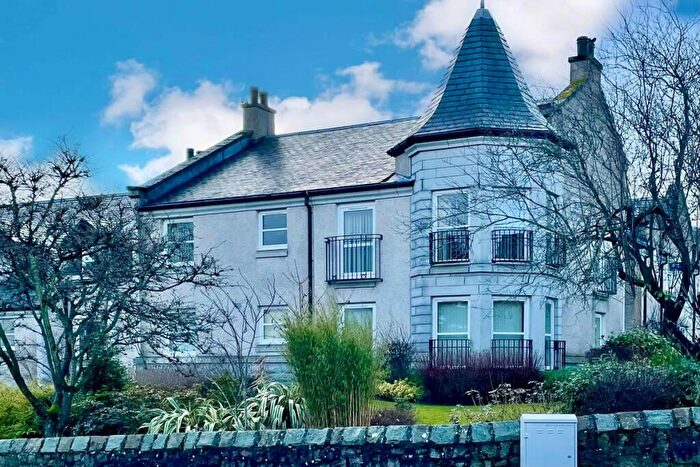
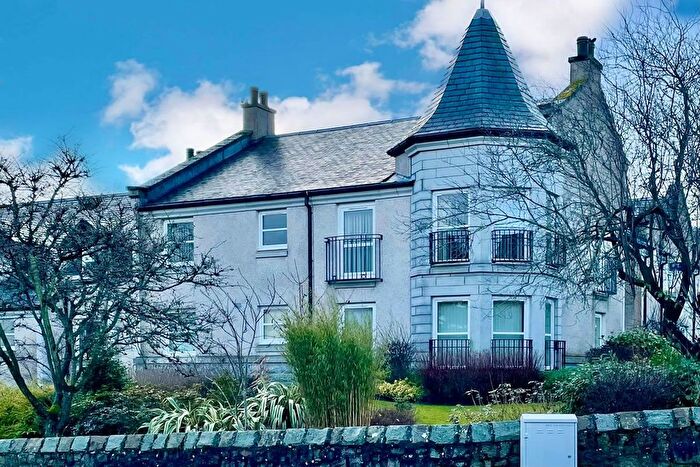
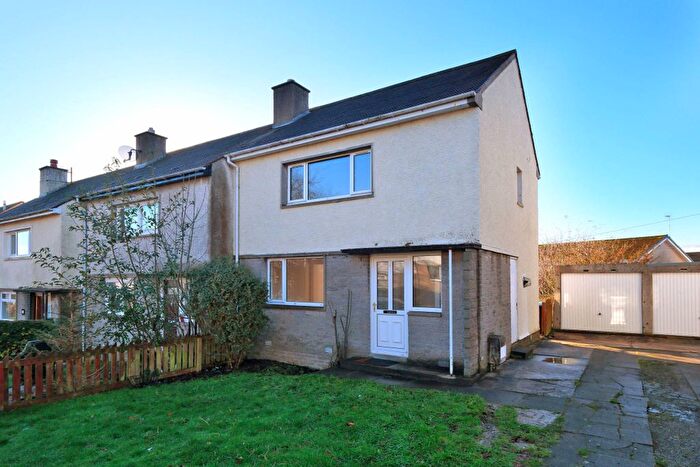
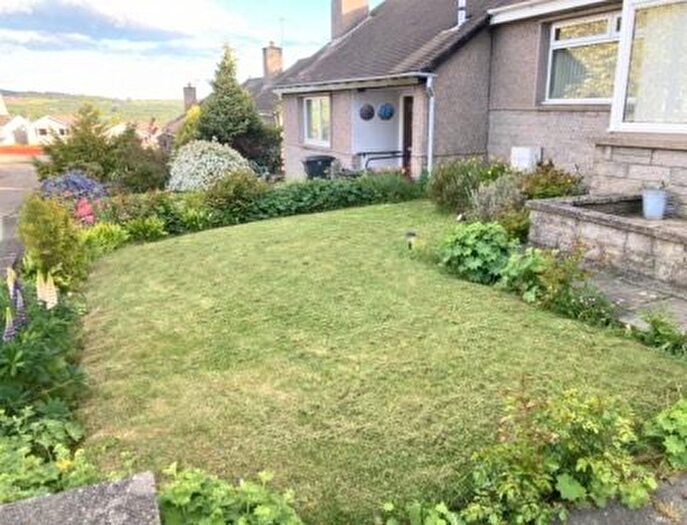
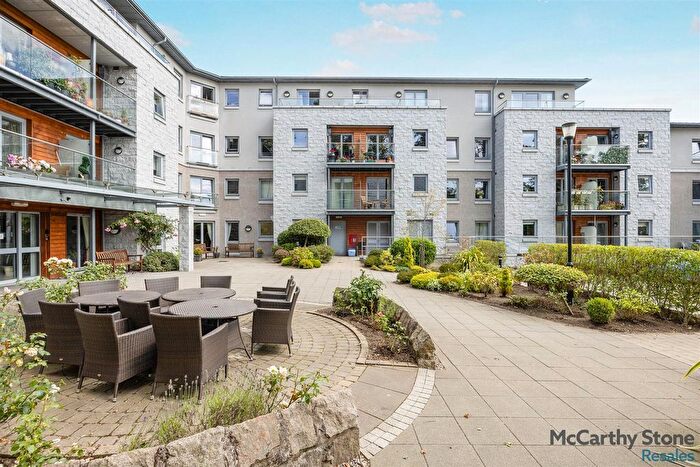
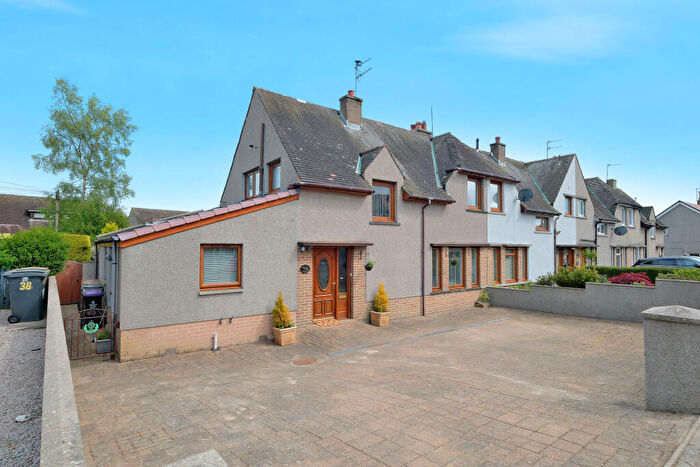
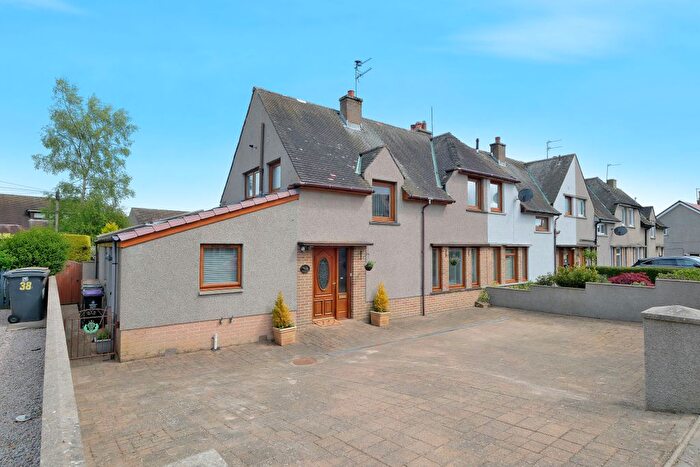
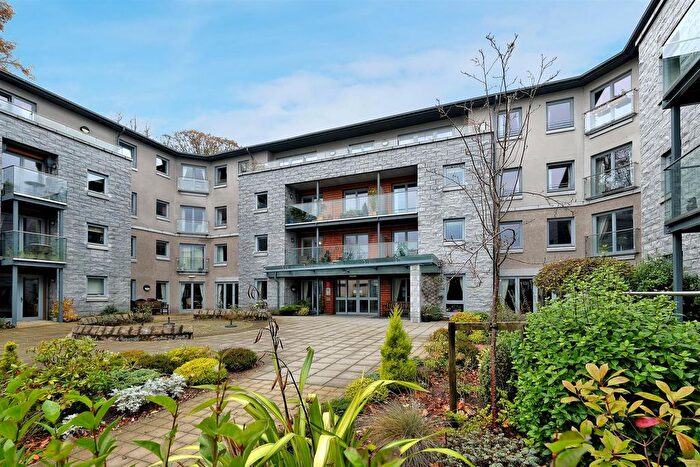
Previously listed properties near AB15 9RU, Kirkbrae View
![]()
If you are looking to sell your house, let it out, or receive a property valuation, an expert can help you.
Click the button below to get started.


Price Paid in Kirkbrae View, AB15 9RU, Lower Deeside
1 Kirkbrae View, AB15 9RU, Lower Deeside Aberdeen
Property 1 has been sold 4 times. The last time it was sold was in 11/12/2023 and the sold price was £410,000.00.
This is a Property which was sold as a New Build in 11/12/2023
| Date | Price | Classification |
|---|---|---|
| 11/12/2023 | £410,000.00 | New Build |
| 05/02/2018 | £400,000.00 | Established Building |
| 24/12/2010 | £368,333.00 | Established Building |
| 23/08/2002 | £187,000.00 | Established Building |
2 Kirkbrae View, AB15 9RU, Lower Deeside Aberdeen
Property 2 has been sold 1 time. The last time it was sold was in 18/07/2016 and the sold price was £470,000.00.
This is a Property which was sold as an Established Building in 18/07/2016
| Date | Price | Classification |
|---|---|---|
| 18/07/2016 | £470,000.00 | Established Building |
8 Kirkbrae View, AB15 9RU, Lower Deeside Aberdeen
Property 8 has been sold 1 time. The last time it was sold was in 11/09/2002 and the sold price was £197,000.00.
This is a Property which was sold as an Established Building in 11/09/2002
| Date | Price | Classification |
|---|---|---|
| 11/09/2002 | £197,000.00 | Established Building |
Transport near AB15 9RU, Kirkbrae View

House price paid reports for AB15 9RU, Kirkbrae View
Click on the buttons below to see price paid reports by year or property price:
- Price Paid By Year
Property Price Paid in AB15 9RU, Kirkbrae View by Year
The average sold property price by year was:
| Year | Average Sold Price | Price Change |
Sold Properties
|
|---|---|---|---|
| 2023 | £410,000 | 2% |
1 Property |
| 2018 | £400,000 | -18% |
1 Property |
| 2016 | £470,000 | 22% |
1 Property |
| 2010 | £368,333 | 48% |
1 Property |
| 2002 | £192,000 | - |
2 Properties |