
Houses for sale & to rent in Kirriemuir and Dean, Forfar
House Prices in Kirriemuir and Dean
Properties in Kirriemuir and Dean have an average house price of £160k and had 185 Property Transactions within the last 3 years¹.
Kirriemuir and Dean is an area in Forfar, Angus with 4,274 households², where the most expensive property was sold for £425k.
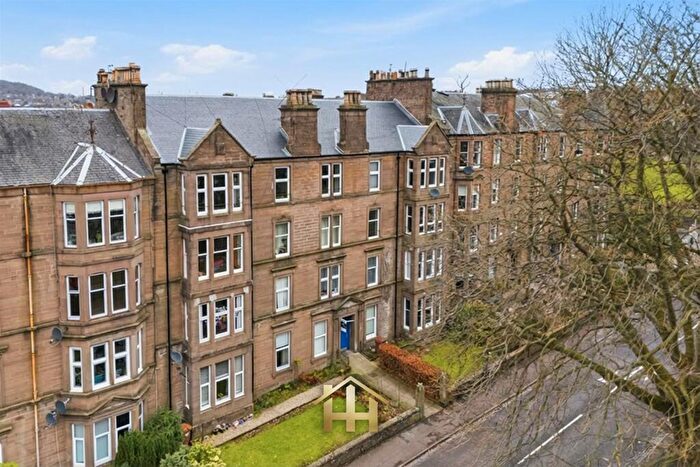
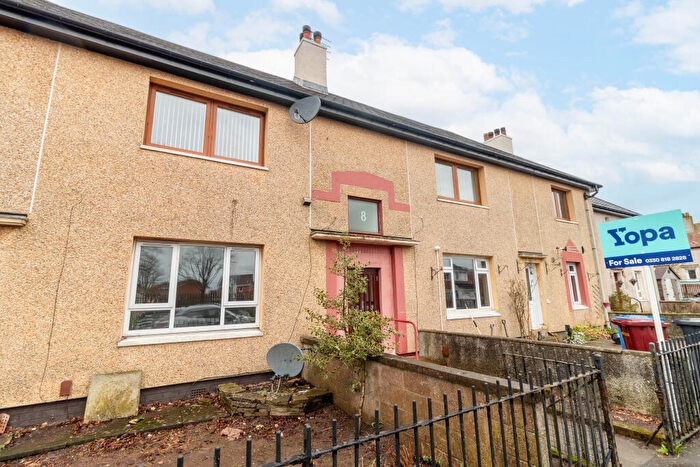
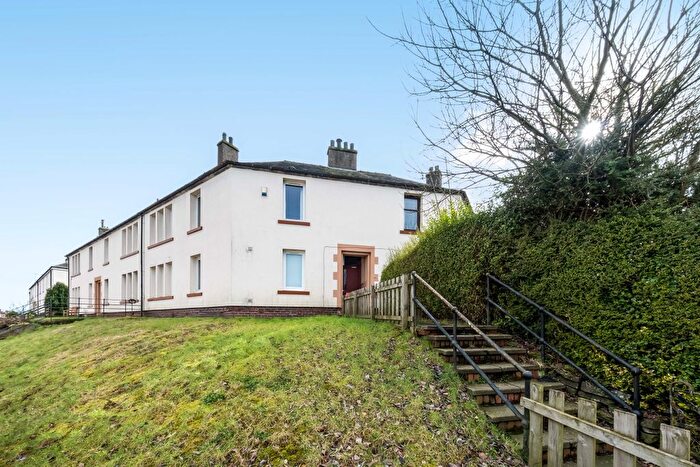
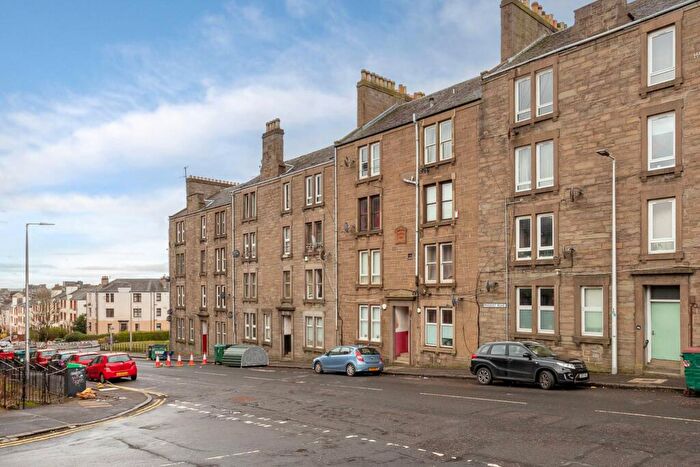
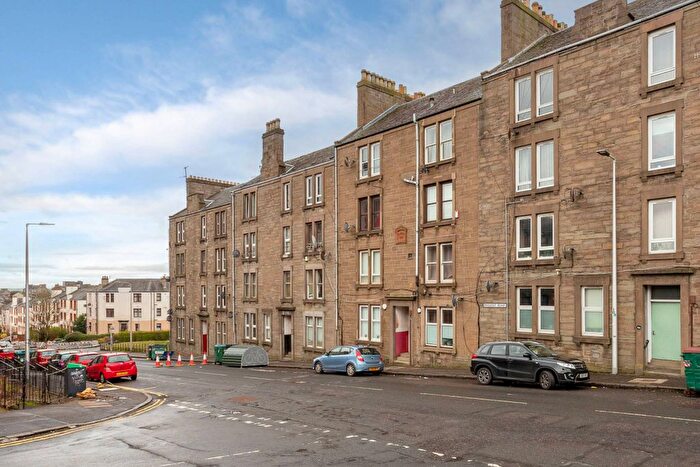
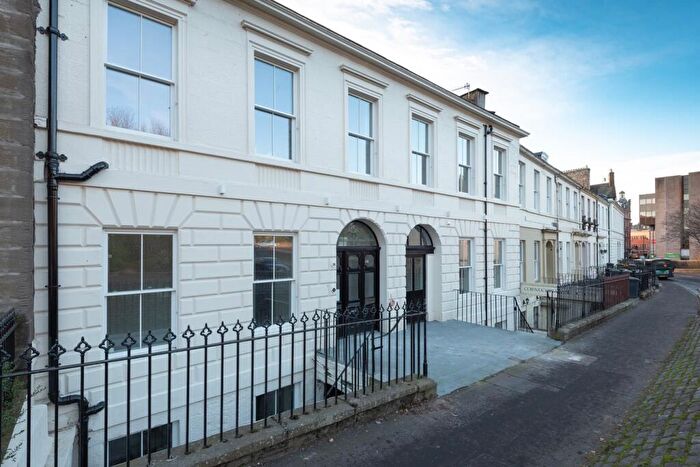
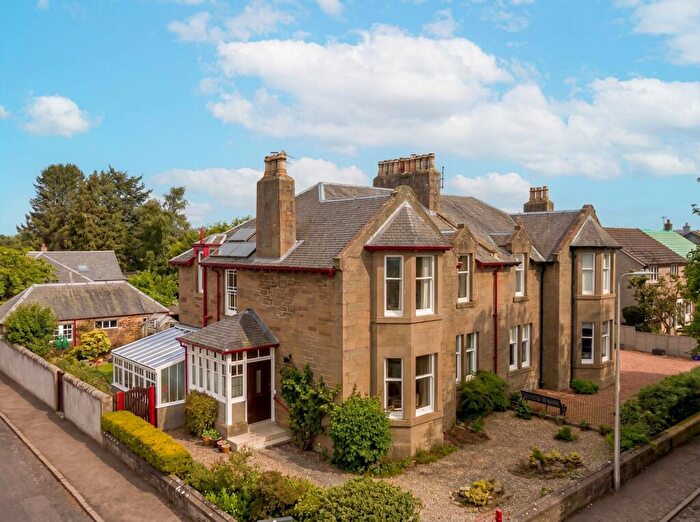
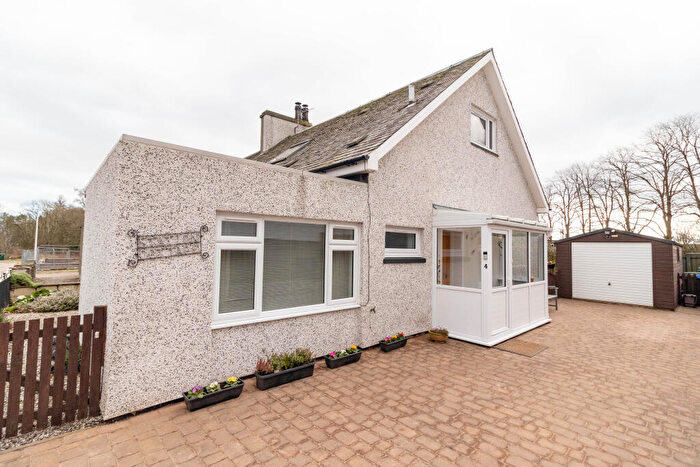
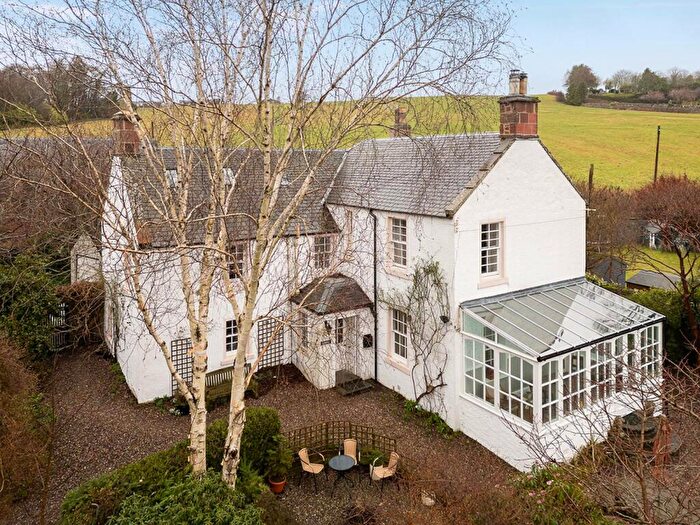
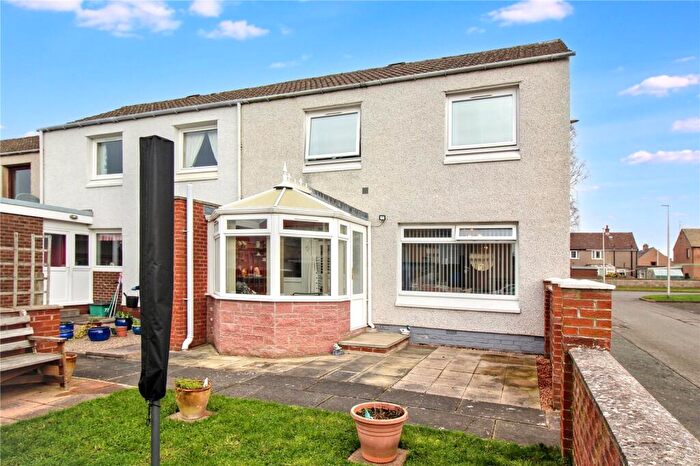
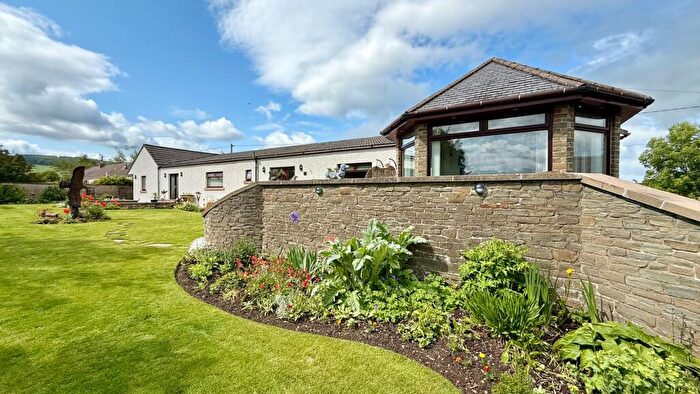
Properties for sale in Kirriemuir and Dean
![]()
If you are looking to sell your house, let it out, or receive a property valuation, an expert can help you.
Click the button below to get started.


Roads and Postcodes in Kirriemuir and Dean
Navigate through our locations to find the location of your next house in Kirriemuir and Dean, Forfar for sale or to rent.
Transport near Kirriemuir and Dean

- FAQ
- Price Paid By Year
Frequently asked questions about Kirriemuir and Dean
What is the average price for a property for sale in Kirriemuir and Dean?
The average price for a property for sale in Kirriemuir and Dean is £159,819. This amount is 1% higher than the average price in Forfar. There are 4,406 property listings for sale in Kirriemuir and Dean.
What streets have the most expensive properties for sale in Kirriemuir and Dean?
The streets with the most expensive properties for sale in Kirriemuir and Dean are Salmons Leap at an average of £357,000, Court Hillock Gardens at an average of £303,750 and Bon Scott Place at an average of £268,000.
What streets have the most affordable properties for sale in Kirriemuir and Dean?
The streets with the most affordable properties for sale in Kirriemuir and Dean are Hillbank Terrace at an average of £47,000, High Street at an average of £63,500 and Clova Road at an average of £70,000.
Which train stations are available in or near Kirriemuir and Dean?
Some of the train stations available in or near Kirriemuir and Dean are Invergowrie, Dundee and Broughty Ferry.
Property Price Paid in Kirriemuir and Dean by Year
The average sold property price by year was:
| Year | Average Sold Price | Price Change |
Sold Properties
|
|---|---|---|---|
| 2025 | £157,621 | 2% |
51 Properties |
| 2024 | £155,201 | -6% |
61 Properties |
| 2023 | £165,212 | -15% |
73 Properties |
| 2022 | £190,409 | 2% |
146 Properties |
| 2021 | £186,865 | -1% |
183 Properties |
| 2020 | £188,883 | 11% |
132 Properties |
| 2019 | £167,672 | 3% |
137 Properties |
| 2018 | £161,894 | -8% |
133 Properties |
| 2017 | £174,467 | 5% |
148 Properties |
| 2016 | £166,255 | -9% |
168 Properties |
| 2015 | £180,621 | 10% |
156 Properties |
| 2014 | £162,470 | 15% |
165 Properties |
| 2013 | £137,720 | -16% |
141 Properties |
| 2012 | £159,379 | -0,2% |
138 Properties |
| 2011 | £159,737 | 1% |
124 Properties |
| 2010 | £158,430 | -12% |
125 Properties |
| 2009 | £177,794 | 21% |
121 Properties |
| 2008 | £140,999 | 5% |
124 Properties |
| 2007 | £133,484 | 0,5% |
169 Properties |
| 2006 | £132,821 | 27% |
186 Properties |
| 2005 | £96,416 | 16% |
182 Properties |
| 2004 | £80,624 | 1% |
199 Properties |
| 2003 | £79,471 | 8% |
223 Properties |
| 2002 | £72,845 | -39% |
224 Properties |
| 2001 | £100,898 | - |
18 Properties |