
Houses for sale & to rent in Strathmore, Blairgowrie
House Prices in Strathmore
Properties in Strathmore have an average house price of £183k and had 153 Property Transactions within the last 3 years¹.
Strathmore is an area in Blairgowrie, Perth and Kinross with 3,526 households², where the most expensive property was sold for £1.57M.
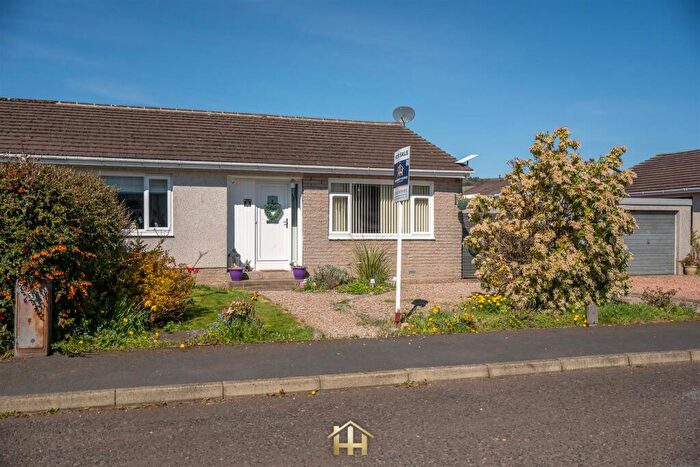
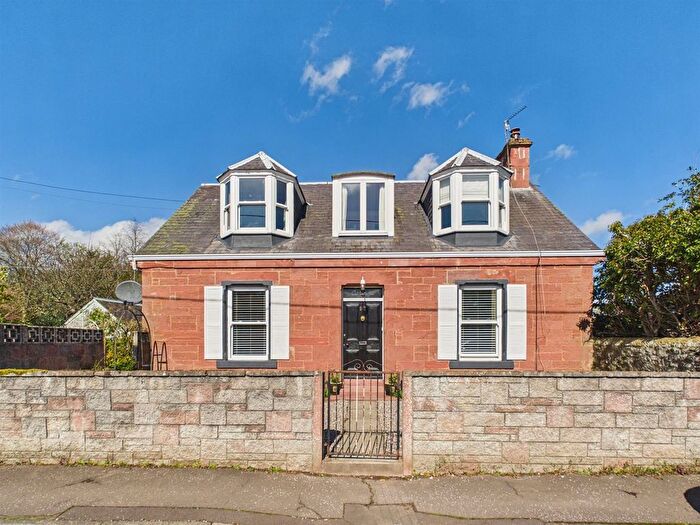
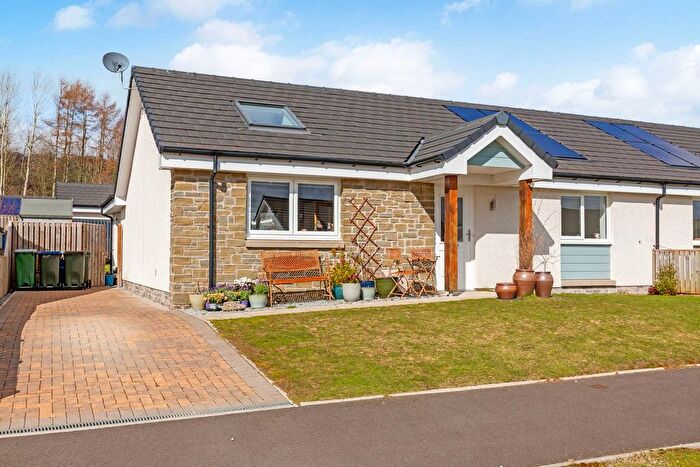
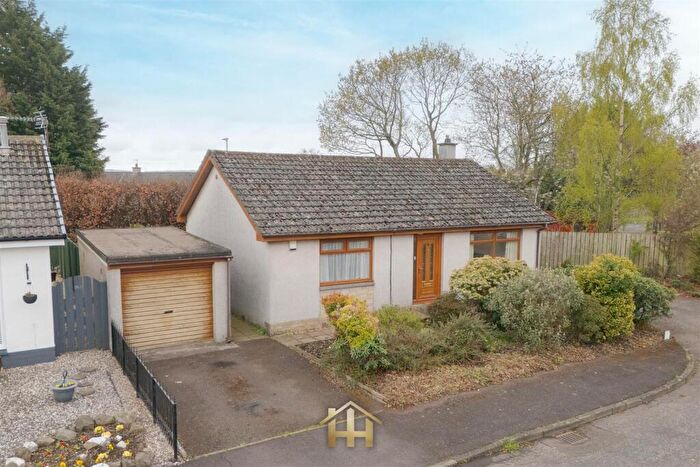
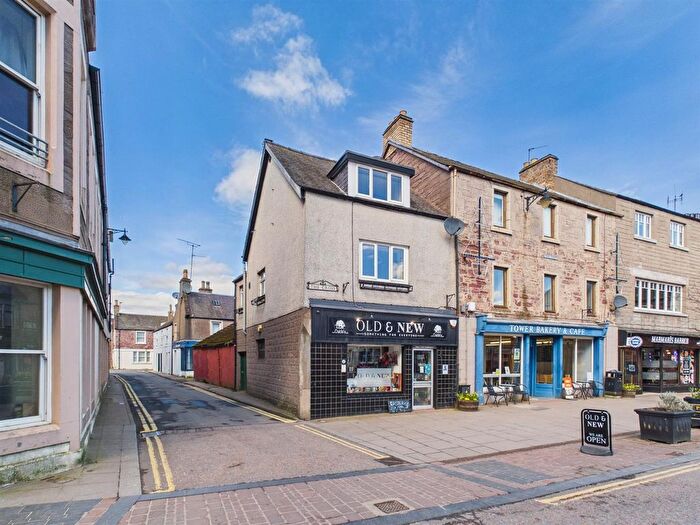
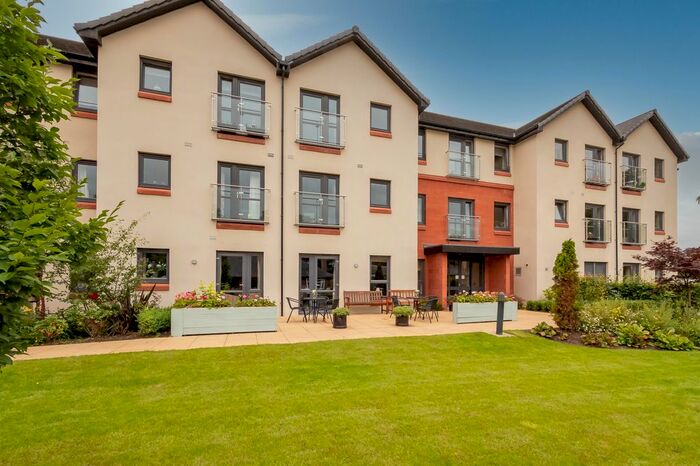
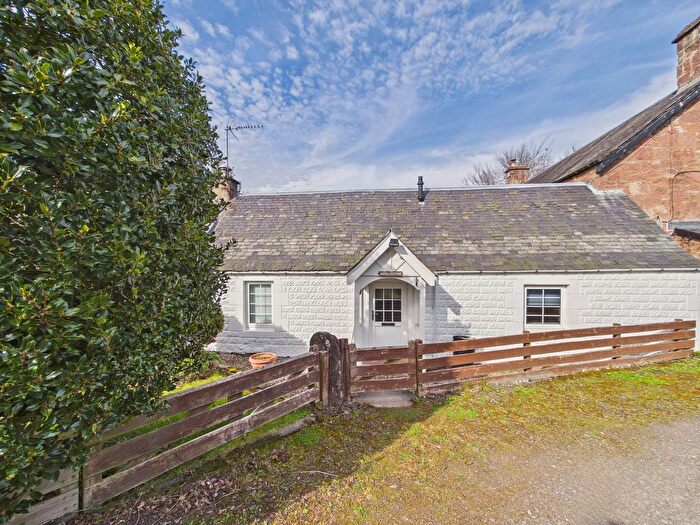
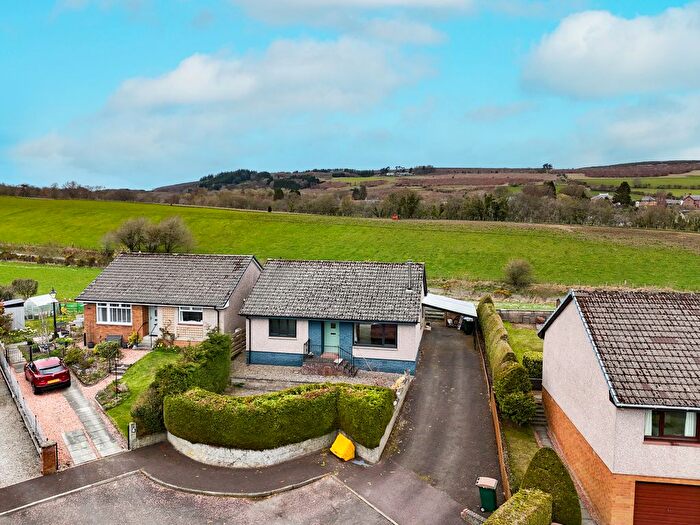
Properties for sale in Strathmore
![]()
If you are looking to sell your house, let it out, or receive a property valuation, an expert can help you.
Click the button below to get started.


Roads and Postcodes in Strathmore
Navigate through our locations to find the location of your next house in Strathmore, Blairgowrie for sale or to rent.
Transport near Strathmore

- FAQ
- Price Paid By Year
Frequently asked questions about Strathmore
What is the average price for a property for sale in Strathmore?
The average price for a property for sale in Strathmore is £182,959. This amount is 7% lower than the average price in Blairgowrie. There are 1,706 property listings for sale in Strathmore.
What streets have the most expensive properties for sale in Strathmore?
The streets with the most expensive properties for sale in Strathmore are Albert Street at an average of £430,000, Boreland Mill at an average of £350,000 and Keillor Steadings at an average of £344,250.
What streets have the most affordable properties for sale in Strathmore?
The streets with the most affordable properties for sale in Strathmore are Bogside Road at an average of £49,499, Calton Street at an average of £57,500 and Church Place at an average of £58,000.
Which train stations are available in or near Strathmore?
Some of the train stations available in or near Strathmore are Invergowrie, Dunkeld and Birnam and Dundee.
Property Price Paid in Strathmore by Year
The average sold property price by year was:
| Year | Average Sold Price | Price Change |
Sold Properties
|
|---|---|---|---|
| 2025 | £177,612 | 4% |
53 Properties |
| 2024 | £170,914 | -13% |
32 Properties |
| 2023 | £192,795 | -14% |
68 Properties |
| 2022 | £220,310 | 9% |
160 Properties |
| 2021 | £201,187 | -3% |
188 Properties |
| 2020 | £207,073 | 14% |
111 Properties |
| 2019 | £177,172 | 2% |
132 Properties |
| 2018 | £172,762 | 12% |
136 Properties |
| 2017 | £152,807 | -7% |
132 Properties |
| 2016 | £163,585 | 8% |
123 Properties |
| 2015 | £151,010 | -3% |
143 Properties |
| 2014 | £155,693 | 2% |
114 Properties |
| 2013 | £152,401 | -4% |
85 Properties |
| 2012 | £157,929 | -2% |
86 Properties |
| 2011 | £161,476 | -94% |
81 Properties |
| 2010 | £314,022 | 57% |
96 Properties |
| 2009 | £135,484 | -13% |
91 Properties |
| 2008 | £153,291 | 13% |
119 Properties |
| 2007 | £133,909 | 3% |
138 Properties |
| 2006 | £129,553 | 18% |
197 Properties |
| 2005 | £106,758 | 26% |
172 Properties |
| 2004 | £79,532 | 2% |
174 Properties |
| 2003 | £78,024 | -11% |
186 Properties |
| 2002 | £86,897 | 51% |
216 Properties |
| 2001 | £42,184 | - |
15 Properties |