
Houses for sale & to rent in Helensburgh Central, Helensburgh
House Prices in Helensburgh Central
Properties in Helensburgh Central have an average house price of £277k and had 258 Property Transactions within the last 3 years¹.
Helensburgh Central is an area in Helensburgh, Argyll and Bute with 4,574 households², where the most expensive property was sold for £865k.
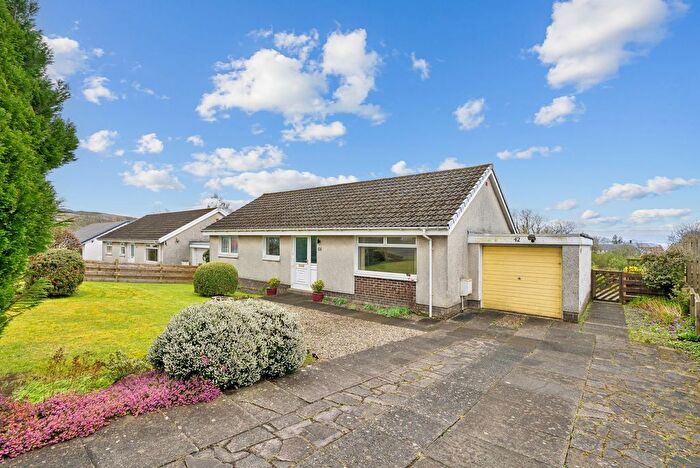
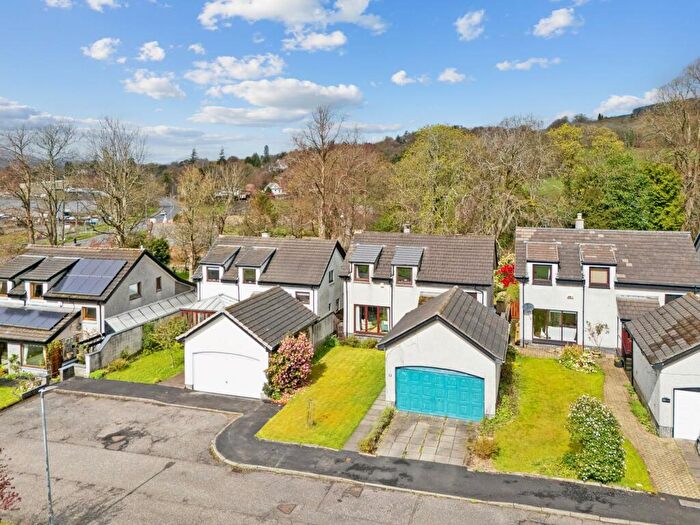
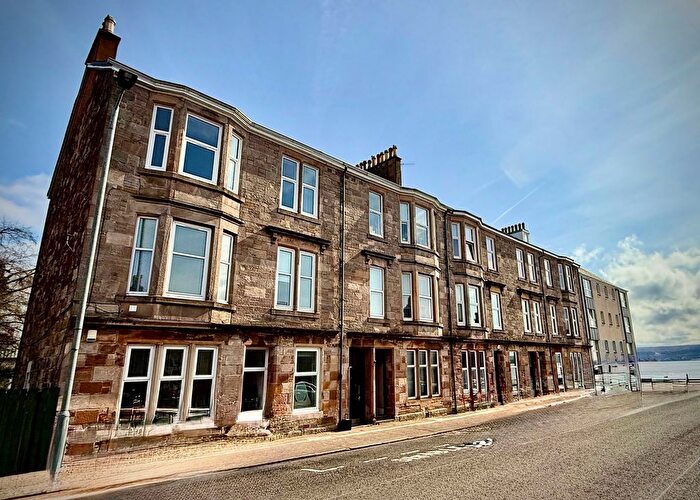
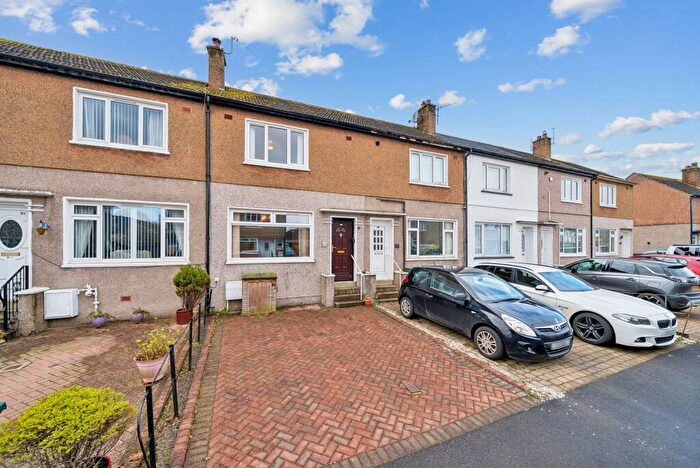
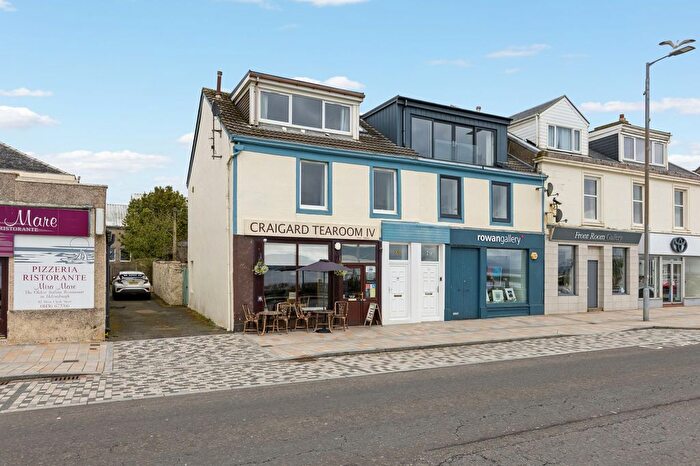
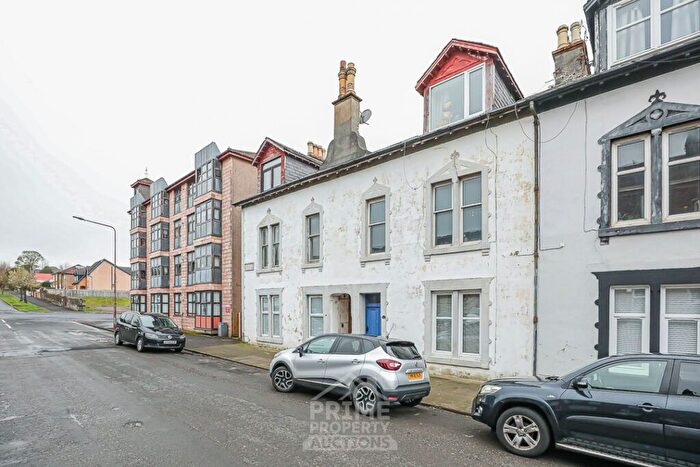
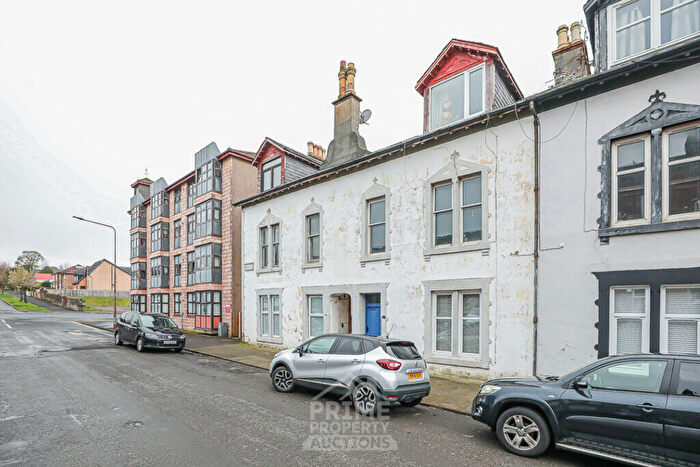
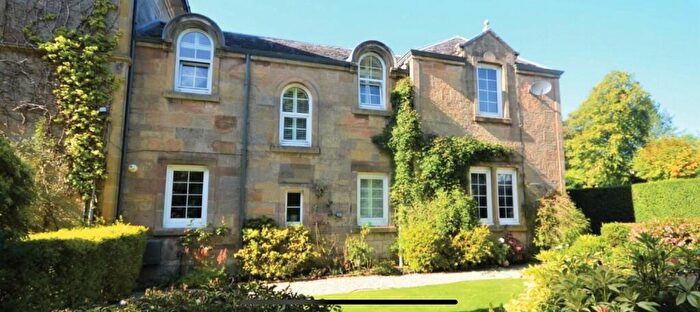
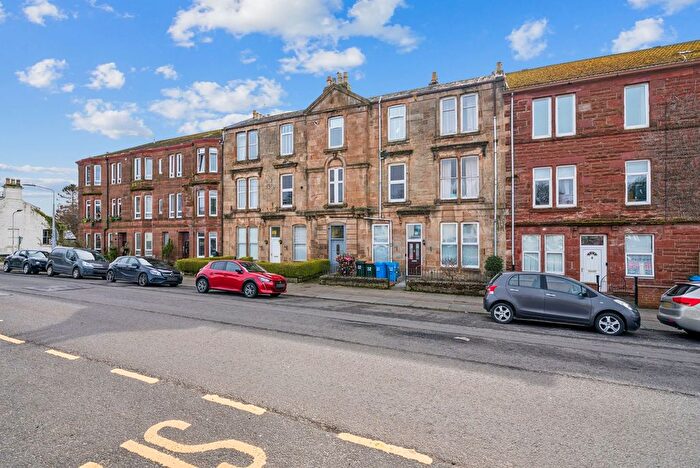
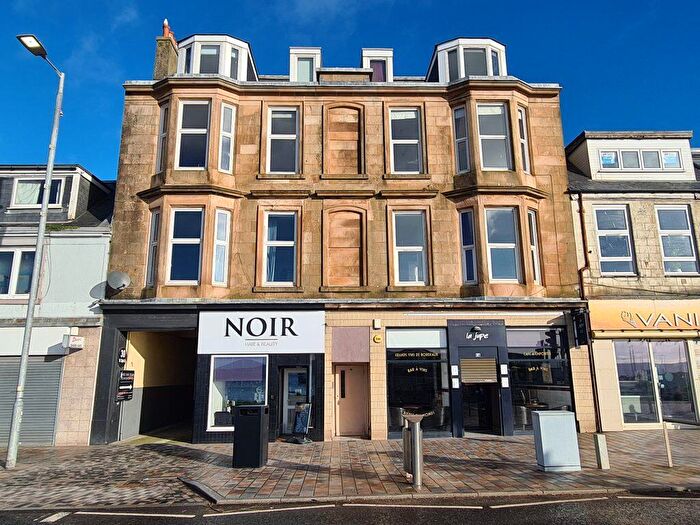
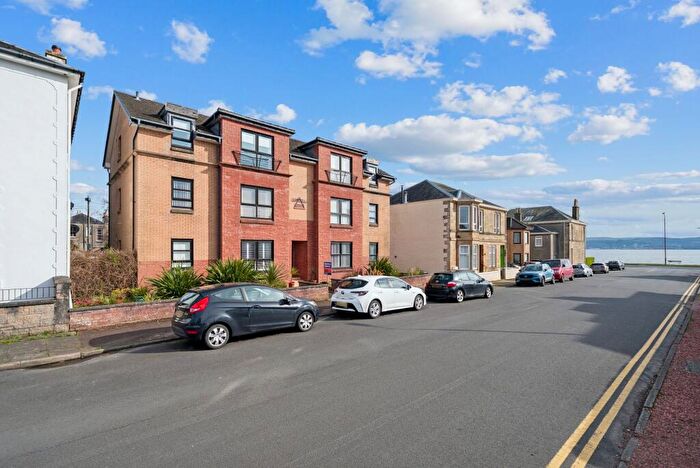
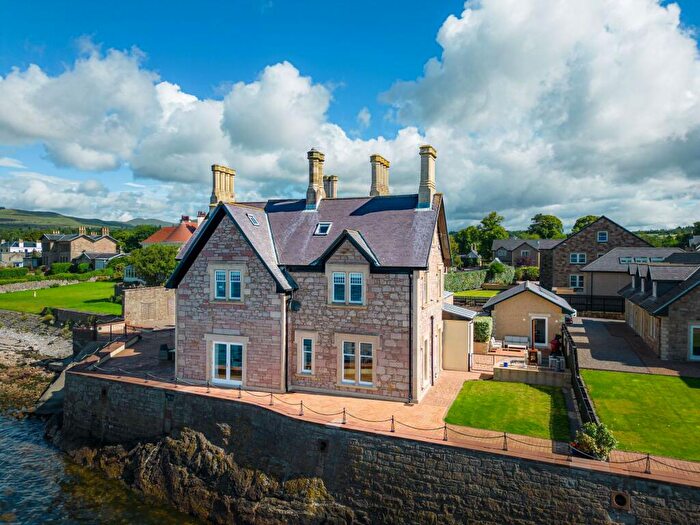
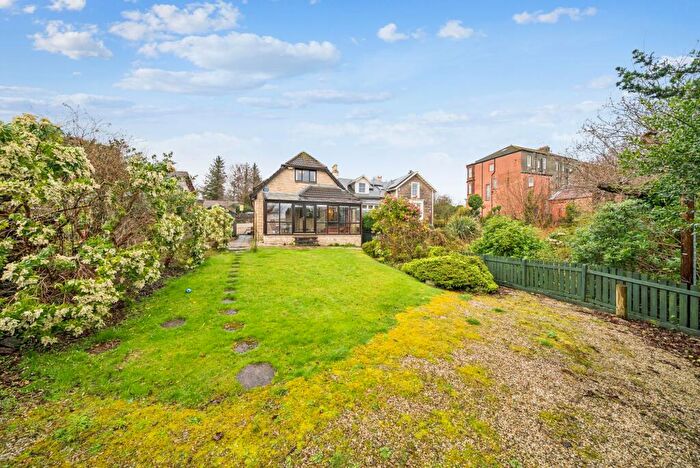
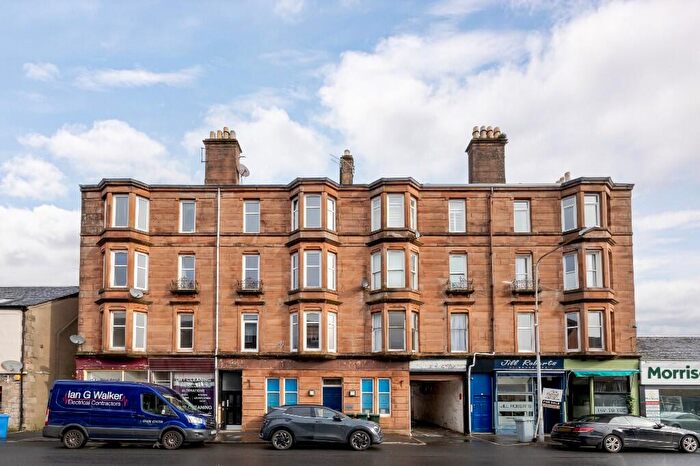
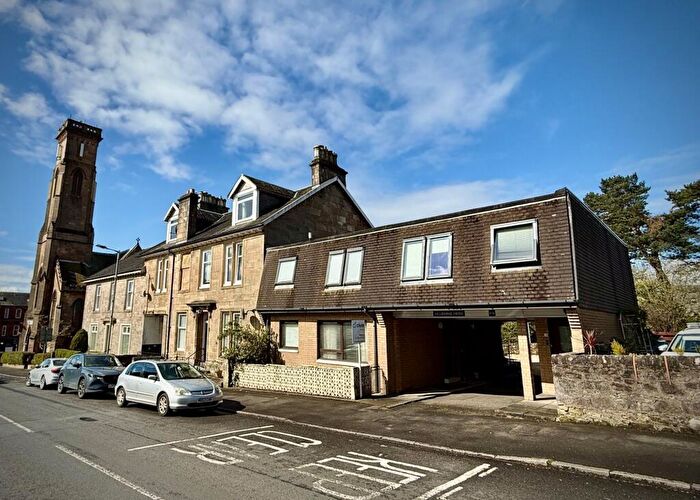
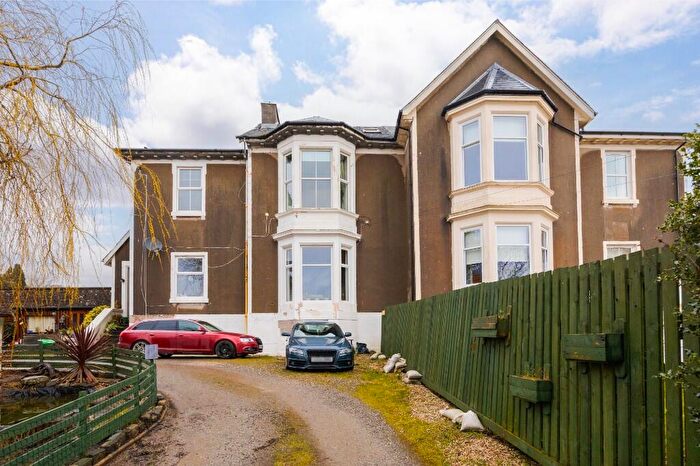
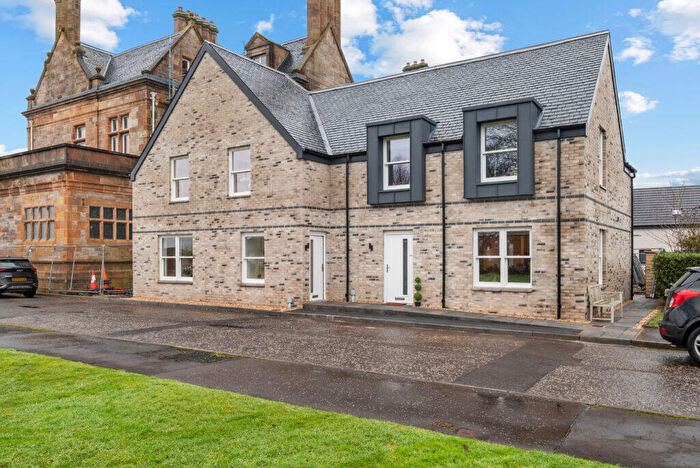
Properties for sale in Helensburgh Central
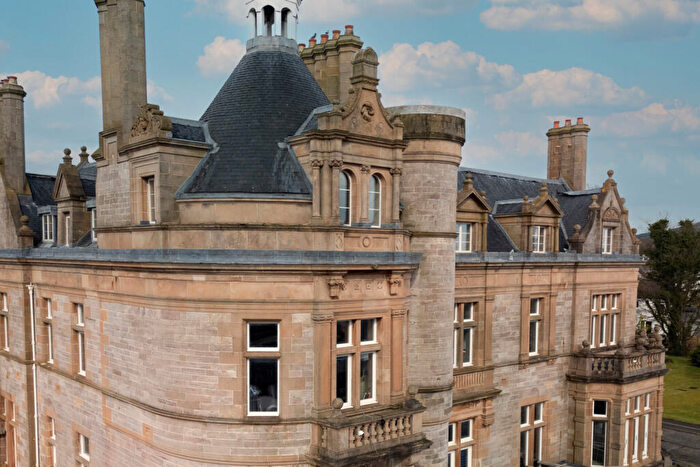
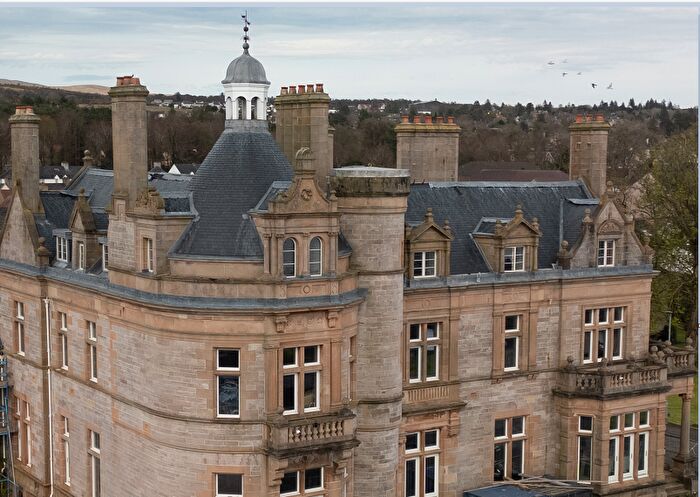
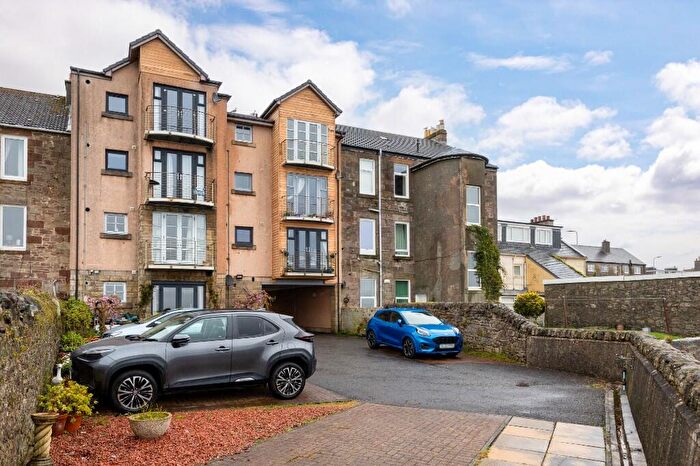
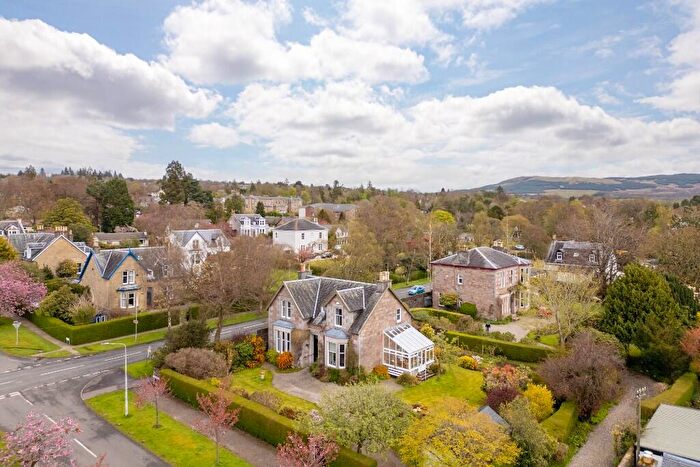
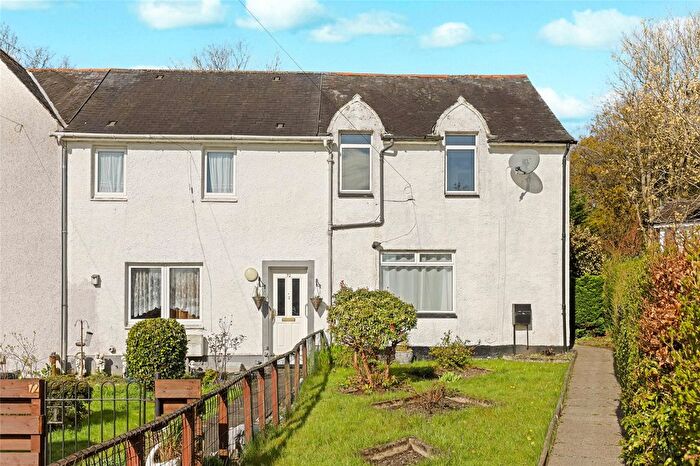
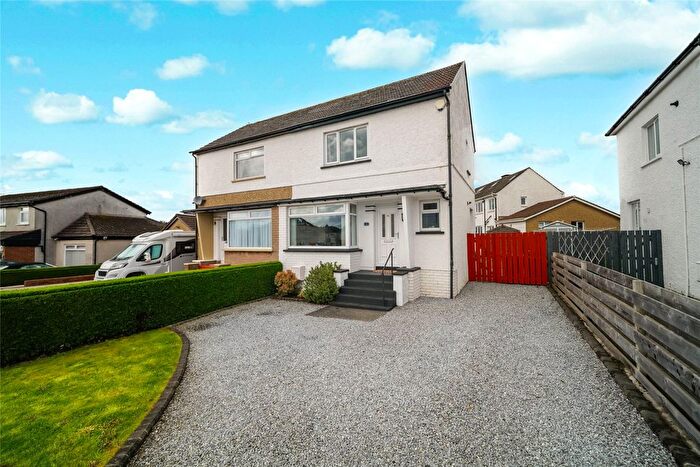
![]()
If you are looking to sell your house, let it out, or receive a property valuation, an expert can help you.
Click the button below to get started.
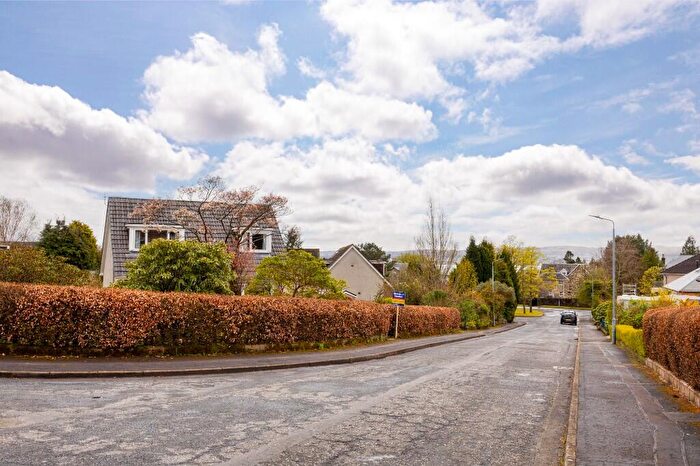
Roads and Postcodes in Helensburgh Central
Navigate through our locations to find the location of your next house in Helensburgh Central, Helensburgh for sale or to rent.
Transport near Helensburgh Central

- FAQ
- Price Paid By Year
Frequently asked questions about Helensburgh Central
What is the average price for a property for sale in Helensburgh Central?
The average price for a property for sale in Helensburgh Central is £277,421. This amount is 0.63% higher than the average price in Helensburgh. There are 1,243 property listings for sale in Helensburgh Central.
What streets have the most expensive properties for sale in Helensburgh Central?
The streets with the most expensive properties for sale in Helensburgh Central are Kennedy Drive at an average of £656,500, Victoria Road at an average of £650,000 and Queen Street at an average of £597,100.
What streets have the most affordable properties for sale in Helensburgh Central?
The streets with the most affordable properties for sale in Helensburgh Central are Lomond Street at an average of £74,500, Maitland Court at an average of £89,645 and East Argyle Street at an average of £90,625.
Which train stations are available in or near Helensburgh Central?
Some of the train stations available in or near Helensburgh Central are Helensburgh Central, Helensburgh Upper and Craigendoran.
Property Price Paid in Helensburgh Central by Year
The average sold property price by year was:
| Year | Average Sold Price | Price Change |
Sold Properties
|
|---|---|---|---|
| 2025 | £290,698 | 8% |
75 Properties |
| 2024 | £268,396 | -2% |
74 Properties |
| 2023 | £274,413 | 23% |
109 Properties |
| 2022 | £211,096 | 1% |
234 Properties |
| 2021 | £209,804 | 7% |
296 Properties |
| 2020 | £195,549 | 3% |
214 Properties |
| 2019 | £189,400 | 1% |
264 Properties |
| 2018 | £186,680 | 9% |
235 Properties |
| 2017 | £170,673 | 3% |
275 Properties |
| 2016 | £166,028 | 5% |
229 Properties |
| 2015 | £157,154 | -5% |
198 Properties |
| 2014 | £164,337 | -11% |
205 Properties |
| 2013 | £182,793 | 7% |
166 Properties |
| 2012 | £169,523 | -1% |
175 Properties |
| 2011 | £170,546 | -3% |
169 Properties |
| 2010 | £175,603 | 7% |
172 Properties |
| 2009 | £163,219 | -1% |
154 Properties |
| 2008 | £164,112 | -10% |
199 Properties |
| 2007 | £181,312 | 8% |
288 Properties |
| 2006 | £166,145 | 15% |
353 Properties |
| 2005 | £141,519 | 7% |
332 Properties |
| 2004 | £132,108 | 21% |
308 Properties |
| 2003 | £103,845 | 20% |
336 Properties |
| 2002 | £82,711 | -4% |
342 Properties |
| 2001 | £86,004 | - |
33 Properties |