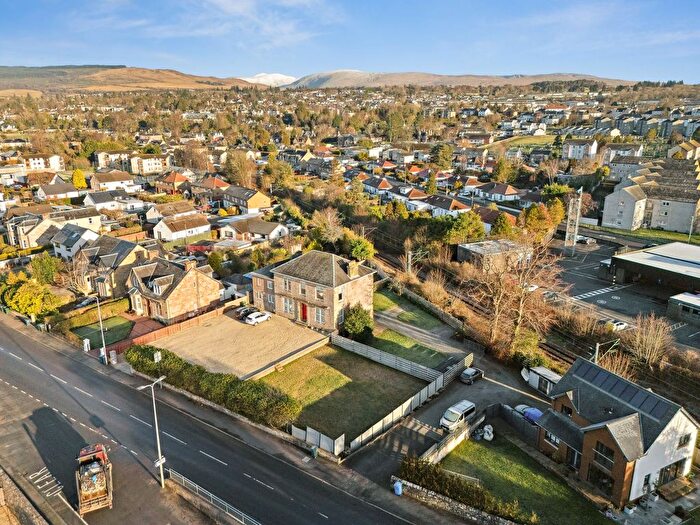
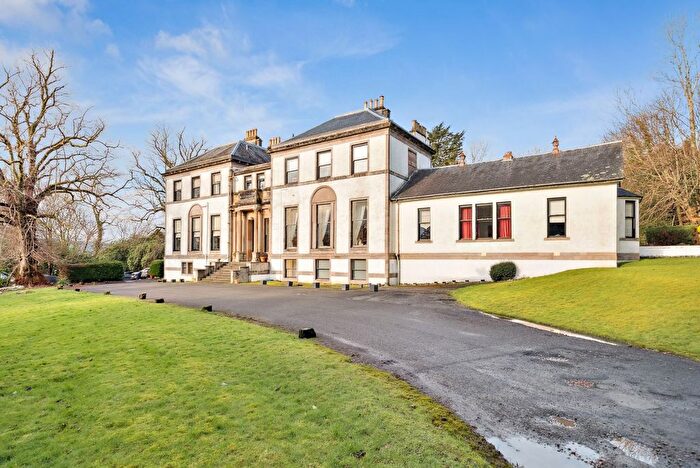
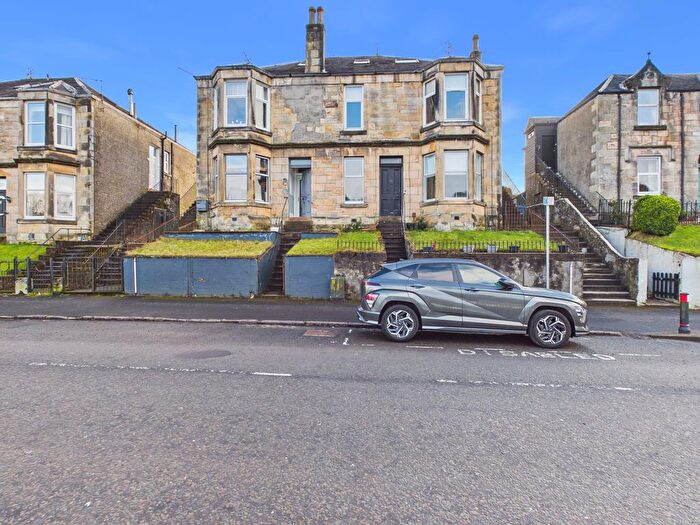
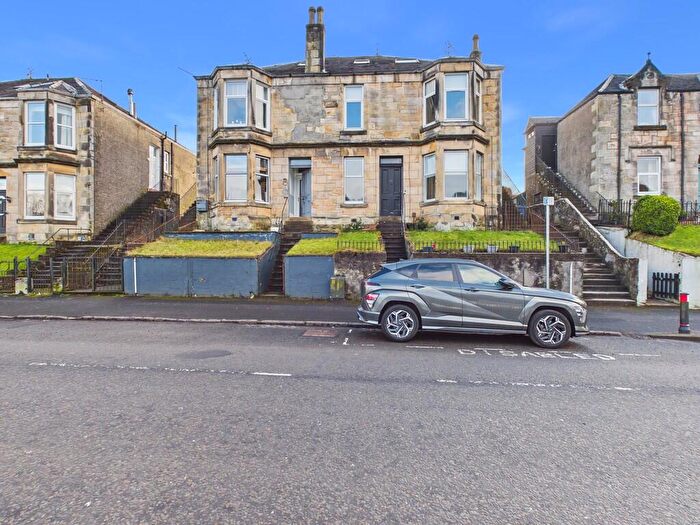
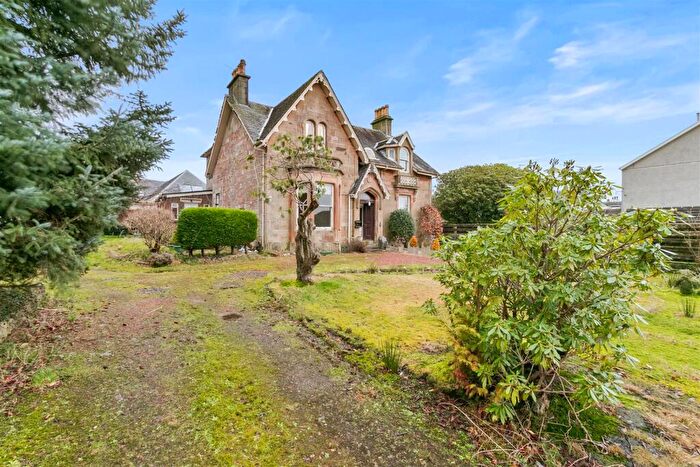
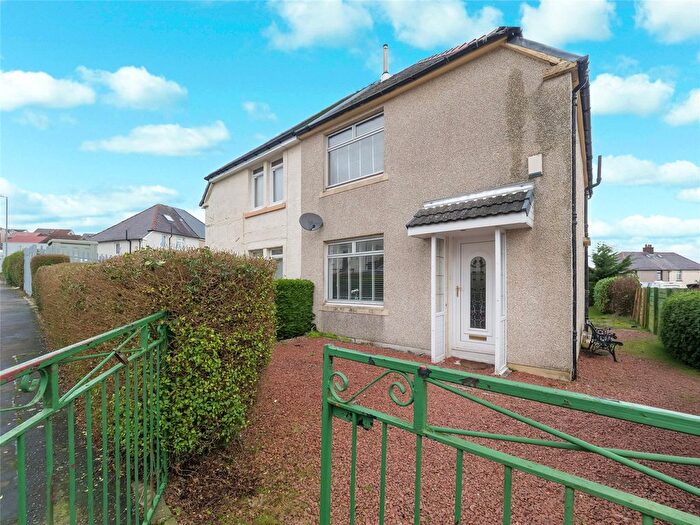
Houses for sale & to rent in Helensburgh, Argyll and Bute
House Prices in Helensburgh
Properties in Helensburgh have an average house price of £274,738.00 and had 492 Property Transactions within the last 3 years.¹
Helensburgh is an area in Argyll and Bute with 9,187 households², where the most expensive property was sold for £1,450,000.00.
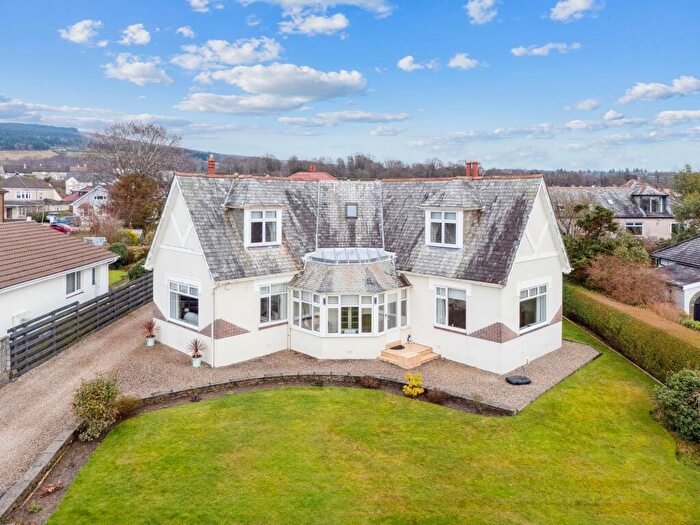
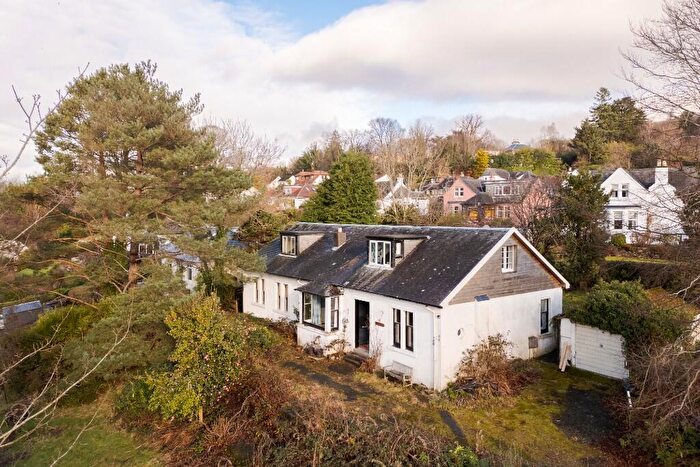
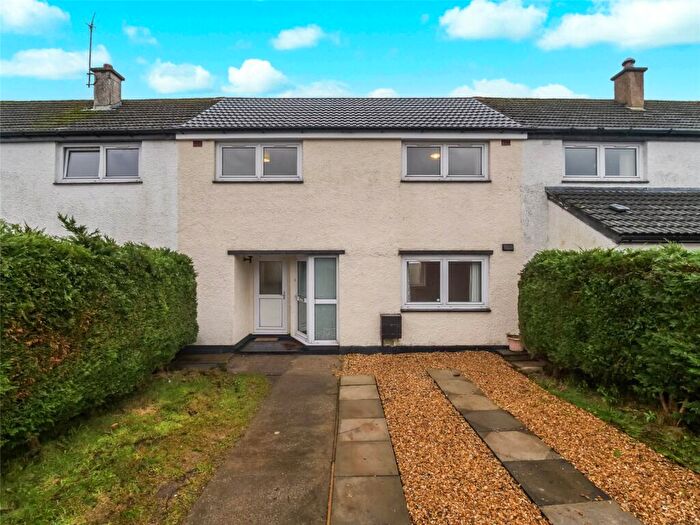
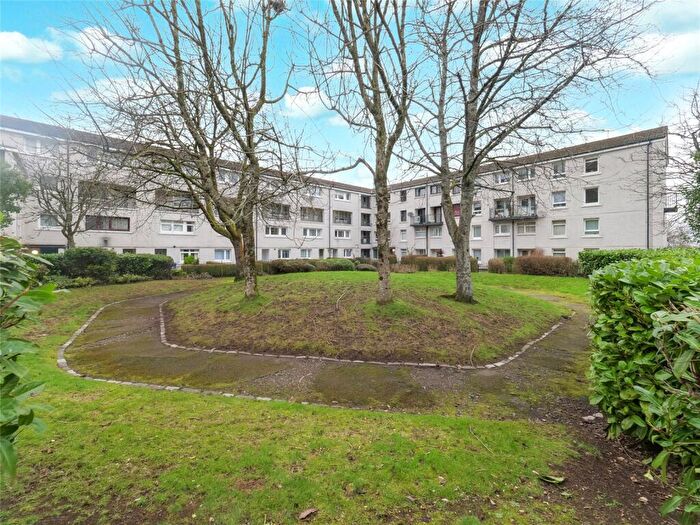
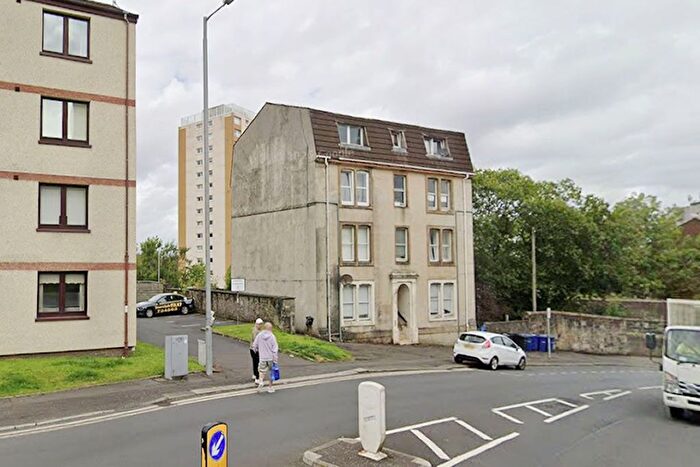
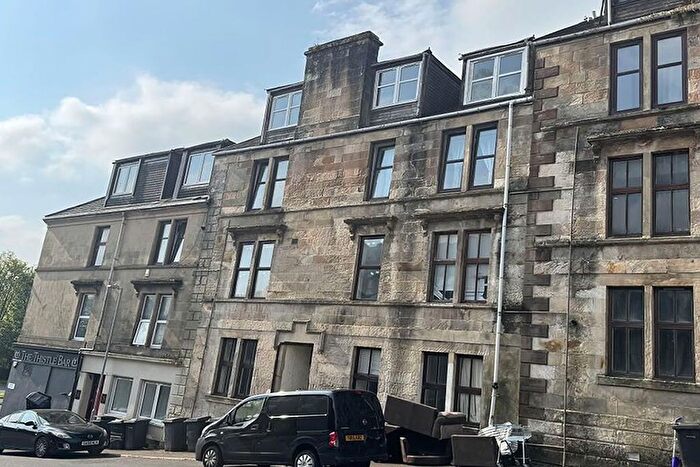
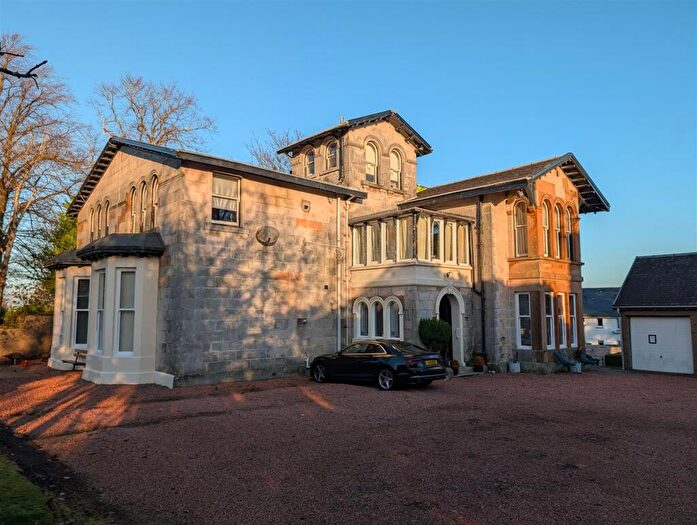
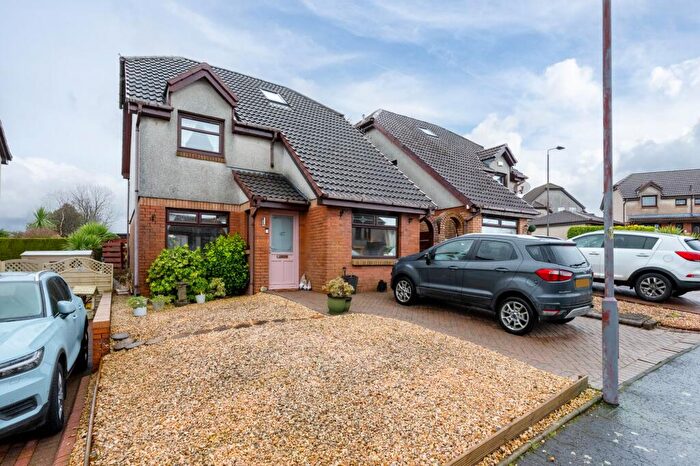
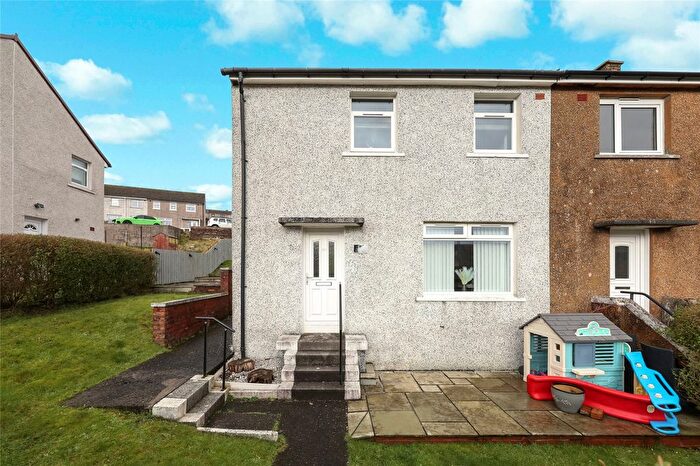
Properties for sale in Helensburgh
Neighbourhoods in Helensburgh
Navigate through our locations to find the location of your next house in Helensburgh, Argyll and Bute for sale or to rent.
Transport in Helensburgh
Please see below transportation links in this area:
- FAQ
- Price Paid By Year
Frequently asked questions about Helensburgh
What is the average price for a property for sale in Helensburgh?
The average price for a property for sale in Helensburgh is £274,738. This amount is 33% higher than the average price in Argyll and Bute. There are 5,678 property listings for sale in Helensburgh.
What locations have the most expensive properties for sale in Helensburgh?
The locations with the most expensive properties for sale in Helensburgh are Helensburgh and Lomond South at an average of £283,284 and Helensburgh Central at an average of £275,965.
What locations have the most affordable properties for sale in Helensburgh?
The location with the most affordable properties for sale in Helensburgh is Lomond North at an average of £263,873.
Which train stations are available in or near Helensburgh?
Some of the train stations available in or near Helensburgh are Helensburgh Upper, Helensburgh Central and Craigendoran.
Property Price Paid in Helensburgh by Year
The average sold property price by year was:
| Year | Average Sold Price | Price Change |
Sold Properties
|
|---|---|---|---|
| 2025 | £260,841 | -15% |
138 Properties |
| 2024 | £299,874 | 11% |
140 Properties |
| 2023 | £267,255 | 13% |
214 Properties |
| 2022 | £231,455 | -1% |
427 Properties |
| 2021 | £234,197 | 10% |
557 Properties |
| 2020 | £211,765 | 8% |
418 Properties |
| 2019 | £193,939 | -2% |
498 Properties |
| 2018 | £197,604 | 10% |
433 Properties |
| 2017 | £177,909 | 4% |
480 Properties |
| 2016 | £171,003 | 0,4% |
450 Properties |
| 2015 | £170,343 | 5% |
378 Properties |
| 2014 | £162,212 | -12% |
397 Properties |
| 2013 | £181,552 | 11% |
318 Properties |
| 2012 | £160,863 | -5% |
322 Properties |
| 2011 | £169,468 | -10% |
322 Properties |
| 2010 | £185,926 | 12% |
307 Properties |
| 2009 | £163,254 | -8% |
294 Properties |
| 2008 | £175,904 | -0,3% |
377 Properties |
| 2007 | £176,486 | 2% |
535 Properties |
| 2006 | £173,159 | 15% |
601 Properties |
| 2005 | £147,981 | 8% |
632 Properties |
| 2004 | £135,528 | 21% |
584 Properties |
| 2003 | £107,679 | 23% |
575 Properties |
| 2002 | £83,111 | -5% |
650 Properties |
| 2001 | £87,084 | - |
52 Properties |

