
Houses for sale & to rent in Stranraer, Dumfries and Galloway
House Prices in Stranraer
Properties in Stranraer have an average house price of £129k and had 305 Property Transactions within the last 3 years.¹
Stranraer is an area in Dumfries and Galloway with 7,529 households², where the most expensive property was sold for £440k.
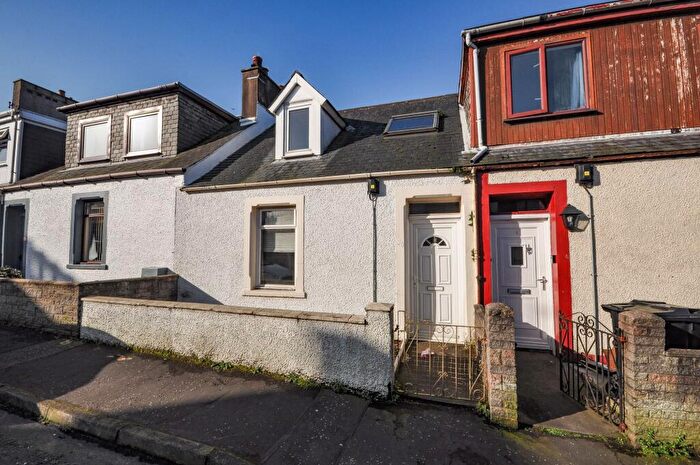
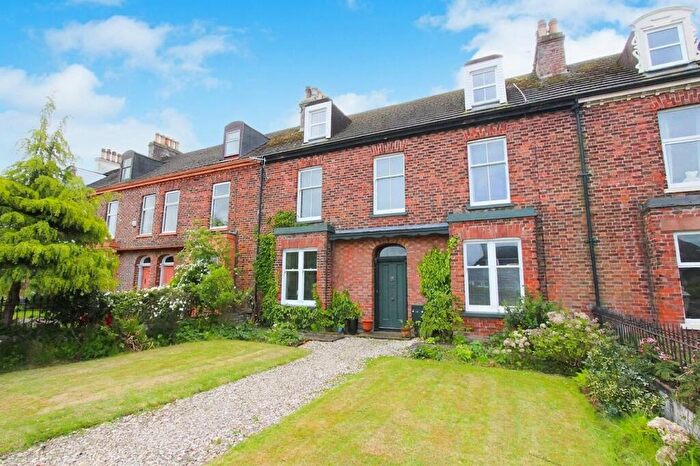
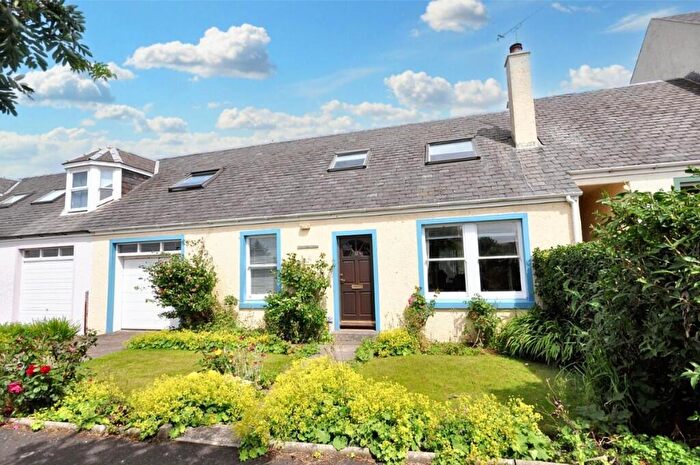
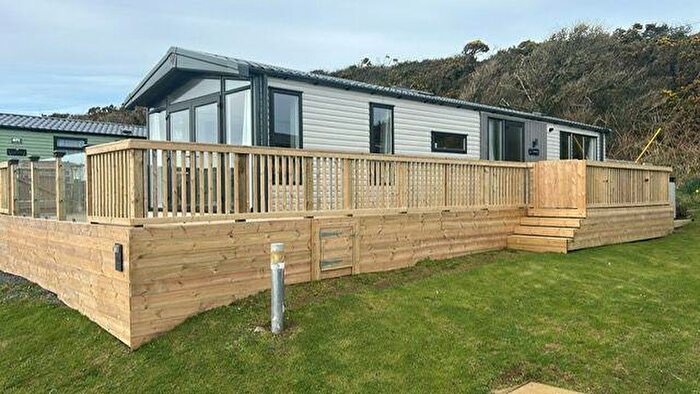
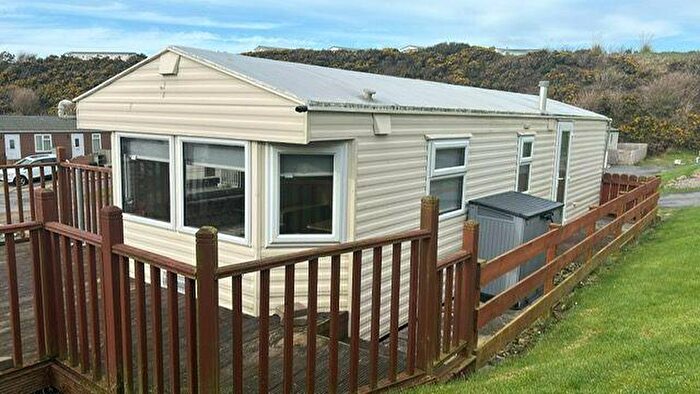
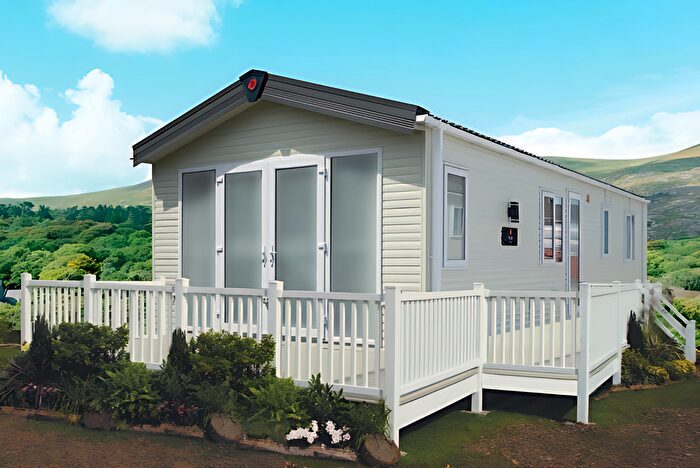
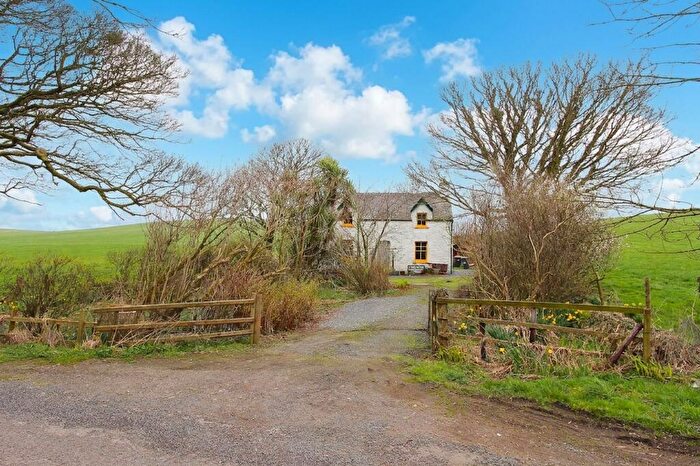
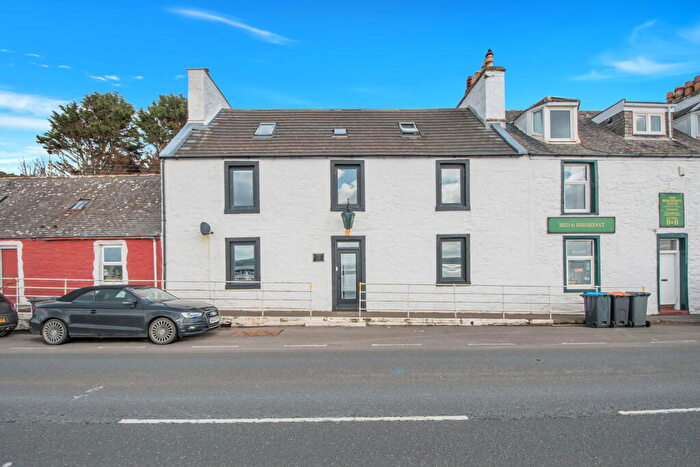
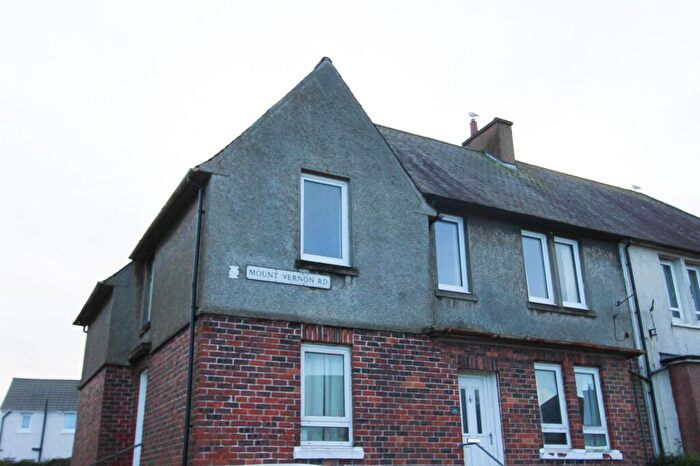
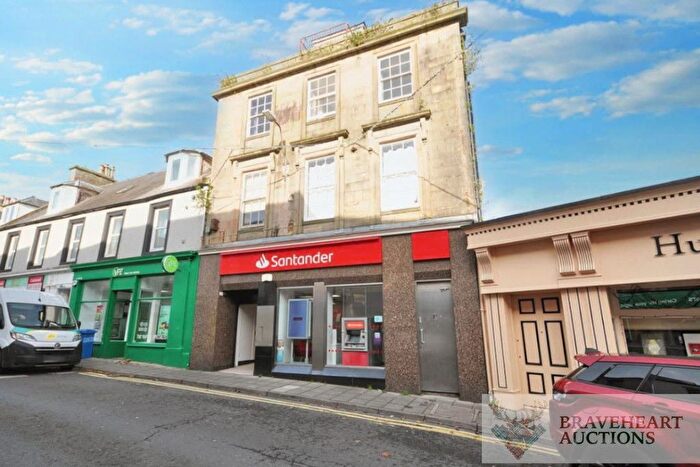
Properties for sale in Stranraer
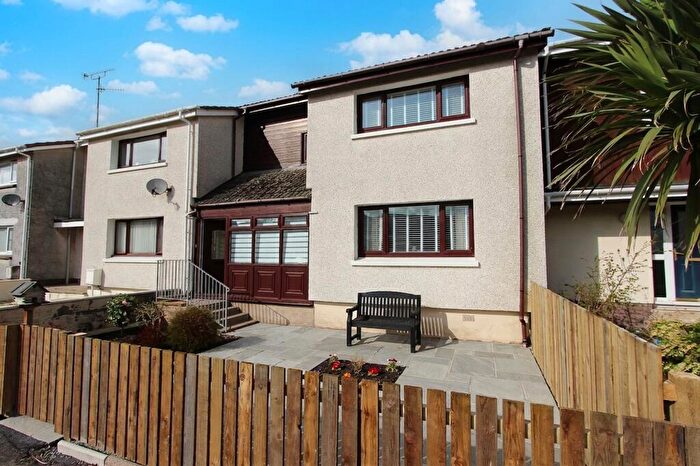
![]()
If you are looking to sell your house, let it out, or receive a property valuation, an expert can help you.
Click the button below to get started.


Neighbourhoods in Stranraer
Navigate through our locations to find the location of your next house in Stranraer, Dumfries and Galloway for sale or to rent.
Transport in Stranraer
Please see below transportation links in this area:

- FAQ
- Price Paid By Year
Frequently asked questions about Stranraer
What is the average price for a property for sale in Stranraer?
The average price for a property for sale in Stranraer is £128,694. This amount is 18% lower than the average price in Dumfries and Galloway. There are 1,292 property listings for sale in Stranraer.
What locations have the most expensive properties for sale in Stranraer?
The location with the most expensive properties for sale in Stranraer is Stranraer and the Rhins at an average of £129,384.
What locations have the most affordable properties for sale in Stranraer?
The location with the most affordable properties for sale in Stranraer is Mid Galloway and Wigtown West at an average of £94,333.
Which train stations are available in or near Stranraer?
Some of the train stations available in or near Stranraer are Stranraer, Barrhill and Girvan.
Property Price Paid in Stranraer by Year
The average sold property price by year was:
| Year | Average Sold Price | Price Change |
Sold Properties
|
|---|---|---|---|
| 2025 | £143,477 | 11% |
79 Properties |
| 2024 | £127,501 | 6% |
107 Properties |
| 2023 | £119,955 | -27% |
119 Properties |
| 2022 | £152,635 | 6% |
286 Properties |
| 2021 | £142,984 | 6% |
307 Properties |
| 2020 | £133,782 | 5% |
213 Properties |
| 2019 | £126,476 | 0,2% |
270 Properties |
| 2018 | £126,265 | 9% |
215 Properties |
| 2017 | £115,236 | -1% |
230 Properties |
| 2016 | £116,600 | -4% |
234 Properties |
| 2015 | £121,017 | 11% |
203 Properties |
| 2014 | £107,145 | -4% |
182 Properties |
| 2013 | £111,260 | 5% |
188 Properties |
| 2012 | £105,465 | -12% |
150 Properties |
| 2011 | £117,631 | -1% |
154 Properties |
| 2010 | £118,955 | 9% |
184 Properties |
| 2009 | £107,801 | -6% |
231 Properties |
| 2008 | £114,715 | -9% |
247 Properties |
| 2007 | £124,932 | 16% |
307 Properties |
| 2006 | £104,339 | 14% |
382 Properties |
| 2005 | £89,585 | 6% |
346 Properties |
| 2004 | £84,244 | 22% |
398 Properties |
| 2003 | £65,640 | 17% |
447 Properties |
| 2002 | £54,199 | 8% |
387 Properties |
| 2001 | £49,621 | - |
33 Properties |