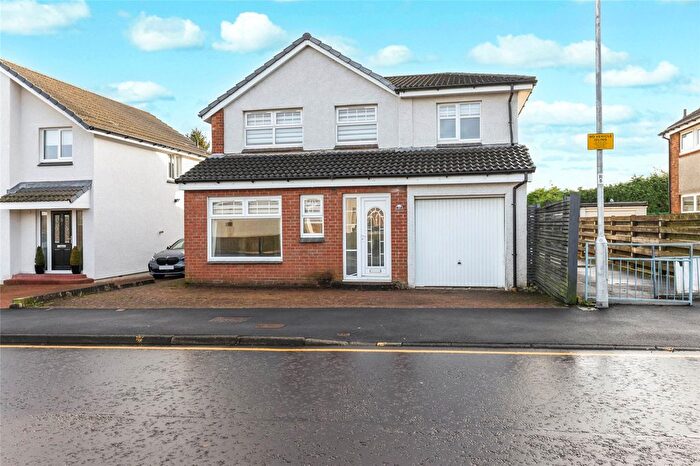
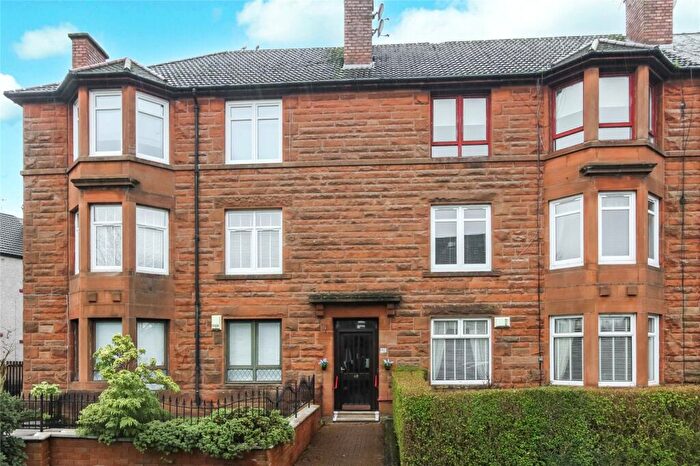
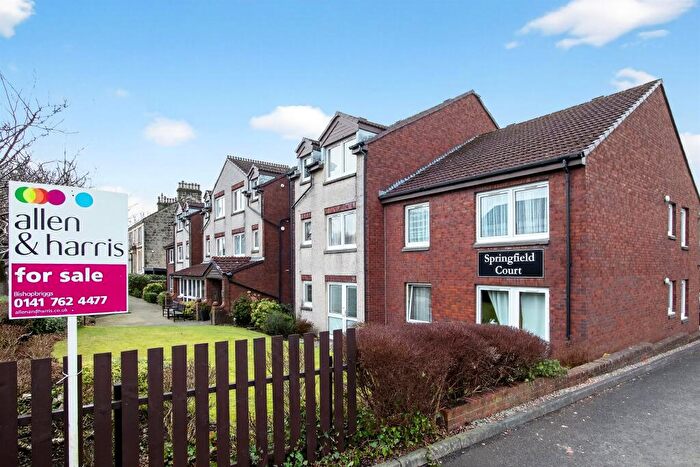
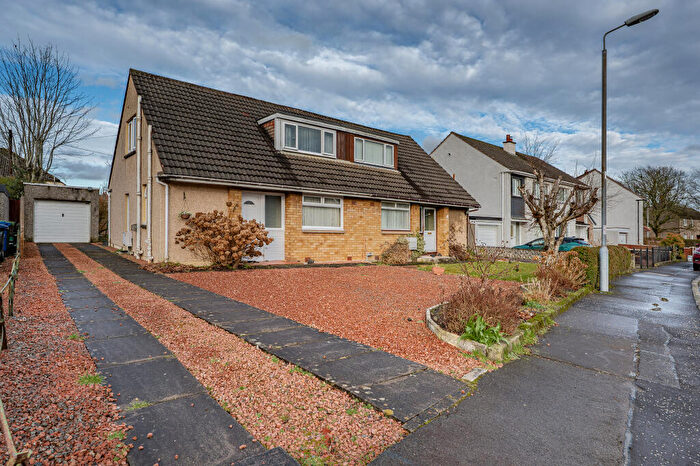
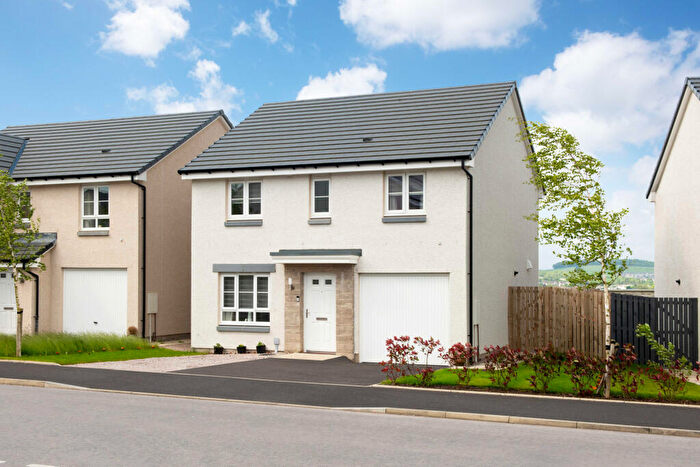
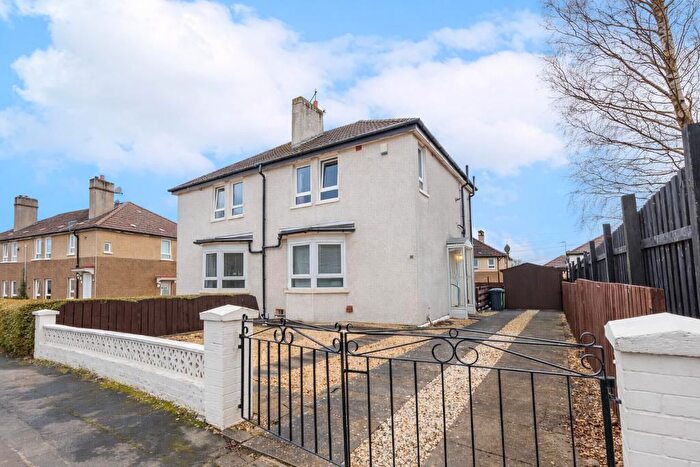
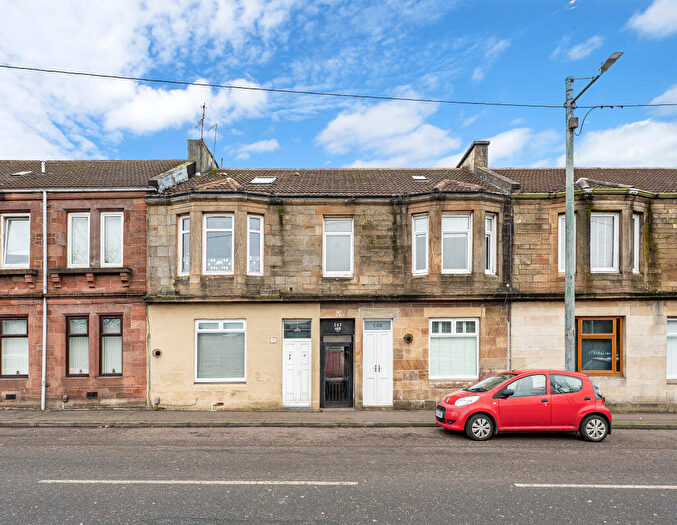
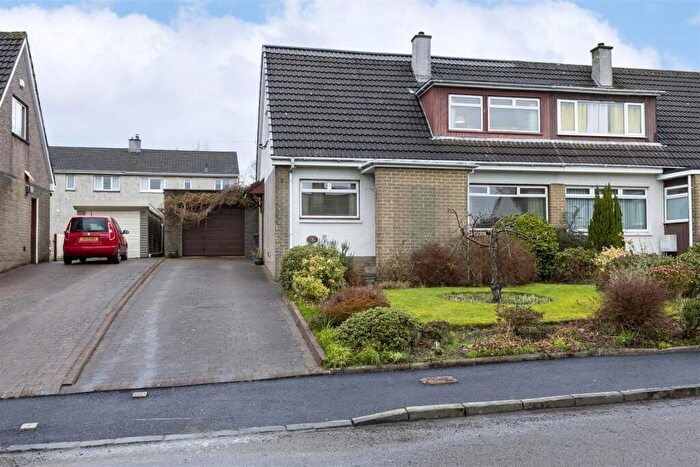
Houses for sale & to rent in East Dunbartonshire, Scotland
House Prices in East Dunbartonshire
Properties in East Dunbartonshire have
an average house price of
£290,736.00
and had 2,316 Property Transactions
within the last 3 years.¹
East Dunbartonshire is a location in
Scotland with
43,387 households², where the most expensive property was sold for £2,000,000.00.
Properties for sale in East Dunbartonshire
Towns in East Dunbartonshire
Navigate through our locations to find the location of your next house in East Dunbartonshire, Scotland for sale or to rent.
Transport in East Dunbartonshire
Please see below transportation links in this area:
- FAQ
- Price Paid By Year
Frequently asked questions about East Dunbartonshire
What is the average price for a property for sale in East Dunbartonshire?
The average price for a property for sale in East Dunbartonshire is £290,736. This amount is 44% higher than the average price in Scotland. There are more than 10,000 property listings for sale in East Dunbartonshire.
Which train stations are available in or near East Dunbartonshire?
Some of the train stations available in or near East Dunbartonshire are Bishopbriggs, Ashfield and Possilpark and Parkhouse.
Property Price Paid in East Dunbartonshire by Year
The average sold property price by year was:
| Year | Average Sold Price | Price Change |
Sold Properties
|
|---|---|---|---|
| 2025 | £292,428 | 1% |
667 Properties |
| 2024 | £289,526 | -0,3% |
778 Properties |
| 2023 | £290,521 | 1% |
871 Properties |
| 2022 | £288,150 | 6% |
1,622 Properties |
| 2021 | £271,348 | 5% |
1,866 Properties |
| 2020 | £256,781 | 0,4% |
1,662 Properties |
| 2019 | £255,778 | 3% |
2,079 Properties |
| 2018 | £247,191 | 5% |
1,860 Properties |
| 2017 | £236,043 | 6% |
2,069 Properties |
| 2016 | £221,876 | -0,3% |
1,965 Properties |
| 2015 | £222,531 | -0,4% |
1,980 Properties |
| 2014 | £223,386 | 5% |
2,040 Properties |
| 2013 | £213,236 | -2% |
1,731 Properties |
| 2012 | £217,702 | 4% |
1,564 Properties |
| 2011 | £209,611 | 5% |
1,300 Properties |
| 2010 | £199,938 | -2% |
1,304 Properties |
| 2009 | £202,956 | -4% |
1,268 Properties |
| 2008 | £211,251 | 7% |
1,589 Properties |
| 2007 | £196,548 | 7% |
2,330 Properties |
| 2006 | £182,190 | 1% |
2,237 Properties |
| 2005 | £180,134 | 14% |
2,293 Properties |
| 2004 | £154,043 | 18% |
2,142 Properties |
| 2003 | £125,562 | 15% |
2,463 Properties |
| 2002 | £107,313 | 17% |
2,174 Properties |
| 2001 | £89,204 | - |
167 Properties |

