
Houses for sale & to rent in Dunbar, East Lothian
House Prices in Dunbar
Properties in Dunbar have an average house price of £308k and had 311 Property Transactions within the last 3 years.¹
Dunbar is an area in East Lothian with 4,506 households², where the most expensive property was sold for £1.3M.
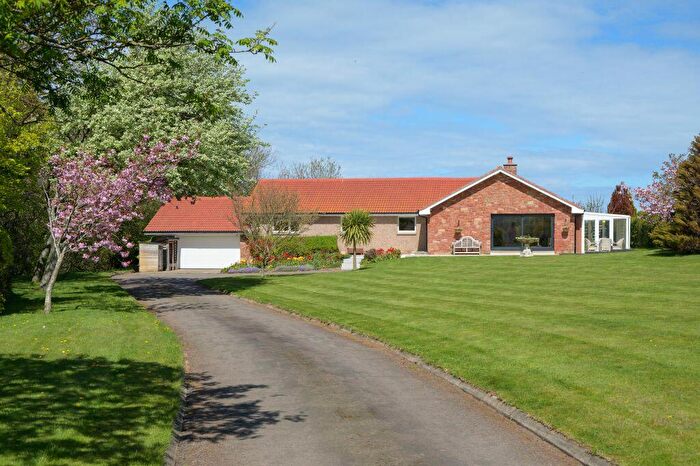
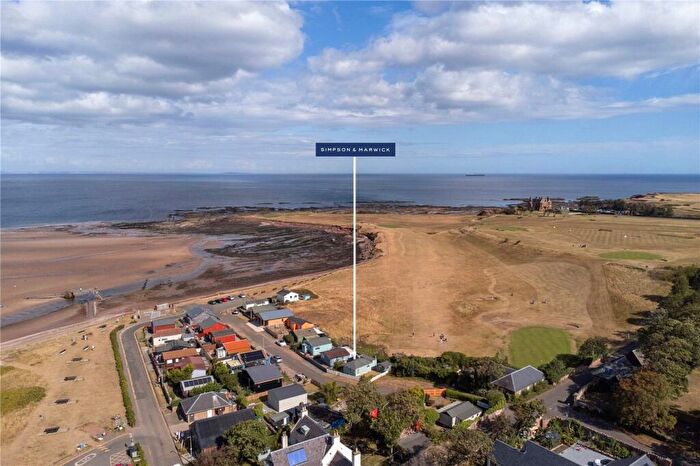
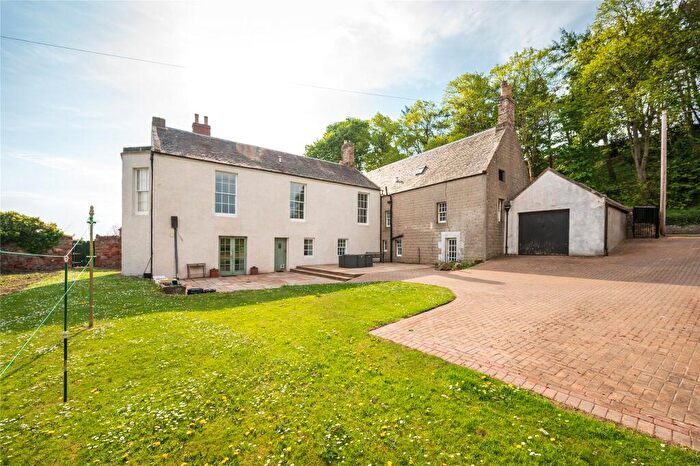
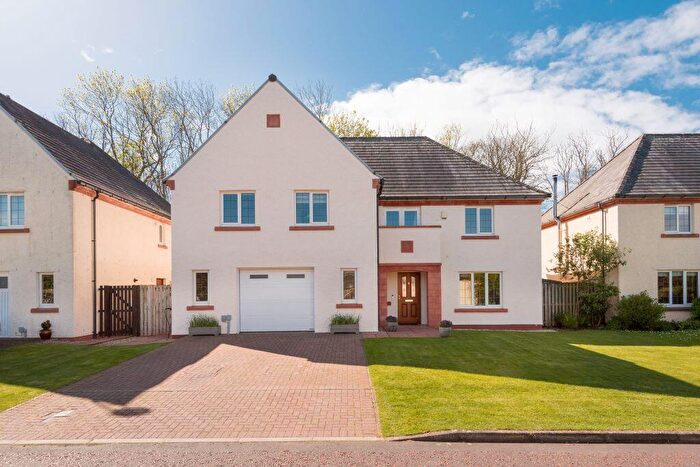
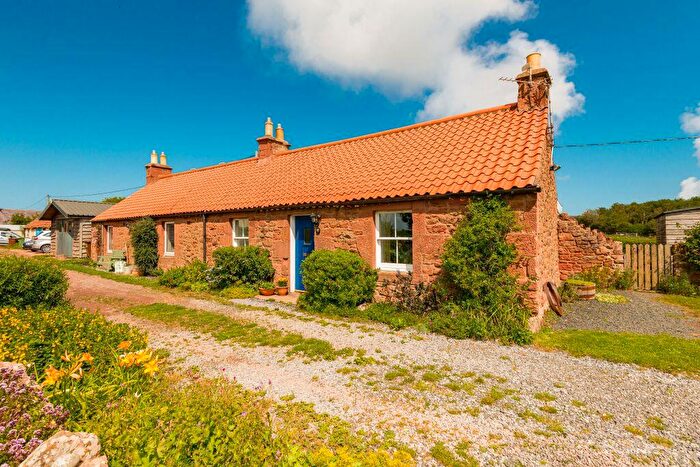
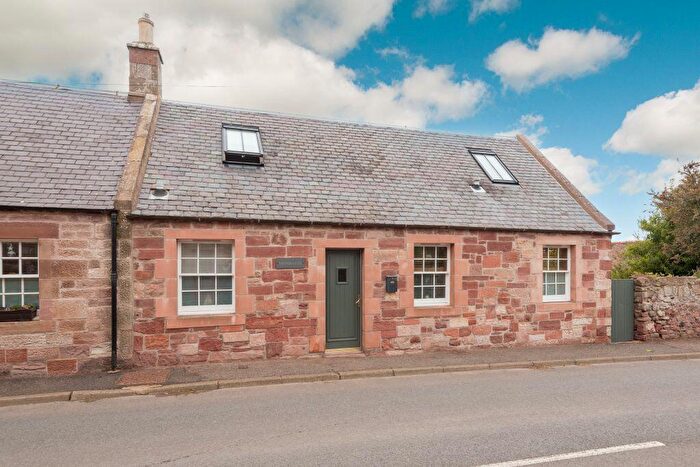
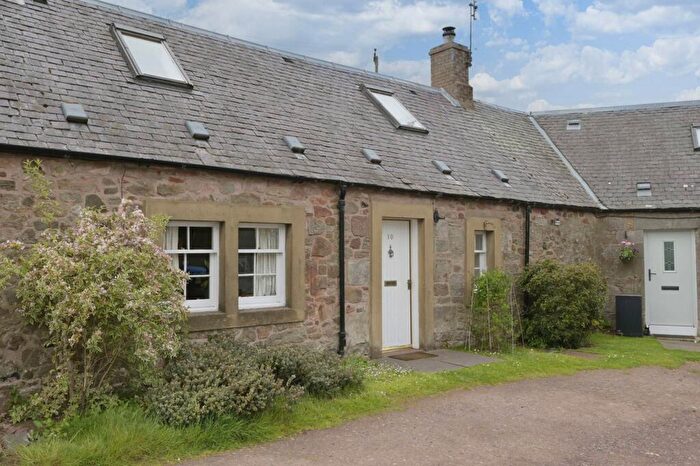
Properties for sale in Dunbar
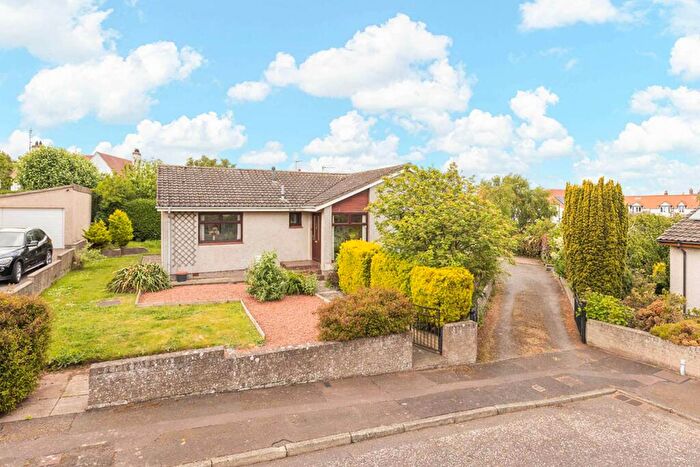
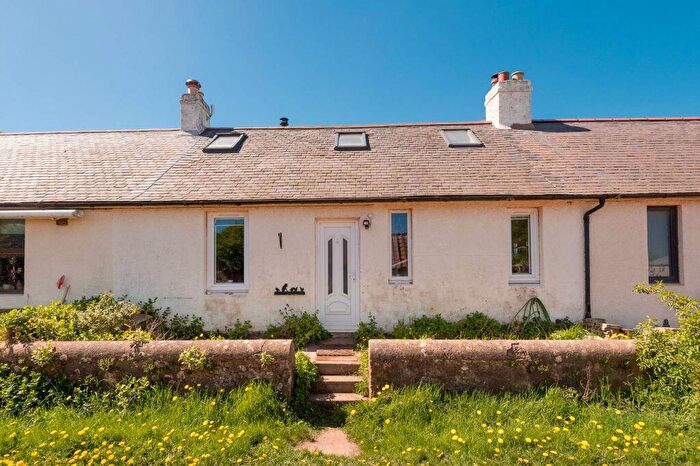
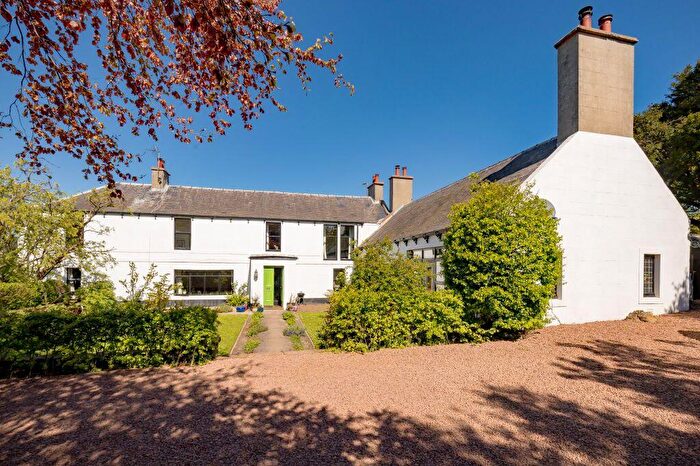
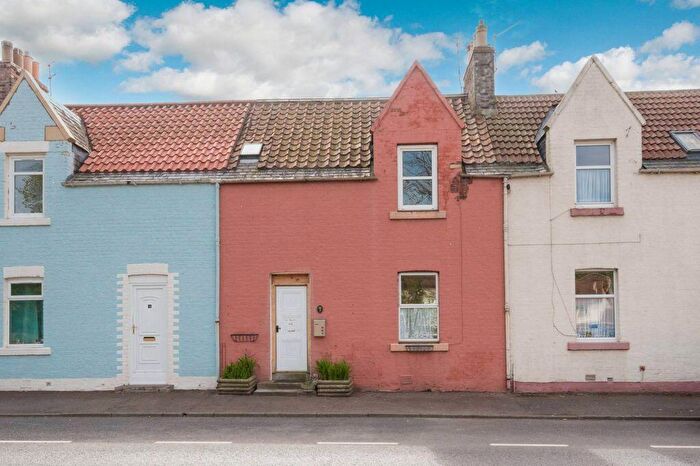
![]()
If you are looking to sell your house, let it out, or receive a property valuation, an expert can help you.
Click the button below to get started.
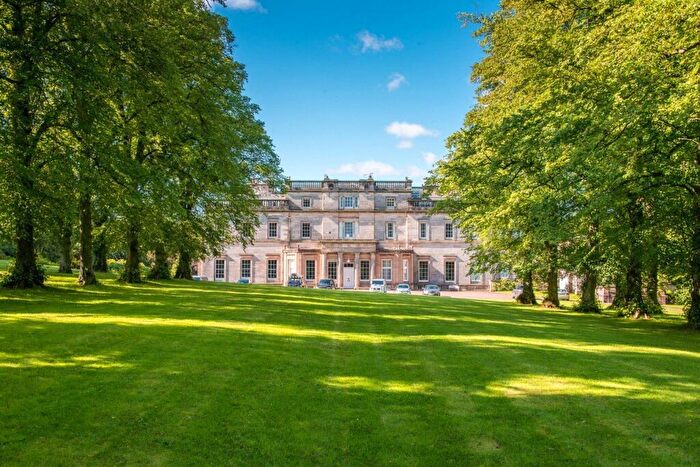
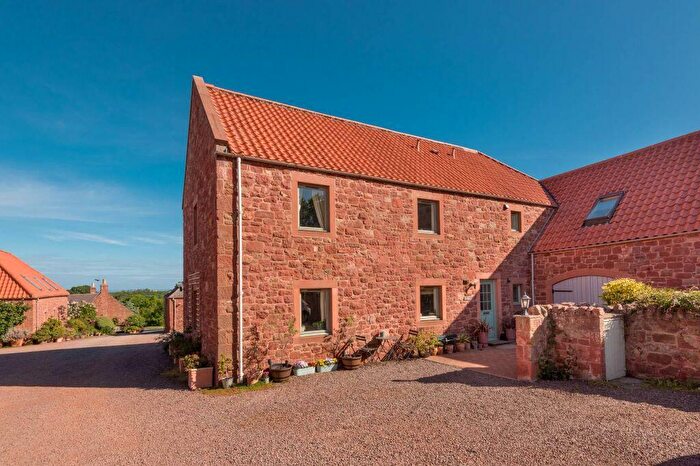
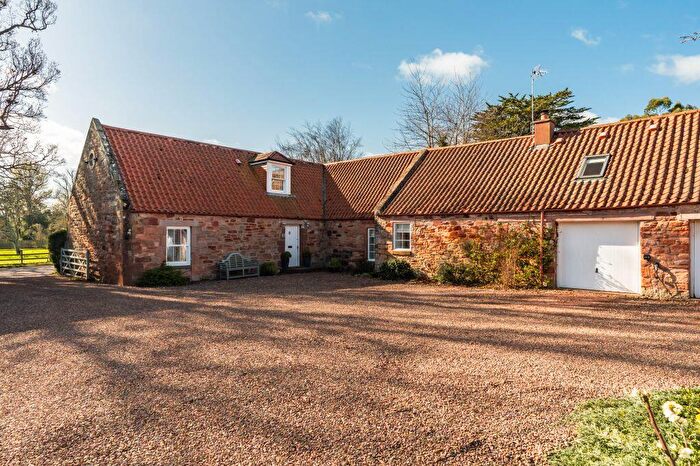
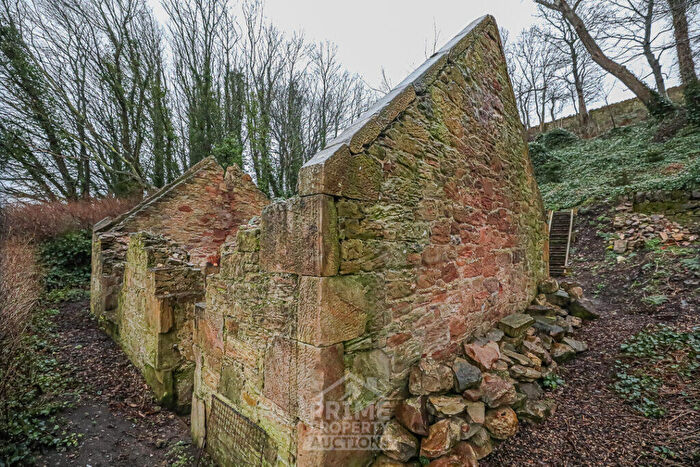
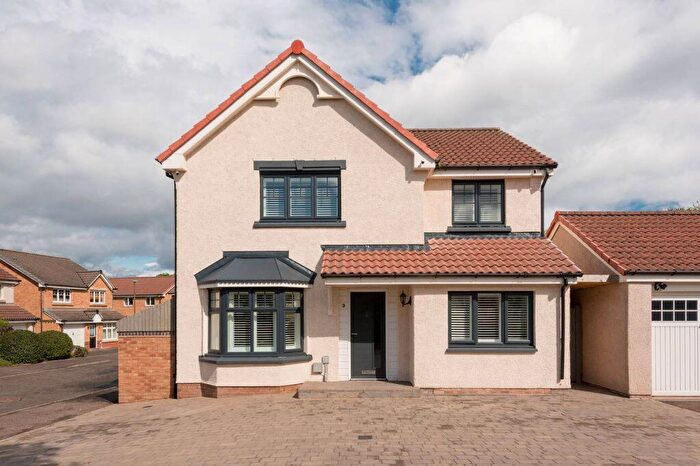
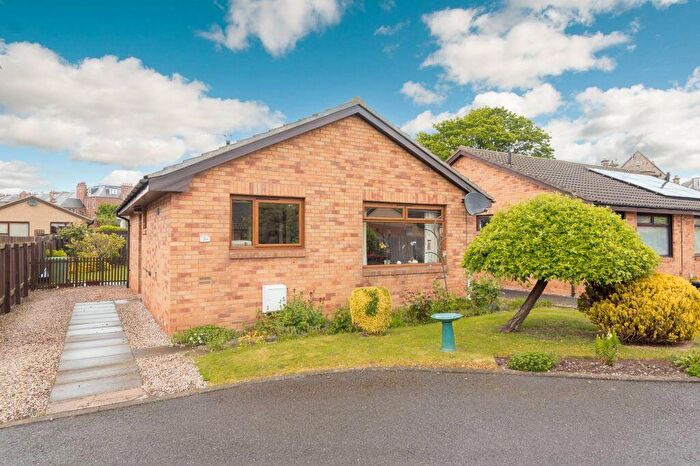
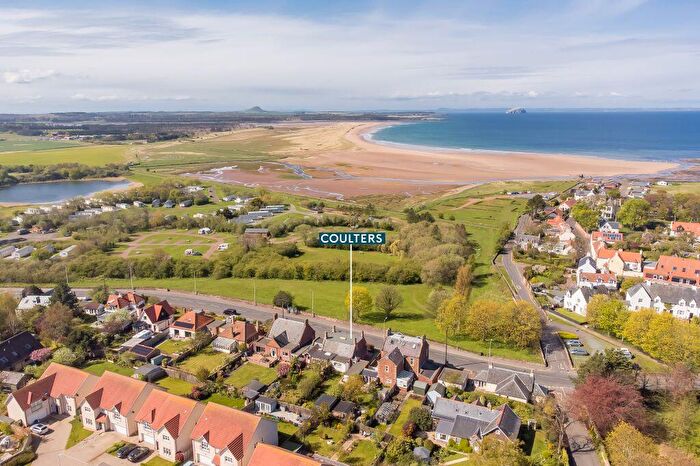
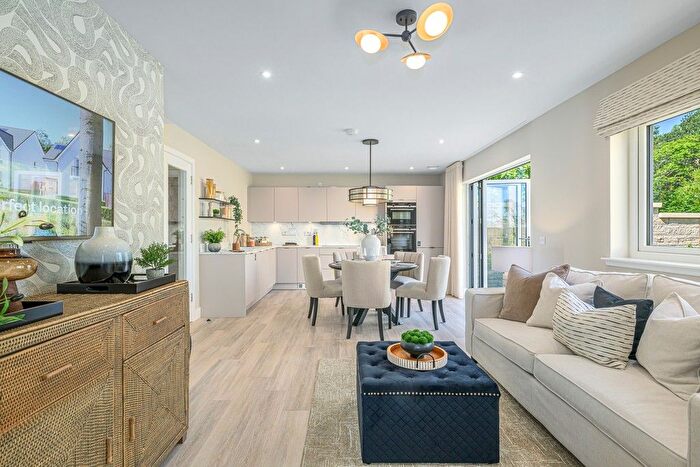
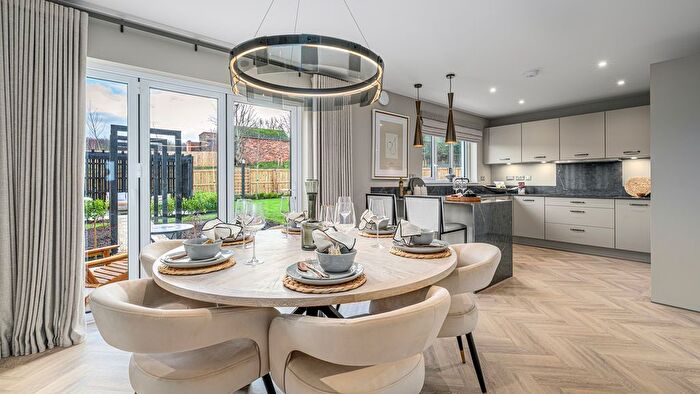
Previously listed properties in Dunbar
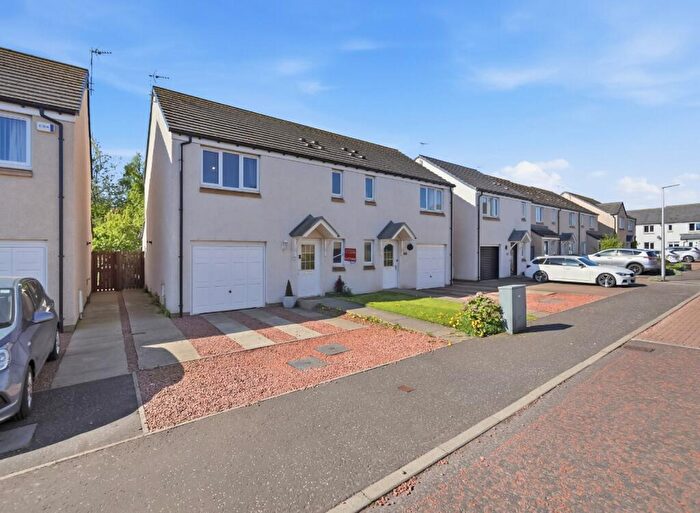
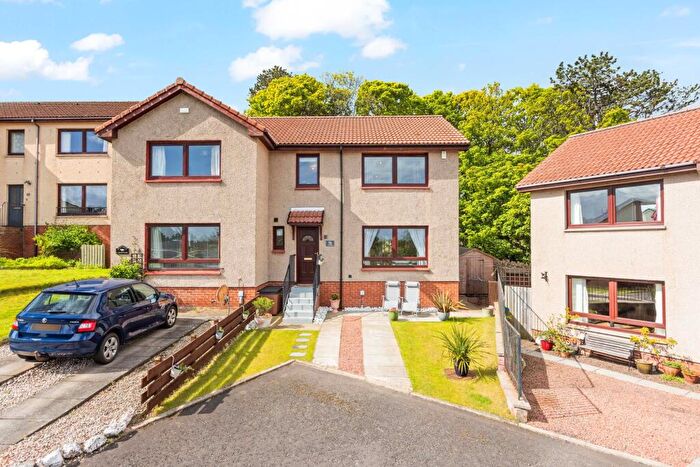
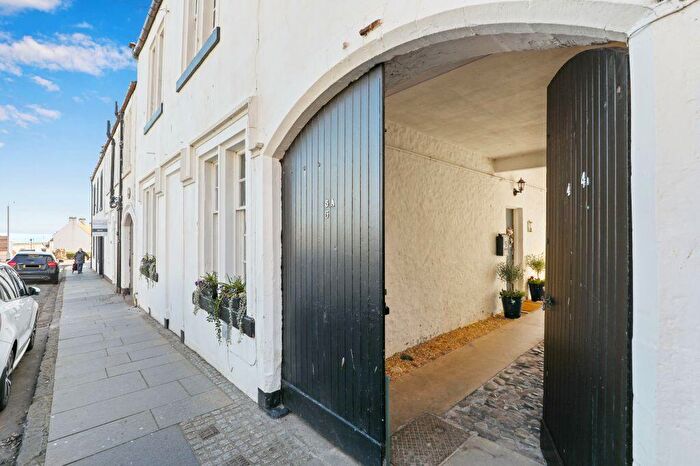
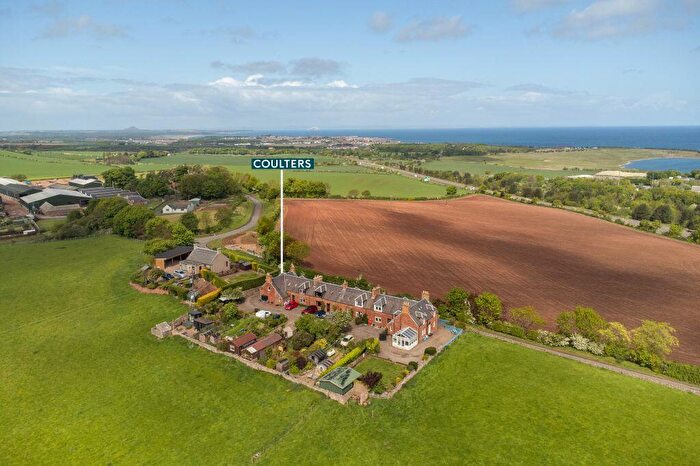
![]()
If you are looking to sell your house, let it out, or receive a property valuation, an expert can help you.
Click the button below to get started.
Neighbourhoods in Dunbar
Navigate through our locations to find the location of your next house in Dunbar, East Lothian for sale or to rent.
Transport in Dunbar
Please see below transportation links in this area:

- FAQ
- Price Paid By Year
Frequently asked questions about Dunbar
What is the average price for a property for sale in Dunbar?
The average price for a property for sale in Dunbar is £307,580. This amount is 7% higher than the average price in East Lothian. There are 597 property listings for sale in Dunbar.
What locations have the most expensive properties for sale in Dunbar?
The location with the most expensive properties for sale in Dunbar is North Berwick Coastal at an average of £820,000.
What locations have the most affordable properties for sale in Dunbar?
The location with the most affordable properties for sale in Dunbar is Dunbar and East Linton at an average of £305,927.
Which train stations are available in or near Dunbar?
Some of the train stations available in or near Dunbar are Dunbar, North Berwick and Drem.
Property Price Paid in Dunbar by Year
The average sold property price by year was:
| Year | Average Sold Price | Price Change |
Sold Properties
|
|---|---|---|---|
| 2025 | £317,786 | 12% |
102 Properties |
| 2024 | £280,777 | -13% |
84 Properties |
| 2023 | £317,265 | -3% |
125 Properties |
| 2022 | £325,303 | 9% |
191 Properties |
| 2021 | £295,239 | 4% |
249 Properties |
| 2020 | £282,097 | 9% |
290 Properties |
| 2019 | £256,501 | 1% |
309 Properties |
| 2018 | £254,266 | 11% |
341 Properties |
| 2017 | £225,085 | 9% |
335 Properties |
| 2016 | £203,840 | -2% |
313 Properties |
| 2015 | £207,518 | -0,1% |
259 Properties |
| 2014 | £207,768 | 5% |
214 Properties |
| 2013 | £196,874 | 4% |
184 Properties |
| 2012 | £188,184 | 2% |
161 Properties |
| 2011 | £184,290 | -18% |
145 Properties |
| 2010 | £218,268 | 20% |
137 Properties |
| 2009 | £175,035 | -2% |
154 Properties |
| 2008 | £178,932 | -23% |
176 Properties |
| 2007 | £220,111 | 6% |
247 Properties |
| 2006 | £206,444 | -1157,9% |
287 Properties |
| 2005 | £2,596,915 | 94% |
305 Properties |
| 2004 | £144,607 | 2% |
294 Properties |
| 2003 | £141,680 | 27% |
387 Properties |
| 2002 | £104,070 | -63% |
428 Properties |
| 2001 | £169,773 | - |
56 Properties |