
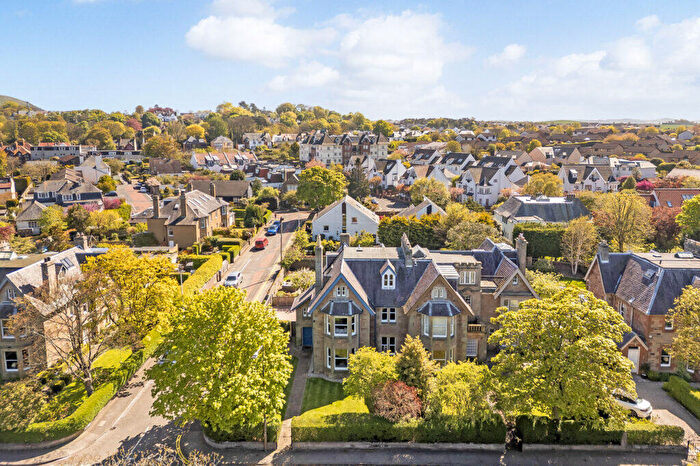
Houses for sale & to rent in North Berwick, East Lothian
House Prices in North Berwick
Properties in North Berwick have an average house price of £481k and had 227 Property Transactions within the last 3 years.¹
North Berwick is an area in East Lothian with 3,863 households², where the most expensive property was sold for £2.5M.
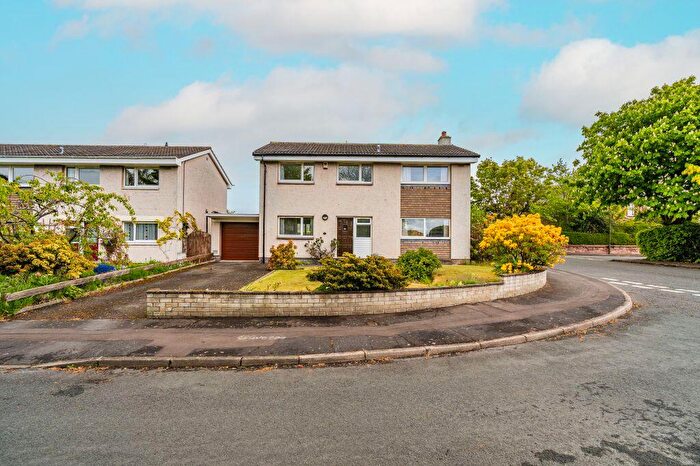
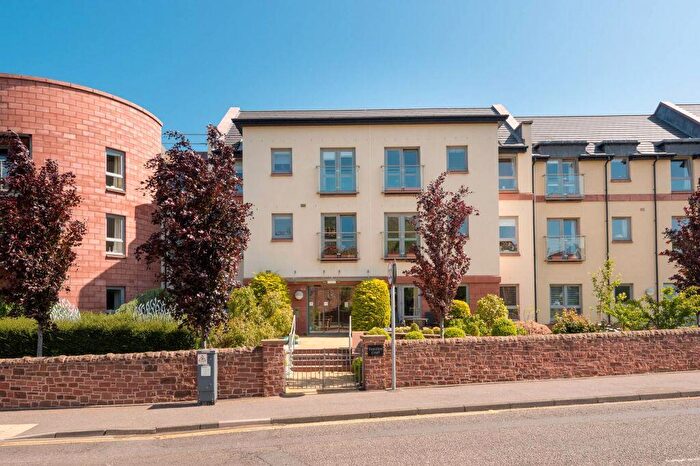
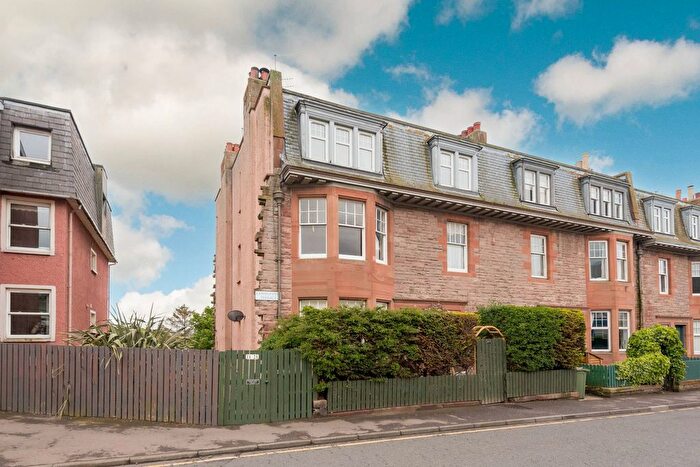
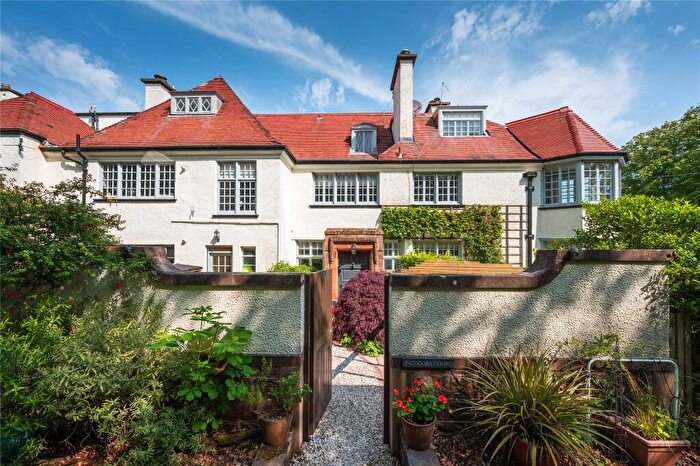
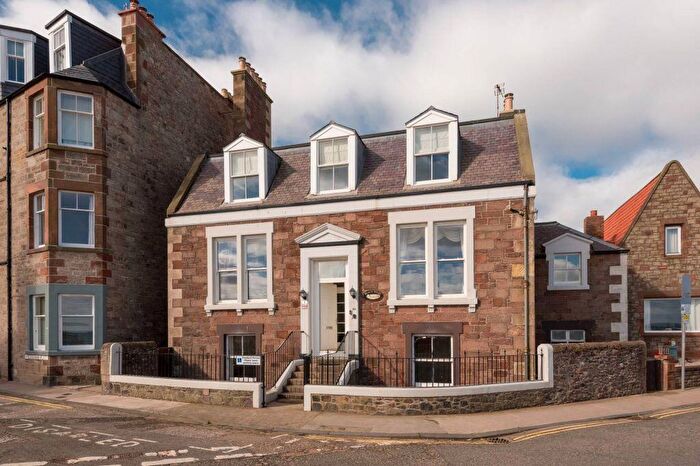
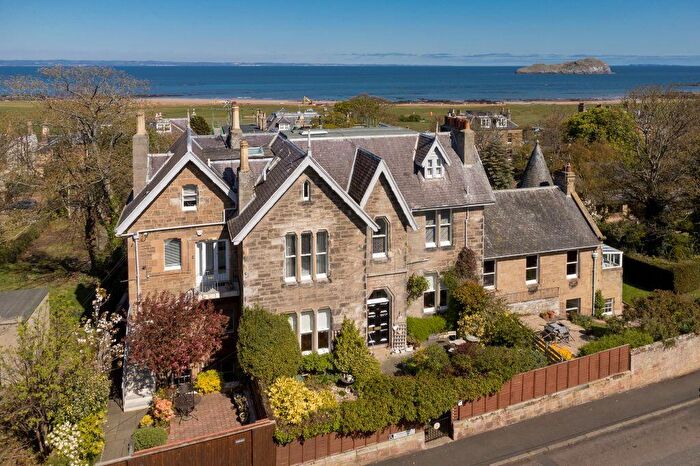
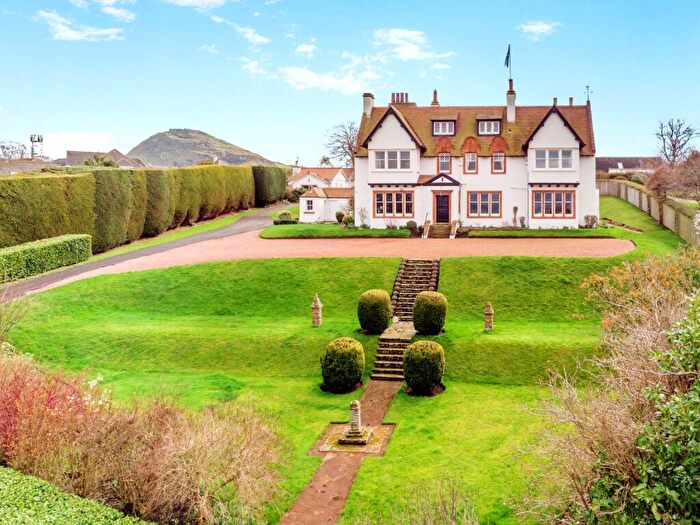
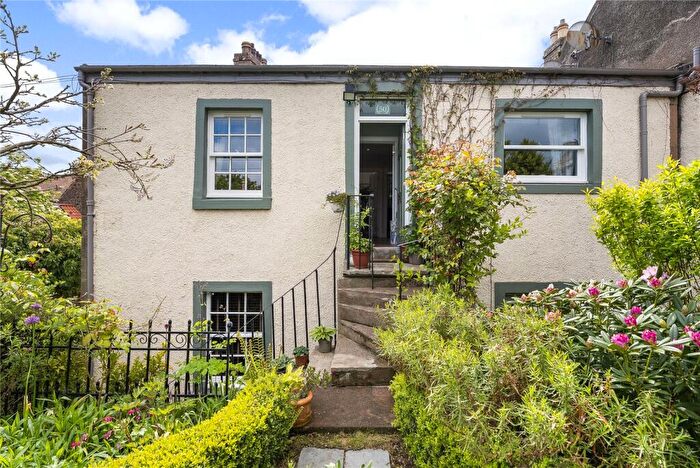
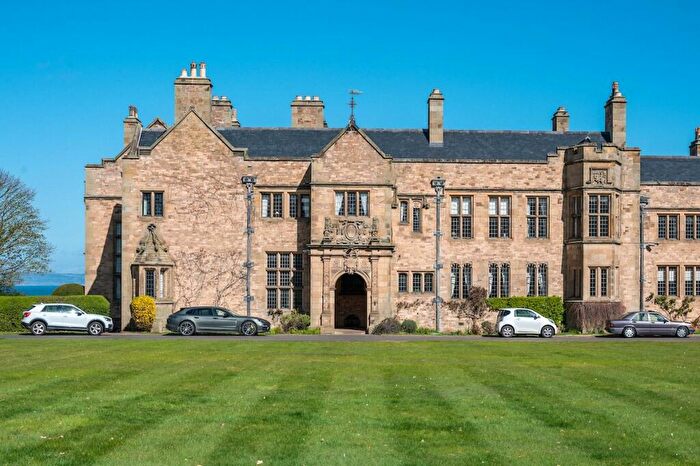
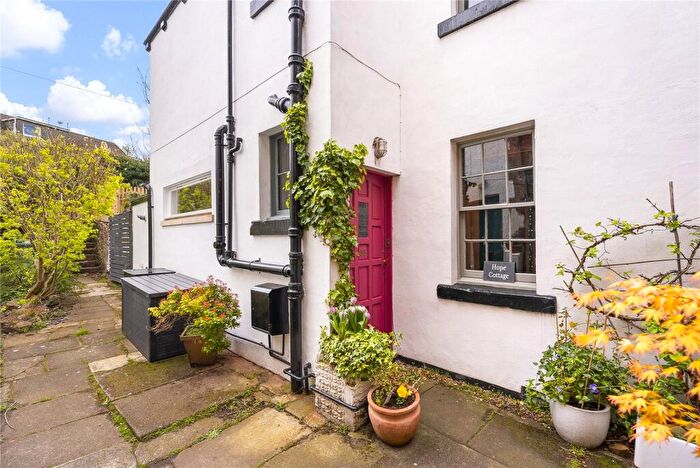
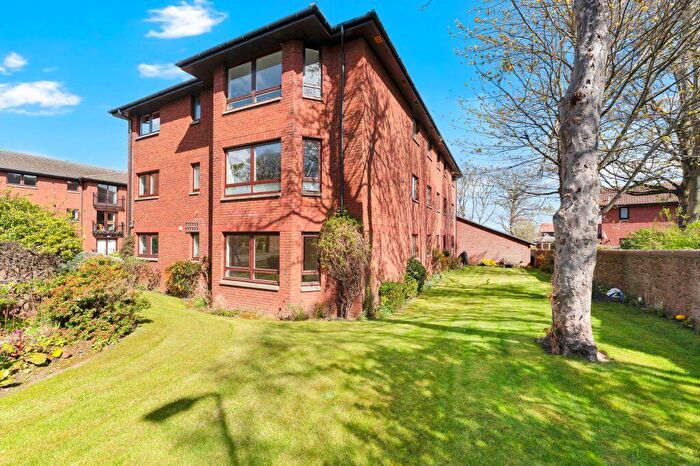
Properties for sale in North Berwick
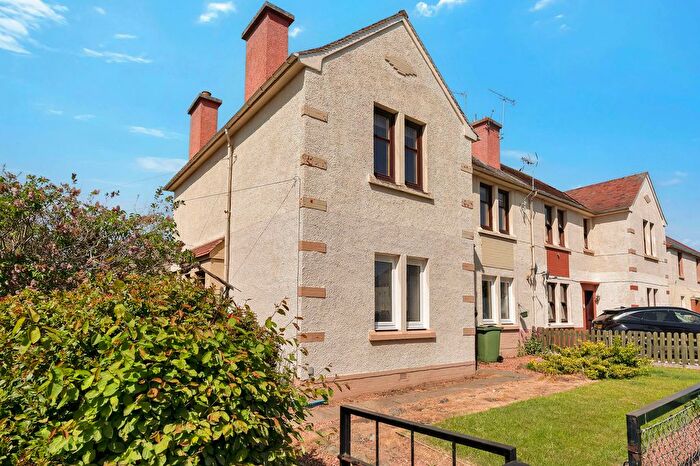
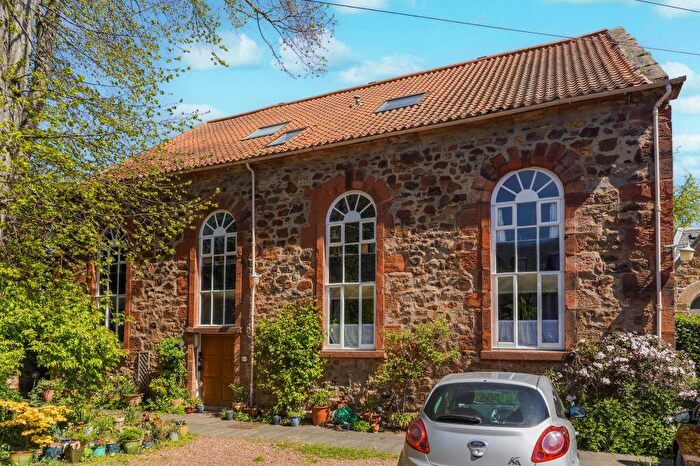
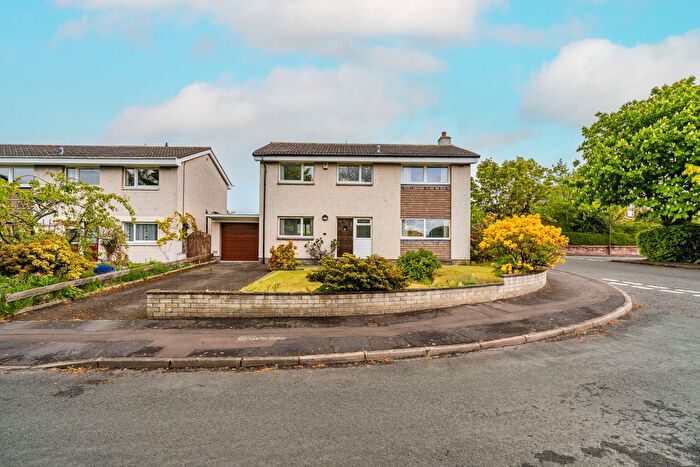
![]()
If you are looking to sell your house, let it out, or receive a property valuation, an expert can help you.
Click the button below to get started.

Neighbourhoods in North Berwick
Navigate through our locations to find the location of your next house in North Berwick, East Lothian for sale or to rent.
Transport in North Berwick
Please see below transportation links in this area:

- FAQ
- Price Paid By Year
Frequently asked questions about North Berwick
What is the average price for a property for sale in North Berwick?
The average price for a property for sale in North Berwick is £481,405. This amount is 68% higher than the average price in East Lothian. There are 892 property listings for sale in North Berwick.
What locations have the most expensive properties for sale in North Berwick?
The location with the most expensive properties for sale in North Berwick is North Berwick Coastal at an average of £482,761.
What locations have the most affordable properties for sale in North Berwick?
The location with the most affordable properties for sale in North Berwick is Haddington and Lammermuir at an average of £175,000.
Which train stations are available in or near North Berwick?
Some of the train stations available in or near North Berwick are North Berwick, Drem and Longniddry.
Property Price Paid in North Berwick by Year
The average sold property price by year was:
| Year | Average Sold Price | Price Change |
Sold Properties
|
|---|---|---|---|
| 2025 | £470,228 | -3% |
83 Properties |
| 2024 | £484,178 | -1% |
59 Properties |
| 2023 | £490,395 | 0,4% |
85 Properties |
| 2022 | £488,404 | 2% |
162 Properties |
| 2021 | £478,153 | 8% |
245 Properties |
| 2020 | £441,593 | 6% |
221 Properties |
| 2019 | £417,102 | 9% |
314 Properties |
| 2018 | £379,138 | -1% |
280 Properties |
| 2017 | £382,589 | 7% |
289 Properties |
| 2016 | £355,291 | -14% |
253 Properties |
| 2015 | £406,239 | 15% |
237 Properties |
| 2014 | £344,537 | 7% |
223 Properties |
| 2013 | £319,463 | -12% |
193 Properties |
| 2012 | £357,879 | 5% |
194 Properties |
| 2011 | £339,346 | -1% |
170 Properties |
| 2010 | £341,140 | 8% |
193 Properties |
| 2009 | £314,830 | 1% |
155 Properties |
| 2008 | £311,085 | -3% |
182 Properties |
| 2007 | £319,725 | 20% |
253 Properties |
| 2006 | £254,415 | 5% |
259 Properties |
| 2005 | £241,270 | 10% |
221 Properties |
| 2004 | £217,446 | 18% |
208 Properties |
| 2003 | £178,975 | 18% |
251 Properties |
| 2002 | £146,369 | 18% |
271 Properties |
| 2001 | £119,384 | - |
21 Properties |