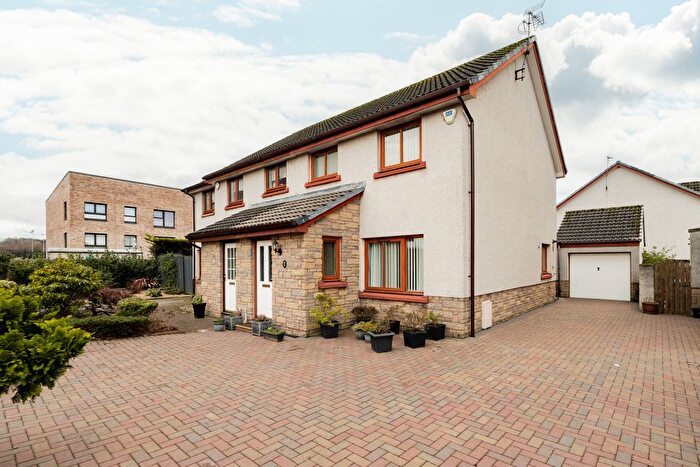
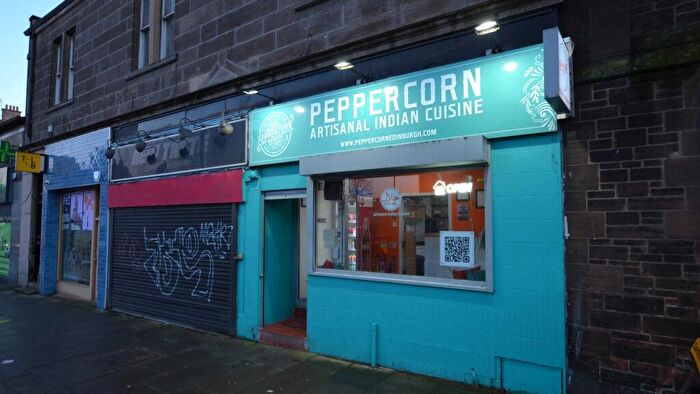
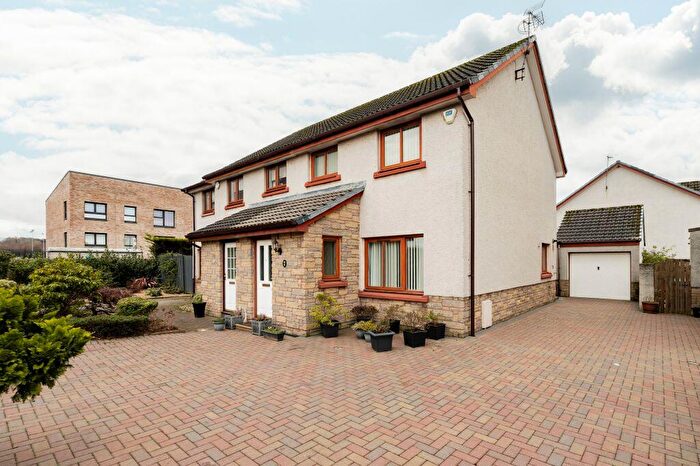
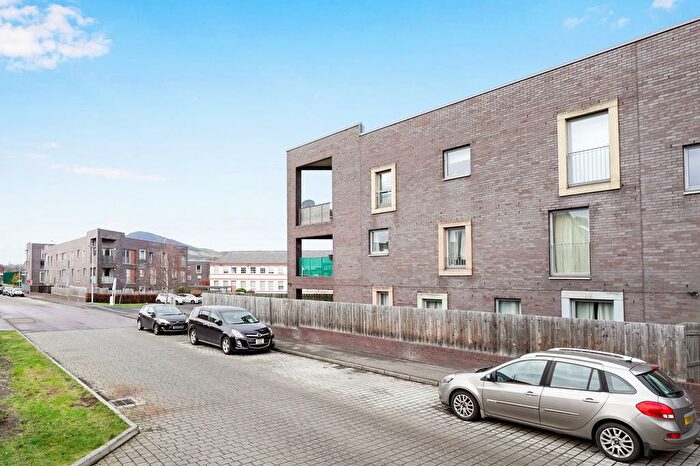
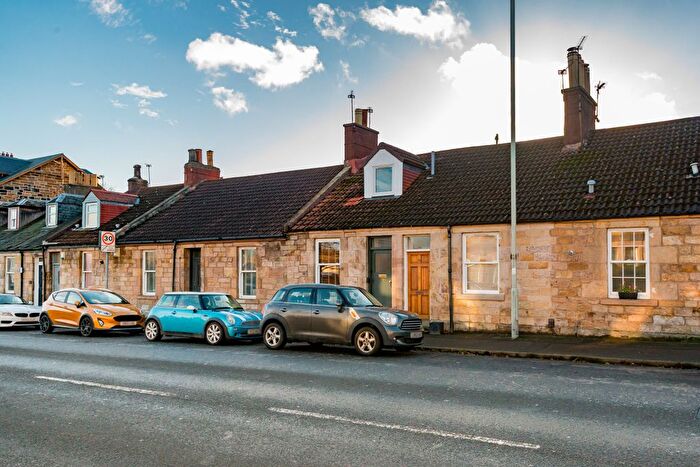
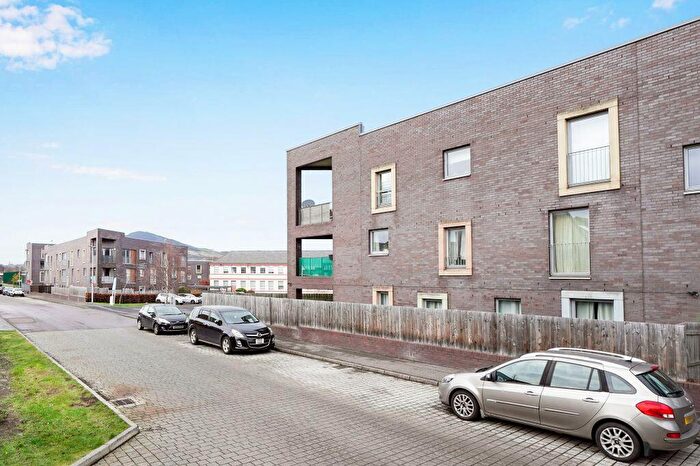
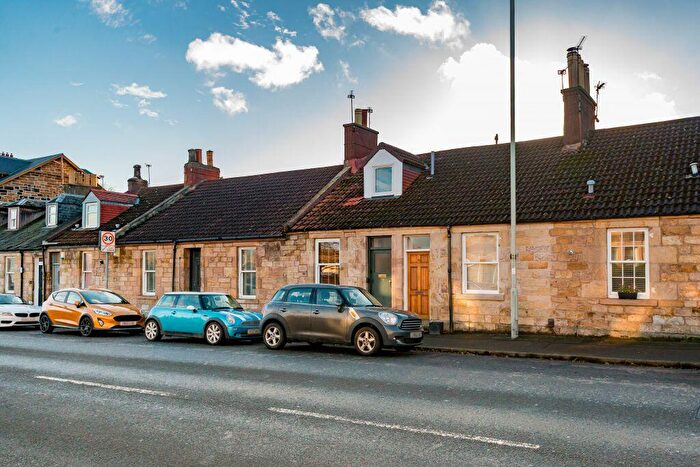
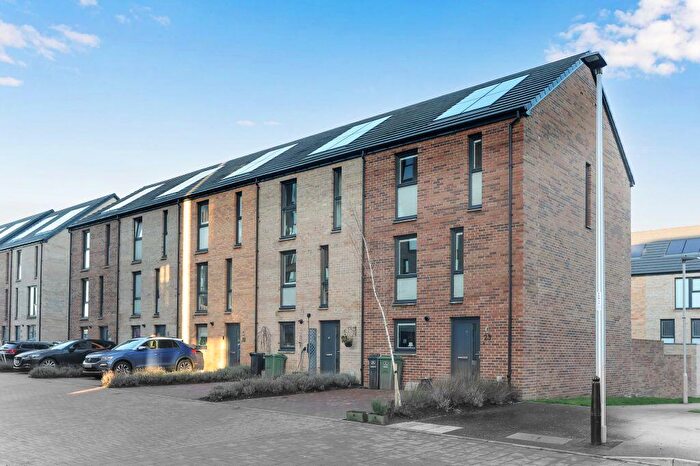
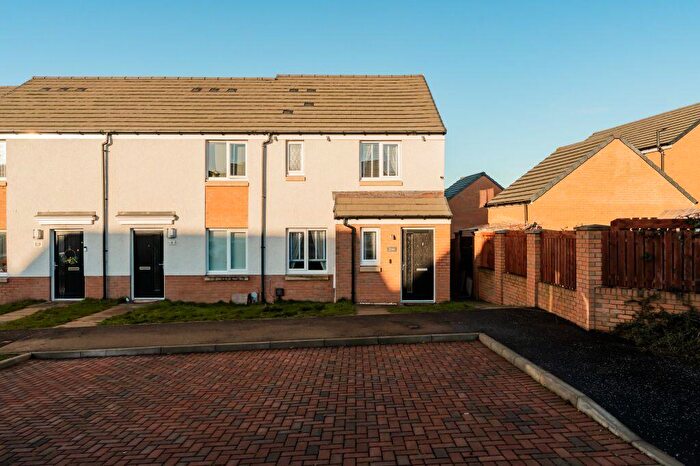
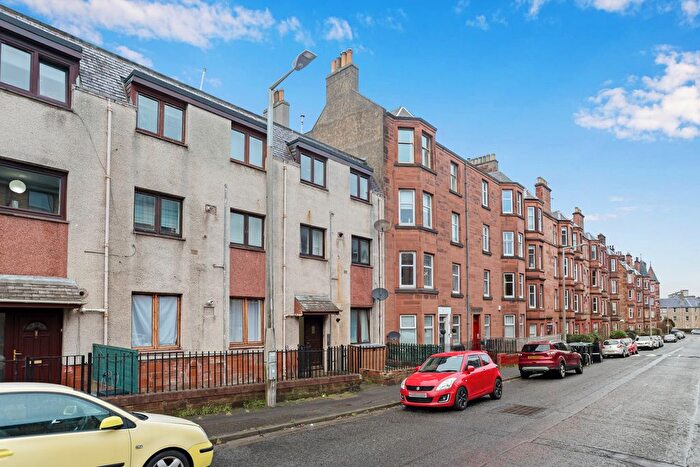
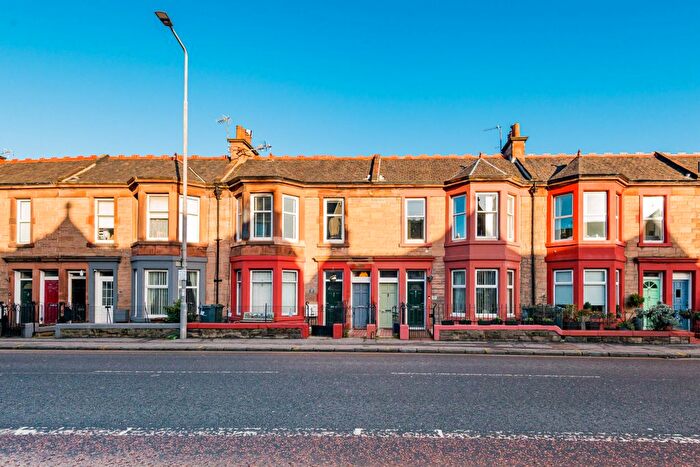
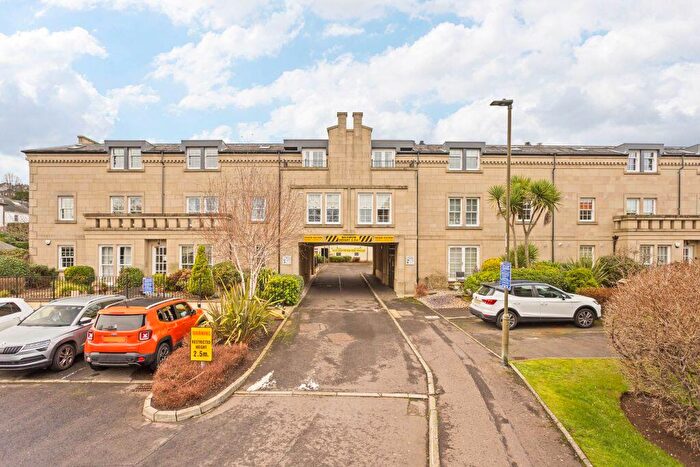
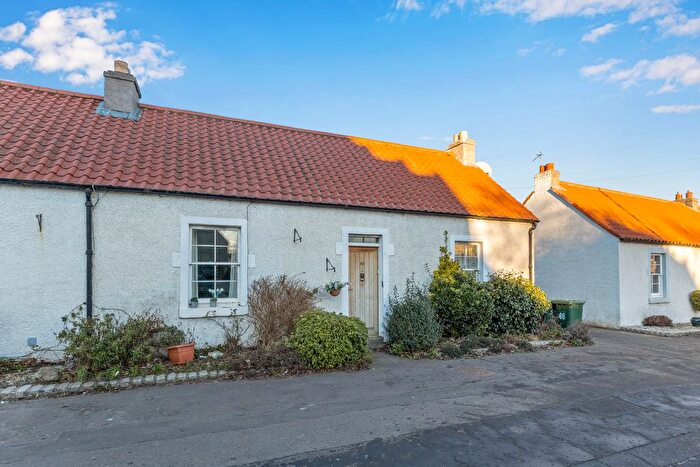
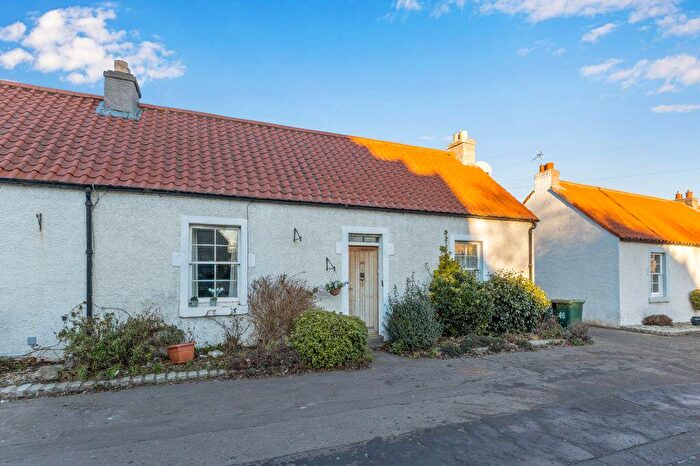
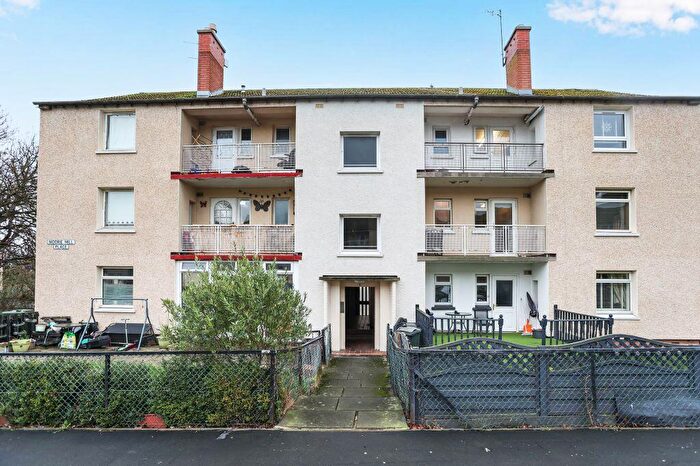
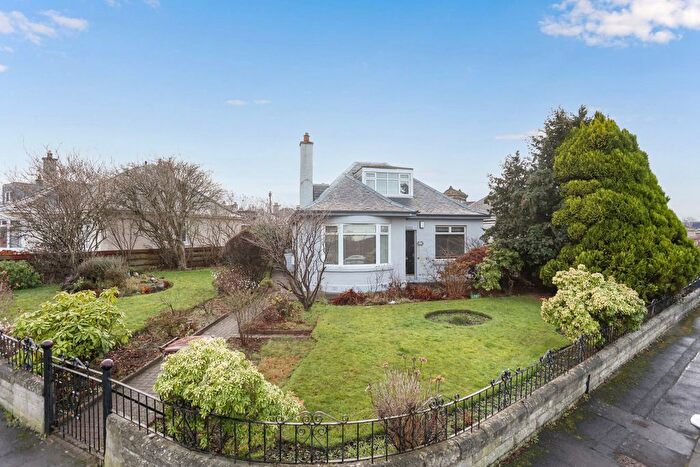
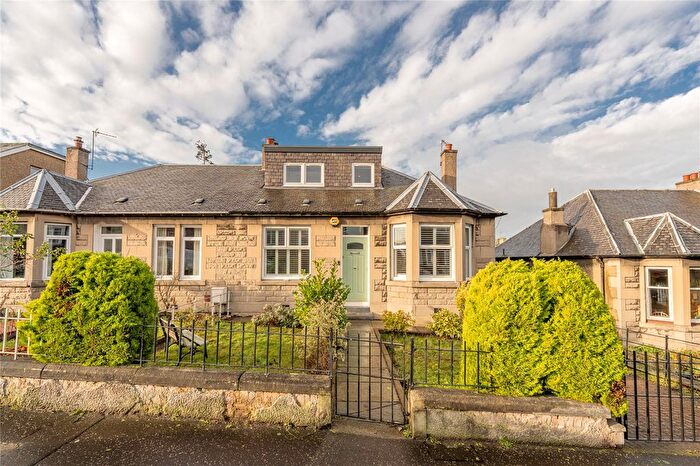
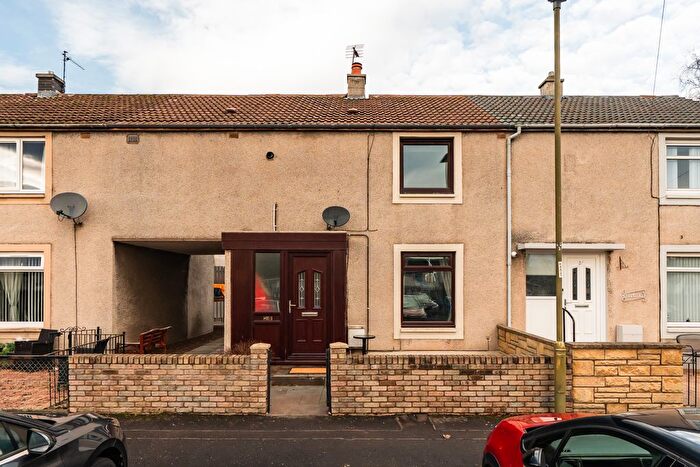
Houses for sale & to rent in Portobello/Craigmillar, Edinburgh
House Prices in Portobello/Craigmillar
Properties in Portobello/Craigmillar have an average house price of £285,077.00 and had 776 Property Transactions within the last 3 years¹.
Portobello/Craigmillar is an area in Edinburgh, City of Edinburgh with 12,067 households², where the most expensive property was sold for £1,191,300.00.
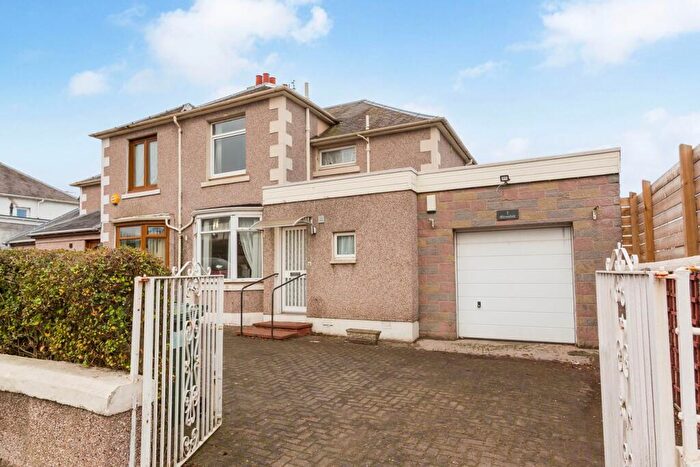
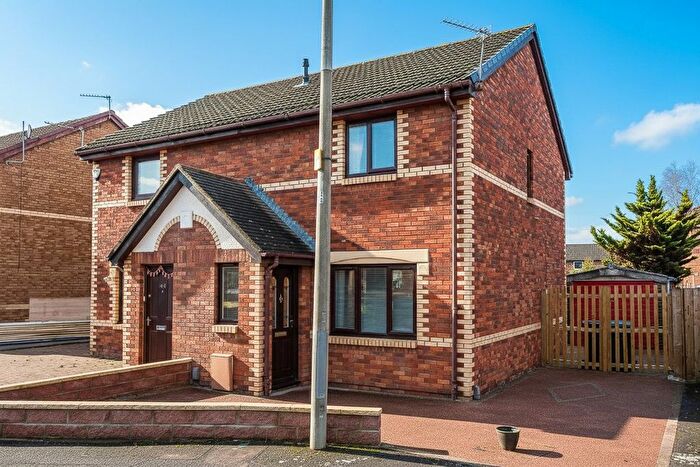
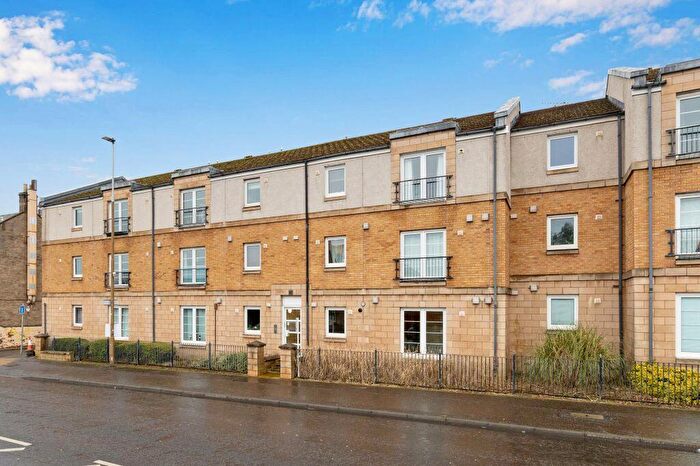
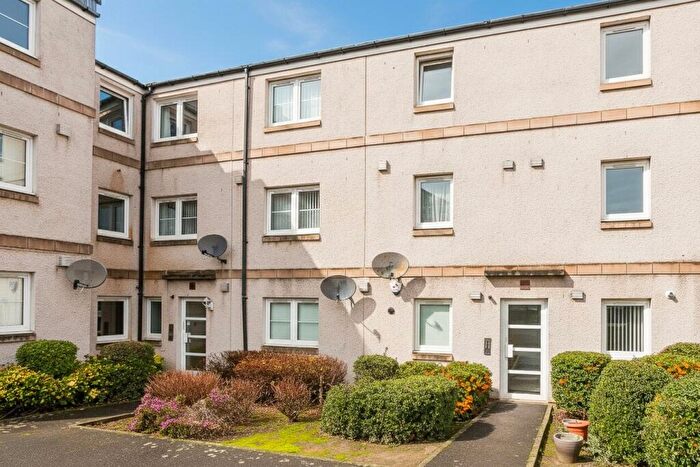
Properties for sale in Portobello/Craigmillar
Roads and Postcodes in Portobello/Craigmillar
Navigate through our locations to find the location of your next house in Portobello/Craigmillar, Edinburgh for sale or to rent.
Transport near Portobello/Craigmillar
- FAQ
- Price Paid By Year
Frequently asked questions about Portobello/Craigmillar
What is the average price for a property for sale in Portobello/Craigmillar?
The average price for a property for sale in Portobello/Craigmillar is £285,077. This amount is 15% lower than the average price in Edinburgh. There are 3,936 property listings for sale in Portobello/Craigmillar.
Which train stations are available in or near Portobello/Craigmillar?
Some of the train stations available in or near Portobello/Craigmillar are Brunstane, Newcraighall and Musselburgh.
Property Price Paid in Portobello/Craigmillar by Year
The average sold property price by year was:
| Year | Average Sold Price | Price Change |
Sold Properties
|
|---|---|---|---|
| 2023 | £286,447 | 1% |
131 Properties |
| 2022 | £284,799 | 7% |
645 Properties |
| 2021 | £265,616 | 5% |
679 Properties |
| 2020 | £253,389 | 9% |
628 Properties |
| 2019 | £231,098 | 3% |
795 Properties |
| 2018 | £224,322 | 4% |
677 Properties |
| 2017 | £214,291 | 7% |
716 Properties |
| 2016 | £199,687 | -8% |
667 Properties |
| 2015 | £215,229 | 0,5% |
603 Properties |
| 2014 | £214,216 | 15% |
463 Properties |
| 2013 | £182,030 | -2% |
378 Properties |
| 2012 | £185,207 | -1% |
340 Properties |
| 2011 | £187,631 | 6% |
322 Properties |
| 2010 | £177,063 | -15% |
313 Properties |
| 2009 | £203,167 | -4% |
329 Properties |
| 2008 | £211,577 | -233% |
440 Properties |
| 2007 | £705,415 | 69% |
639 Properties |
| 2006 | £216,205 | 24% |
651 Properties |
| 2005 | £163,843 | 15% |
566 Properties |
| 2004 | £138,486 | -11% |
672 Properties |
| 2003 | £154,049 | 31% |
670 Properties |
| 2002 | £106,405 | -0,3% |
697 Properties |
| 2001 | £106,692 | -2% |
70 Properties |
| 2000 | £108,302 | - |
37 Properties |

