
Houses for sale & to rent in G52 1TG, Corkerhill Road, Cardonald, Glasgow
House Prices in G52 1TG, Corkerhill Road, Cardonald
Properties in G52 1TG have an average house price of £140,000.00 and had 1 Property Transaction within the last 3 years.¹ G52 1TG is a postcode in Corkerhill Road located in Cardonald, an area in Glasgow, Glasgow City, with 2 households², where the most expensive property was sold for £140,000.00.
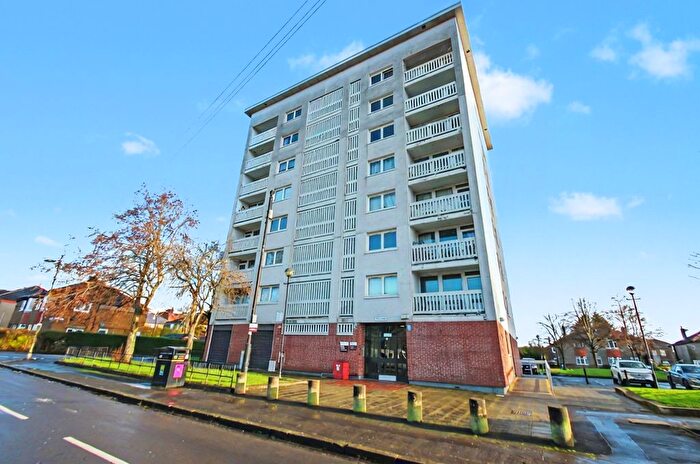
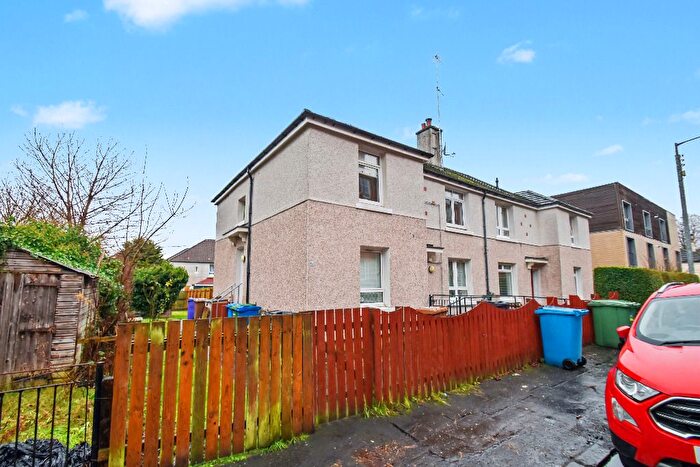
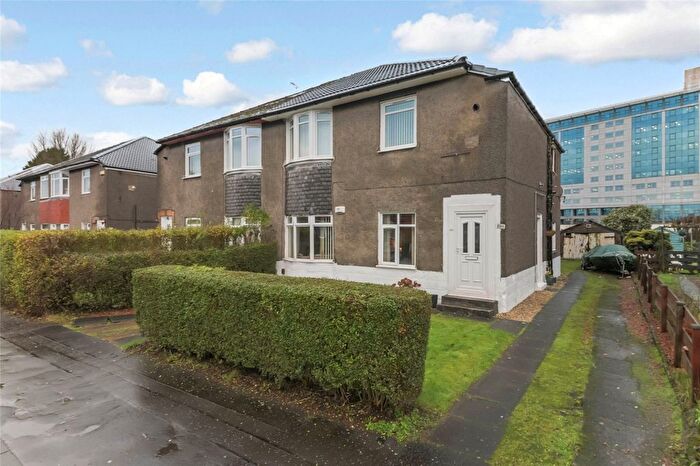
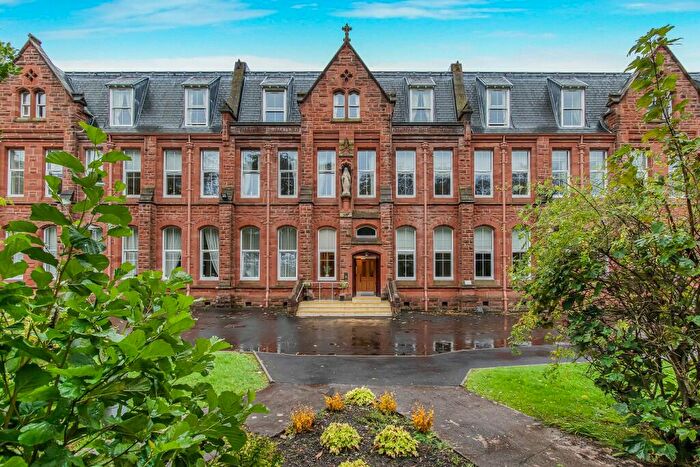
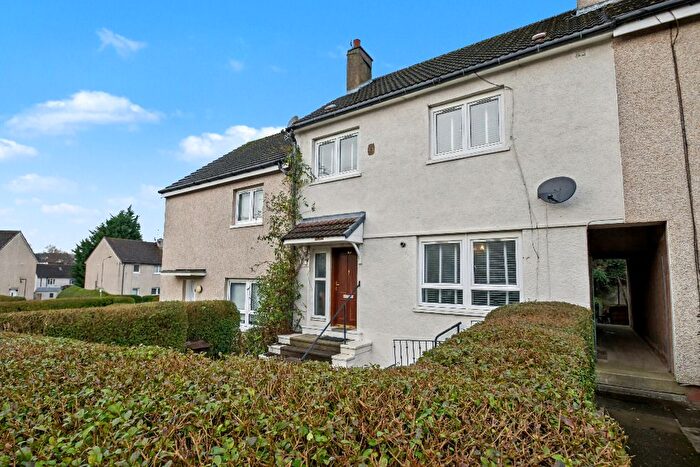
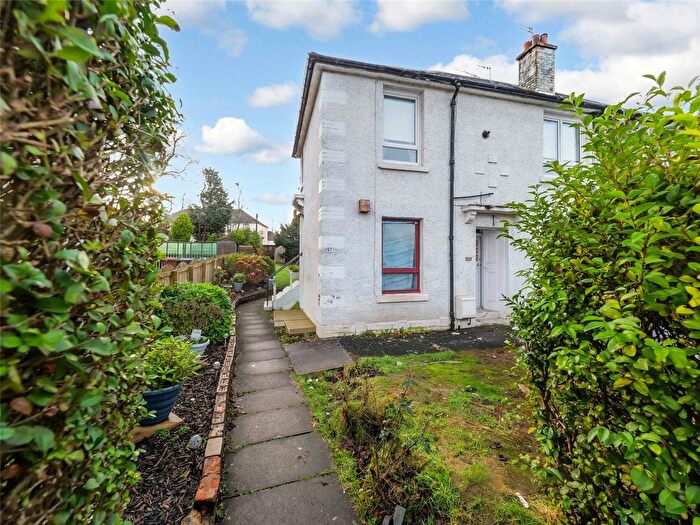
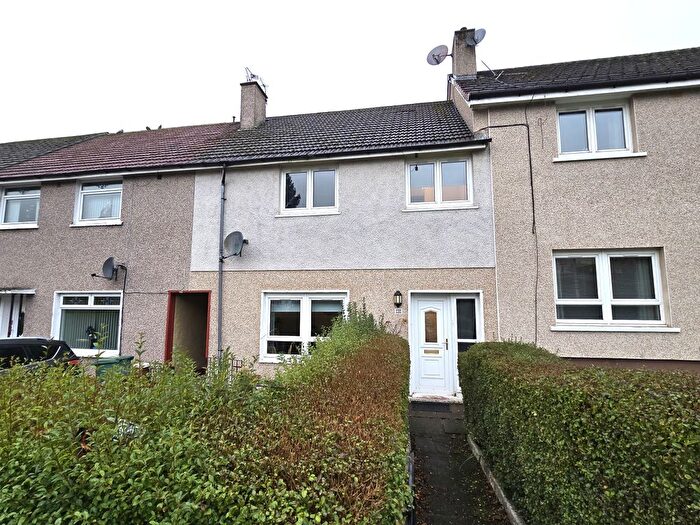
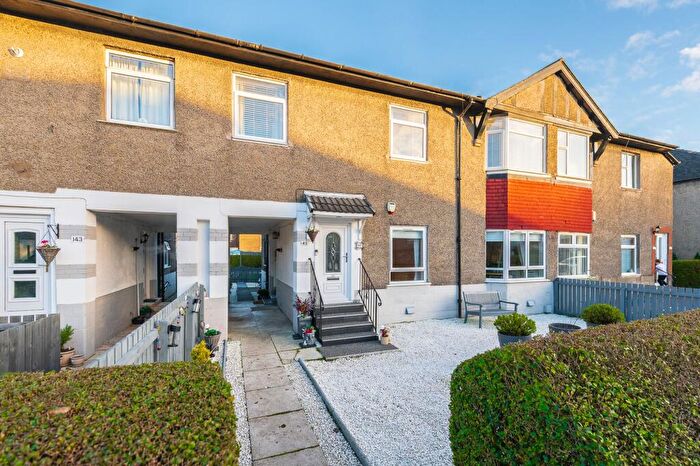
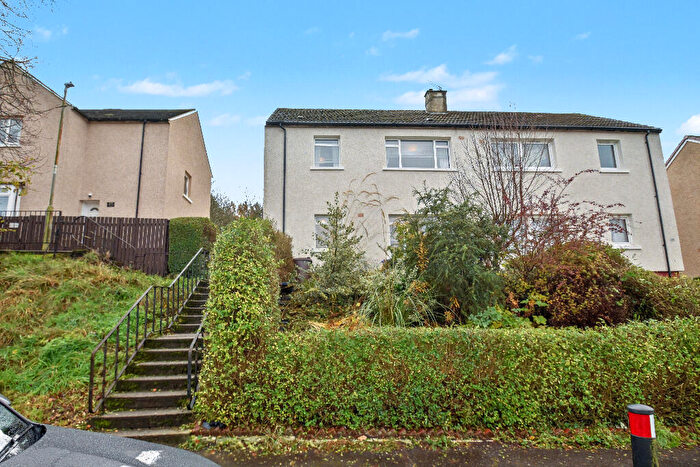
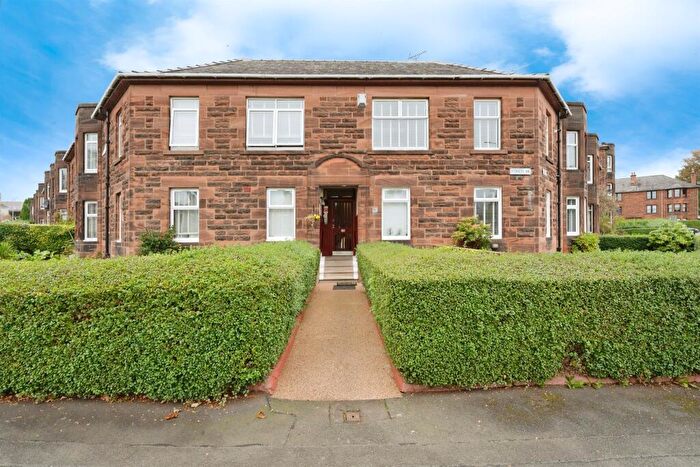
Properties for sale near G52 1TG, Corkerhill Road

![]()
If you are looking to sell your house, let it out, or receive a property valuation, an expert can help you.
Click the button below to get started.

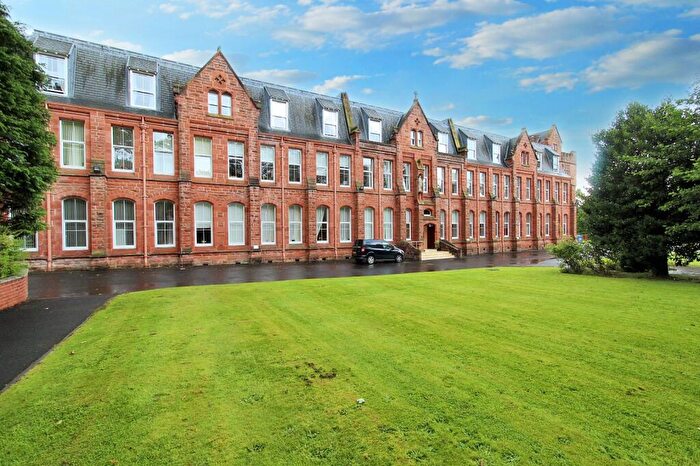

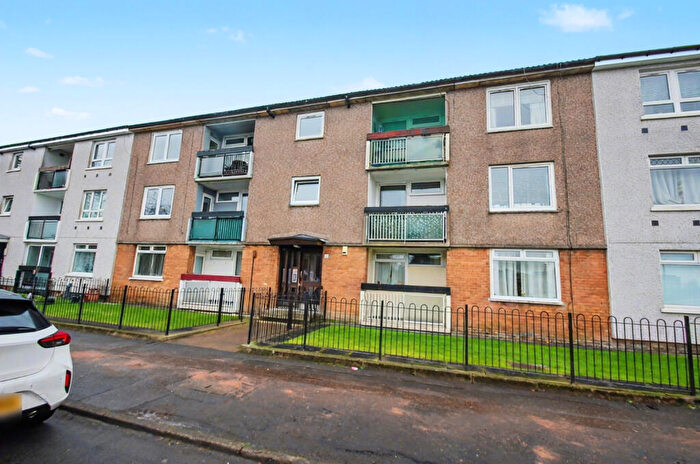
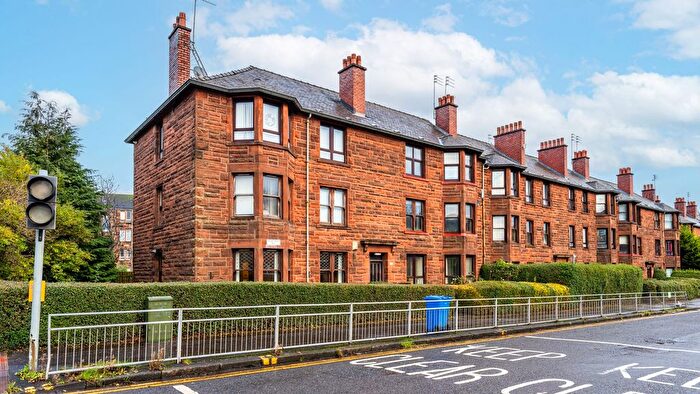
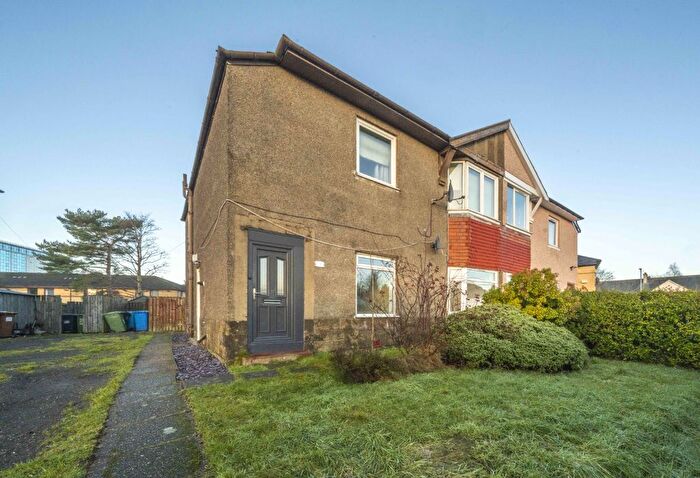
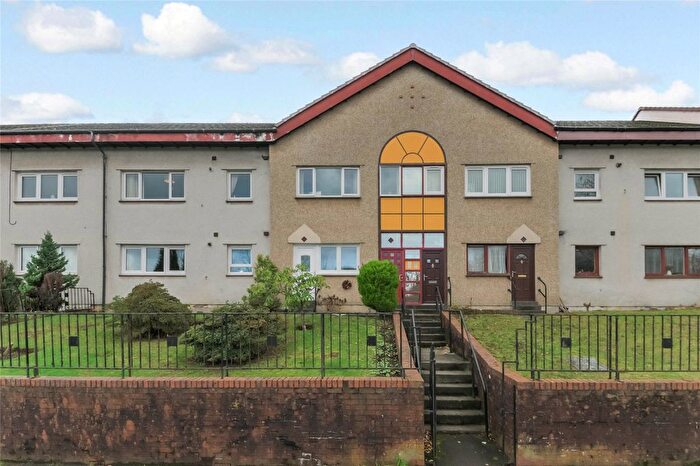
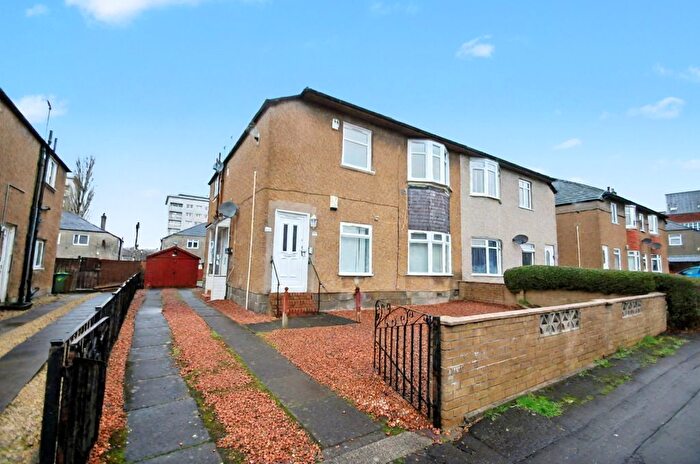
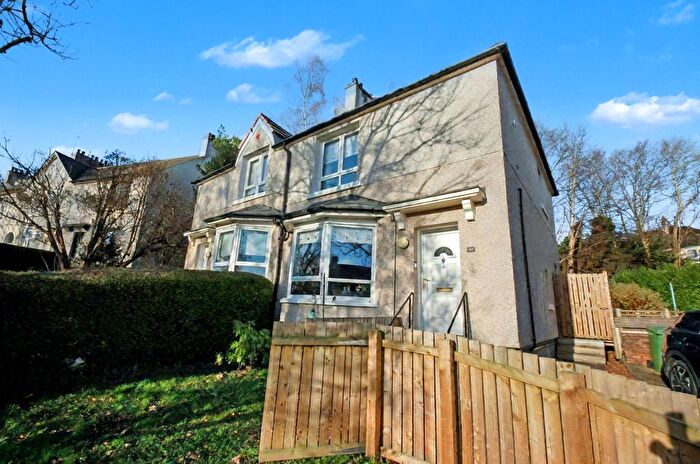
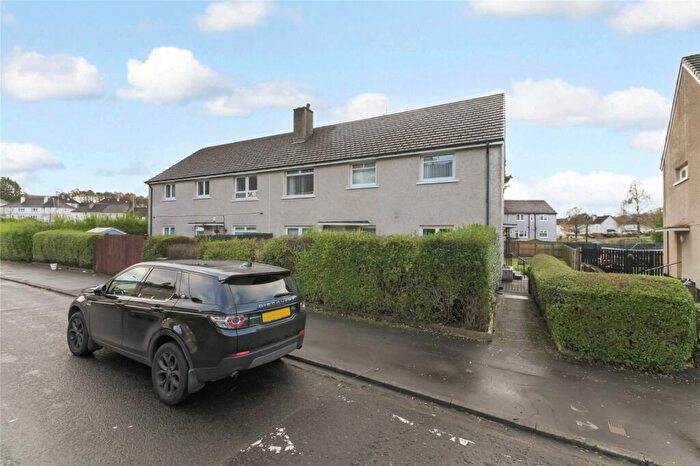
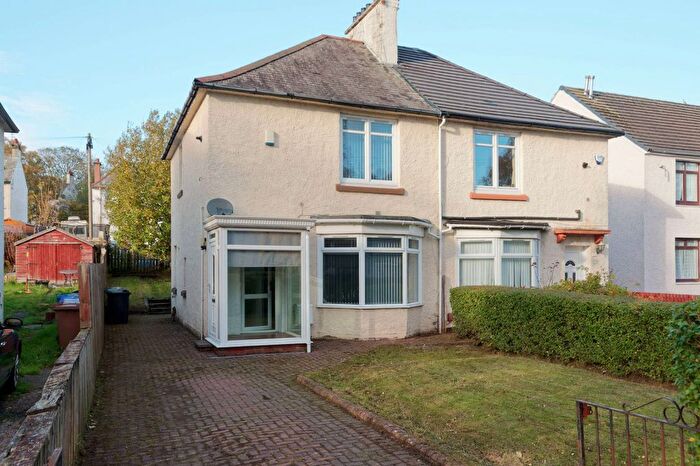
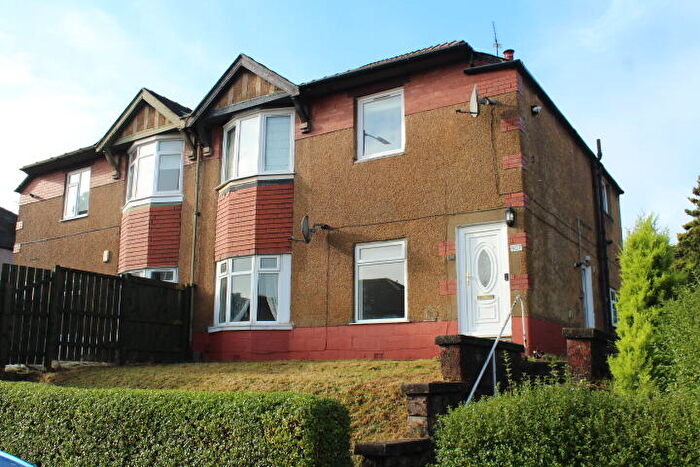
Previously listed properties near G52 1TG, Corkerhill Road

![]()
If you are looking to sell your house, let it out, or receive a property valuation, an expert can help you.
Click the button below to get started.
Price Paid in Corkerhill Road, G52 1TG, Cardonald
254 Corkerhill Road, G52 1TG, Cardonald Glasgow
Property 254 has been sold 3 times. The last time it was sold was in 08/02/2023 and the sold price was £140,000.00.
This is a Property which was sold as an Established Building in 08/02/2023
| Date | Price | Classification |
|---|---|---|
| 08/02/2023 | £140,000.00 | Established Building |
| 05/10/2017 | £86,000.00 | Established Building |
| 09/11/2005 | £92,000.00 | Established Building |
250 Corkerhill Road, G52 1TG, Cardonald Glasgow
Property 250 has been sold 3 times. The last time it was sold was in 30/10/2017 and the sold price was £107,000.00.
This is a Property which was sold as an Established Building in 30/10/2017
| Date | Price | Classification |
|---|---|---|
| 30/10/2017 | £107,000.00 | Established Building |
| 21/11/2007 | £106,000.00 | Established Building |
| 06/03/2002 | £47,000.00 | Established Building |
Postcodes in Corkerhill Road, Cardonald
Navigate through other locations in Corkerhill Road, Cardonald, Glasgow to see more property listings for sale or to rent.
Transport near G52 1TG, Corkerhill Road
-
 Corkerhill Glasgow Station
 -
Mosspark Station
-
Cardonald Station
-
Crookston Glasgow Station
-
Hillington East Station
-
Dumbreck Station
-
Pollokshaws West Station
-
Shawlands Station
-
Maxwell Park Station
-
Hillington West Station
House price paid reports for G52 1TG, Corkerhill Road
Click on the buttons below to see price paid reports by year or property price:
- Price Paid By Year
Property Price Paid in G52 1TG, Corkerhill Road by Year
The average sold property price by year was:
| Year | Average Sold Price | Price Change |
Sold Properties
|
|---|---|---|---|
| 2023 | £140,000 | 31% |
1 Property |
| 2017 | £96,500 | -10% |
2 Properties |
| 2007 | £106,000 | 13% |
1 Property |
| 2005 | £92,000 | 49% |
1 Property |
| 2002 | £47,000 | - |
1 Property |