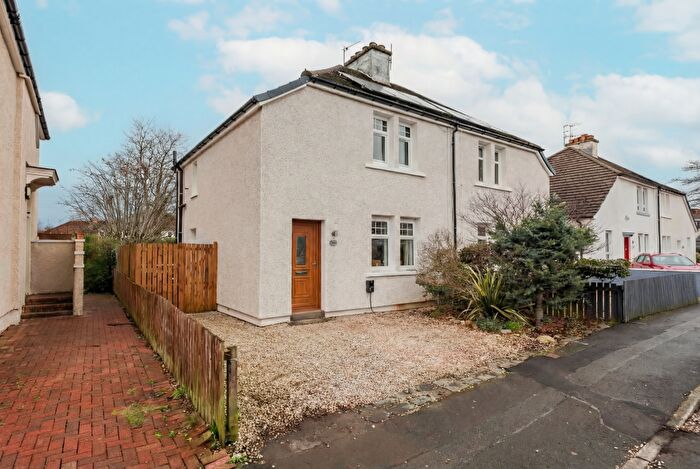
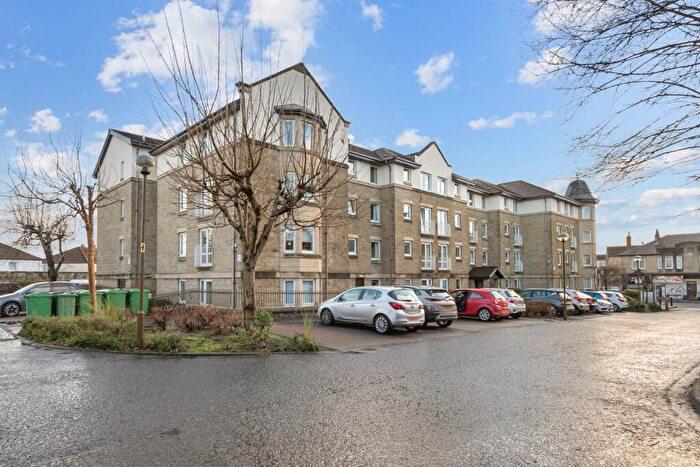
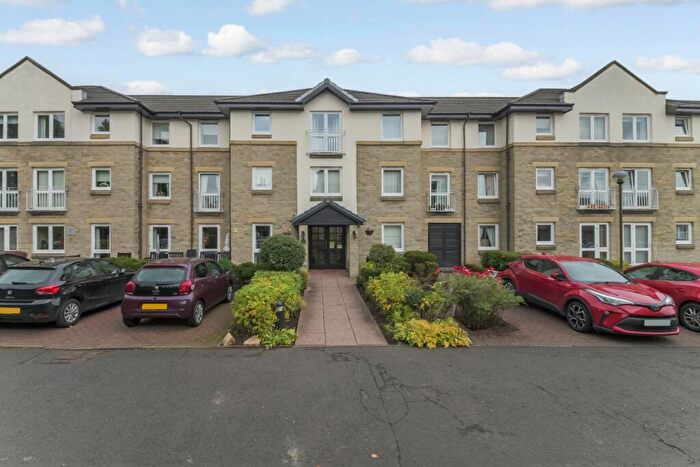
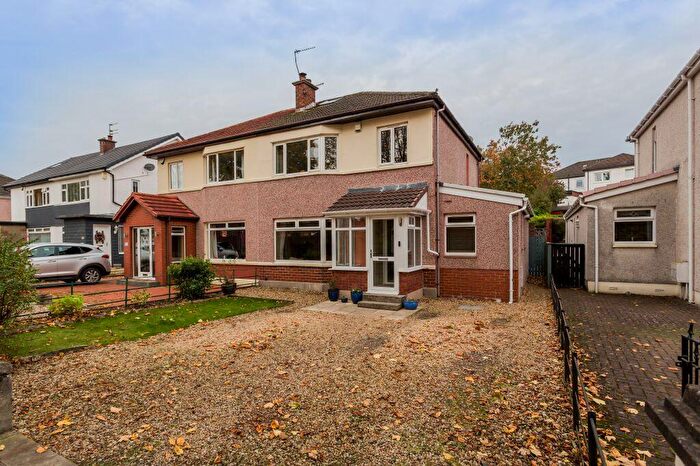
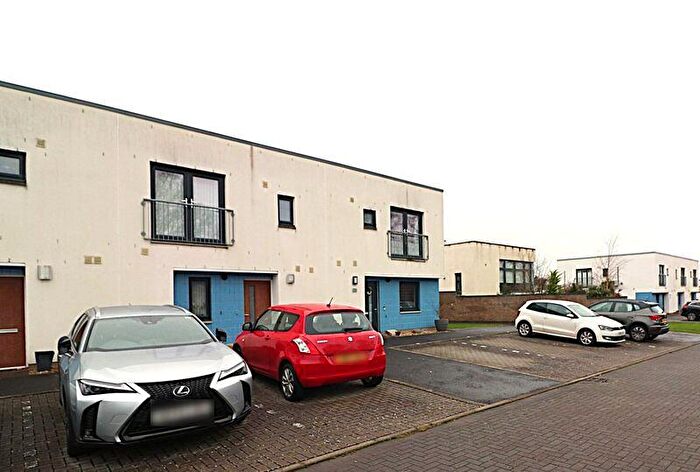
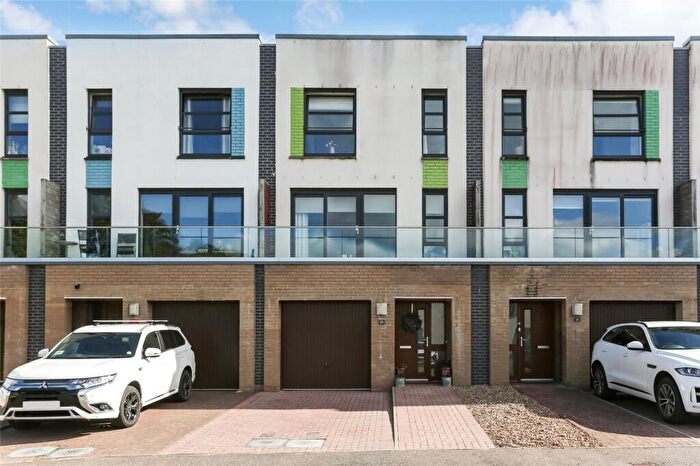
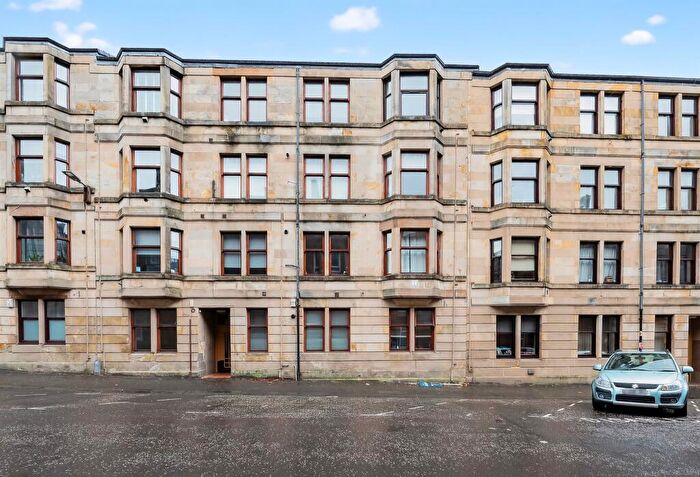
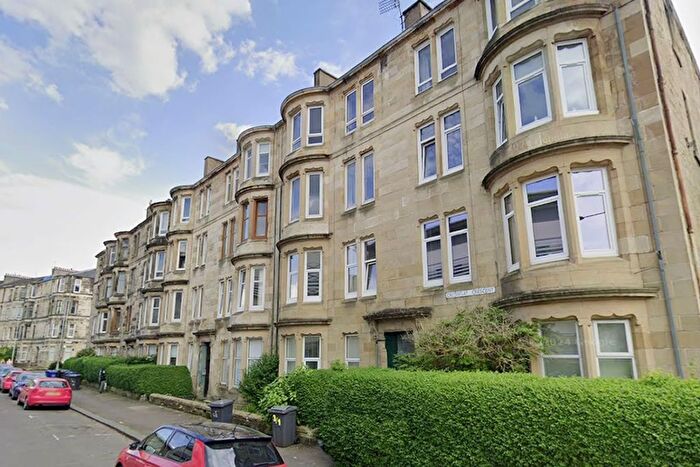
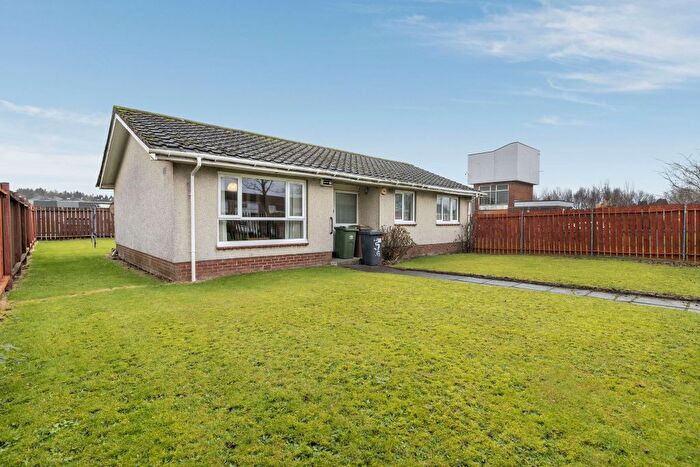
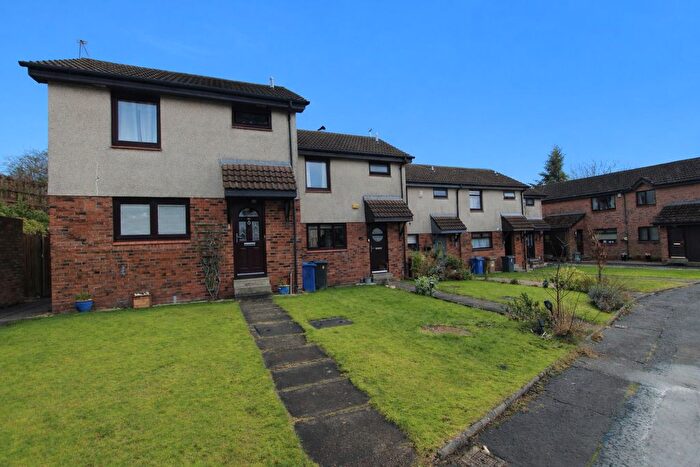
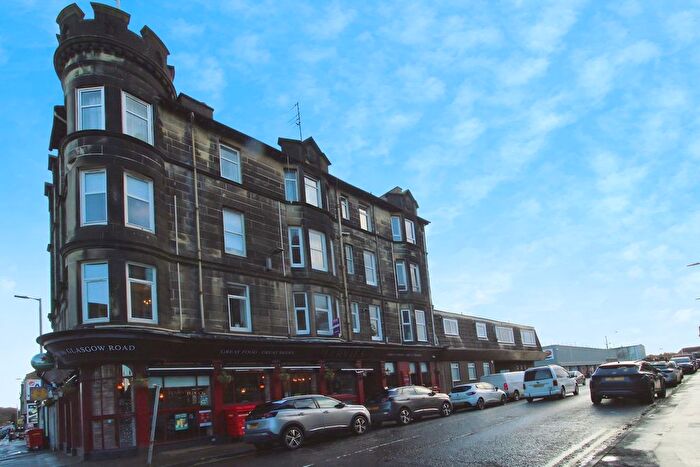
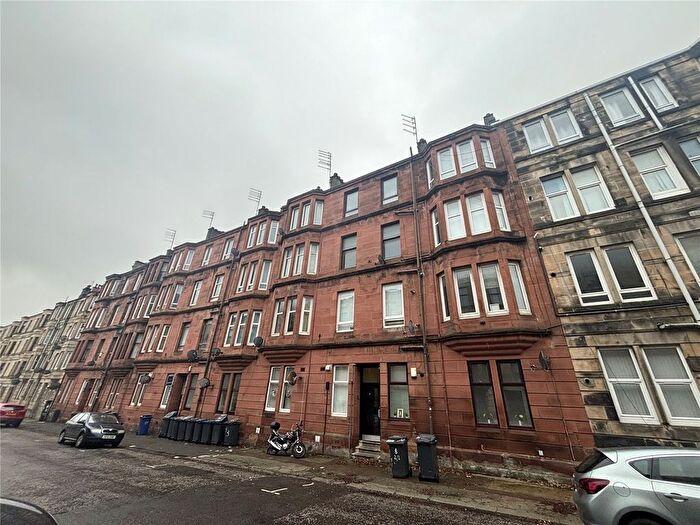
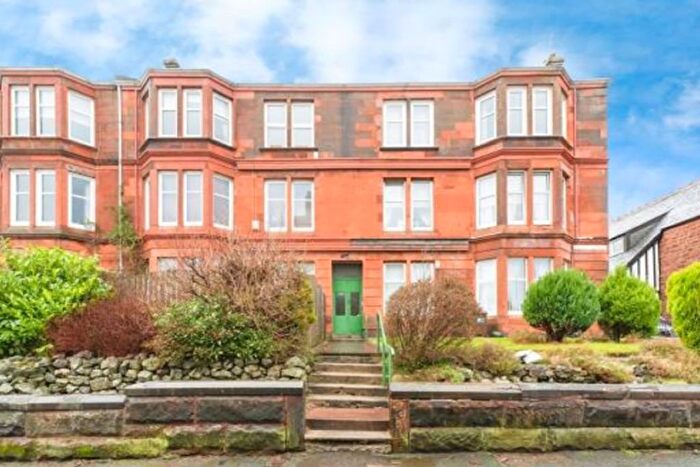
Houses for sale & to rent in Paisley Northeast and Ralston, Paisley


House Prices in Paisley Northeast and Ralston

Properties in Paisley Northeast and Ralston have an average house price of £161,741.00 and had 596 Property Transactions within the last 3 years¹.
Paisley Northeast and Ralston is an area in Paisley, Renfrewshire with 5,813 households², where the most expensive property was sold for £712,533.00.


Properties for sale in Paisley Northeast and Ralston

icon

Be the first to know about new property listings

Save this search to be notified as soon as new listings are available.


Previously listed properties in Paisley Northeast and Ralston

Be the first to know about new property listings

Save this search to be notified as soon as new listings are available.


Roads and Postcodes in Paisley Northeast and Ralston

Navigate through our locations to find the location of your next house in Paisley Northeast and Ralston, Paisley for sale or to rent.

Streets Postcodes
Allanton Avenue PA1 3BJ PA1 3BL PA1 3BN
Alton Road PA1 3NH
Arkleston Drive PA1 3EN
Arkleston Road PA1 3TE PA1 3TF PA1 3TH PA1 3TR PA1 3TS PA1 3TY PA1 3TZ
Atholl Crescent PA1 3AP PA1 3AW
Auchmannoch Avenue PA1 3AB PA1 3AG PA1 3AQ
Avondale Drive PA1 3TN PA1 3TT
Balfron Road PA1 3HA PA1 3HD
Balgair Drive PA1 3TJ
Bank Street PA1 1LN PA1 1LP PA1 1LR PA1 1LS PA1 1LT PA1 1LW
Barshaw Drive PA1 3SF PA1 3SG PA1 3SH PA1 3UA
Barshaw Place PA1 3HJ
Bathgo Avenue PA1 3DZ PA1 3EA PA1 3EB
Blair Road PA1 3AS
Blairmore Avenue PA1 3JH
Buchlyvie Road PA1 3AD PA1 3AE PA1 3AN
Christie Street PA1 1NB
Clarence Drive PA1 1QQ
Clarence Street PA1 1PR PA1 1PS PA1 1PT PA1 1PU PA1 1PX
Cochran Street PA1 1JY PA1 1JZ
Crookston Drive PA1 3DB PA1 3DD
Crossflat Crescent PA1 1NS PA1 1PN
Cyril Crescent PA1 1GT
Cyril Place PA1 1GR
Cyril Street PA1 1RW
Dalfoil Court PA1 3AH
Dalmary Drive PA1 3TL
Darvel Crescent PA1 3EF PA1 3EG PA1 3EQ
Drummond Drive PA1 3DN
Duchray Drive PA1 3BP PA1 3BS PA1 3BW
Dunchurch Road PA1 3EX PA1 3JW
Dunn Street PA1 1NT PA1 1NX PA1 1NY
East Buchanan Street PA1 1HS
East Lane PA1 1QA
Endrick Drive PA1 3TU PA1 3TX
Gartartan Road PA1 3AJ
Garthland Lane PA1 3PY PA1 3PZ
Gartmore Road PA1 3JS PA1 3NG PA1 3NQ
Glasgow Road PA1 3AF PA1 3BA PA1 3BB PA1 3BD PA1 3BE PA1 3BG PA1 3BH PA1 3BQ PA1 3DL PA1 3DP PA1 3DR PA1 3ER PA1 3JR PA1 3JT PA1 3LF PA1 3LS PA1 3LT PA1 3LU PA1 3LX PA1 3LY PA1 3LZ PA1 3NU PA1 3PA PA1 3PD PA1 3PE PA1 3PN PA1 3PW PA1 3PX PA1 3QA PA1 3QF PA1 3QG PA1 3QH PA1 3QL PA1 3QS PA1 3QX PA1 3QY PA1 3RP PA1 3RR
Golf Drive PA1 3LA
Greenlaw Avenue PA1 3RA PA1 3RB PA1 3RD PA1 3RE
Greenlaw Crescent PA1 3RS PA1 3RT
Greenlaw Drive PA1 3RU PA1 3RX PA1 3RZ
Greenlaw Gardens PA1 3EL
Hawkhead Road PA1 3NA PA1 3NB PA1 3ND PA1 3NE PA1 3NF
Howard Street PA1 1PJ PA1 1PL
Incle Street PA1 1HR
Kelburne Drive PA1 3PF PA1 3PH
Kelburne Gardens PA1 3PP
Kelburne Oval PA1 3ST PA1 3SU PA1 3SX
Killearn Drive PA1 3DE PA1 3DF PA1 3DG
Kilnside Road PA1 1RH PA1 1RJ PA1 1RL PA1 1RN PA1 1RP PA1 1RQ PA1 1SJ
Kingsburgh Drive PA1 3TP
Kinpurnie Road PA1 3HG PA1 3HH
Lacy Street PA1 1GS PA1 1QF PA1 1QH PA1 1QN PA1 1QR
Ladyburn Street PA1 1PE PA1 1PH
Lanfine Road PA1 3NJ PA1 3NL
Lang Street PA1 1PF PA1 1PG PA1 1PQ
Mansionhouse Road PA1 3QZ PA1 3RF PA1 3RG
Marchbank Gardens PA1 3JD
Mathieson Street PA1 3PL
Mckerrell Street PA1 1HT PA1 1HU PA1 1HX PA1 1NJ PA1 1NL PA1 1NN PA1 1NW
Mill Street PA1 1LY PA1 1ND
Netherdale Drive PA1 3DA
Newnham Road PA1 3DY
Newtyle Road PA1 3JU PA1 3JX PA1 3JY PA1 3LB PA1 3LE
Oldhall Road PA1 3HL PA1 3HN
Ossian Avenue PA1 3AY
Penilee Road PA1 3AA PA1 3AX PA1 3DH PA1 3ES PA1 3EU PA1 3HE PA1 3HF
Princess Crescent PA1 3SL
Ralston Avenue PA1 3BT PA1 3BY PA1 3BZ
Regent Street PA1 3TG
Roffey Park Road PA1 3ET PA1 3JL
Rosshall Avenue PA1 3JZ
Rotherwick Drive PA1 3ED
School Road PA1 3AR PA1 3AT PA1 3AU
Scotts Road PA2 7AR
Seedhill Road PA1 1QS PA1 1QU PA1 1RD PA1 1RT PA1 1SB PA1 1SD PA1 1SE
Sherwood Avenue PA1 3SJ
Southwold Road PA1 3AL
Springfield Avenue PA1 3LD
Strathmore Avenue PA1 3DS PA1 3DT PA1 3EE
Tylney Road PA1 3EY PA1 3HB PA1 3HQ PA1 3JN PA1 3JP
Unsted Place PA1 1RF
Violet Street PA1 1PA
Whitehaugh Avenue PA1 3SN PA1 3SP PA1 3SR PA1 3SS PA1 3SW
Whitehaugh Drive PA1 3PG PA1 3PJ PA1 3PQ
Williamsburgh Court PA1 1QJ PA1 1QL
Williamsburgh Terrace PA1 1QG
Windsor Crescent PA1 3SQ
Woodend Drive PA1 3DU PA1 3DX

Transport near Paisley Northeast and Ralston

Frequently asked questions about Paisley Northeast and Ralston


What is the average price for a property for sale in Paisley Northeast and Ralston?

The average price for a property for sale in Paisley Northeast and Ralston is £161,741. This amount is 27% higher than the average price in Paisley. There are 1,089 property listings for sale in Paisley Northeast and Ralston.


What streets have the most expensive properties for sale in Paisley Northeast and Ralston?

The streets with the most expensive properties for sale in Paisley Northeast and Ralston are Alton Road at an average of £450,000, Darvel Crescent at an average of £425,750 and Mansionhouse Road at an average of £380,785.


What streets have the most affordable properties for sale in Paisley Northeast and Ralston?

The streets with the most affordable properties for sale in Paisley Northeast and Ralston are Howard Street at an average of £43,172, Violet Street at an average of £45,000 and Clarence Street at an average of £45,802.


Which train stations are available in or near Paisley Northeast and Ralston?

Some of the train stations available in or near Paisley Northeast and Ralston are Hawkhead, Paisley Gilmour Street and Paisley Canal.


Property Price Paid in Paisley Northeast and Ralston by Year

The average sold property price by year was:

Year Average Sold Price Price Change
Sold Properties icon
2023 £161,660
icon
-2%
54 Properties
2022 £164,747
icon
3%
253 Properties
2021 £159,124
icon
1%
289 Properties
2020 £157,726
icon
8%
191 Properties
2019 £145,176
icon
2%
277 Properties
2018 £141,588
icon
-3%
218 Properties
2017 £145,662
icon
5%
258 Properties
2016 £139,002
icon
-0,1%
254 Properties
2015 £139,079
icon
5%
221 Properties
2014 £132,259
icon
6%
209 Properties
2013 £123,824
icon
-2%
219 Properties
2012 £126,082
icon
-12%
210 Properties
2011 £140,626
icon
11%
190 Properties
2010 £125,213
icon
-6%
138 Properties
2009 £132,822
icon
-17%
151 Properties
2008 £154,967
icon
-4%
220 Properties
2007 £161,688
icon
21%
256 Properties
2006 £127,021
icon
11%
343 Properties
2005 £113,419
icon
19%
368 Properties
2004 £91,860
icon
12%
326 Properties
2003 £80,920
icon
20%
292 Properties
2002 £64,607
icon
11%
316 Properties
2001 £57,271
-
23 Properties
Source: Registers of Scotland