
Houses for sale & to rent in Cardonald, Glasgow
House Prices in Cardonald
Properties in Cardonald have an average house price of £153k and had 621 Property Transactions within the last 3 years¹.
Cardonald is an area in Glasgow, Glasgow City with 13,418 households², where the most expensive property was sold for £560k.
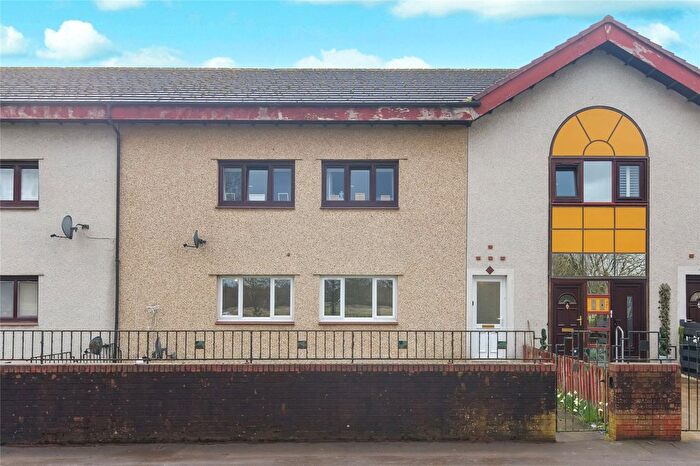
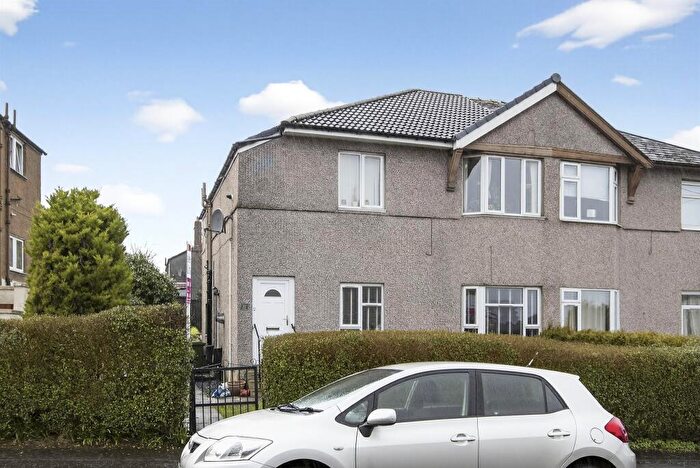
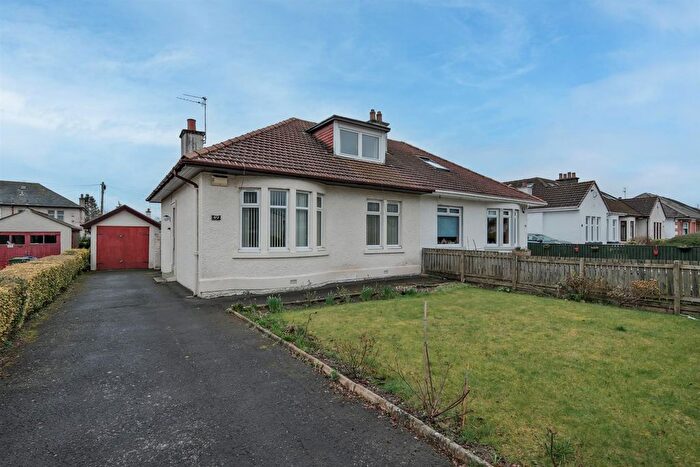
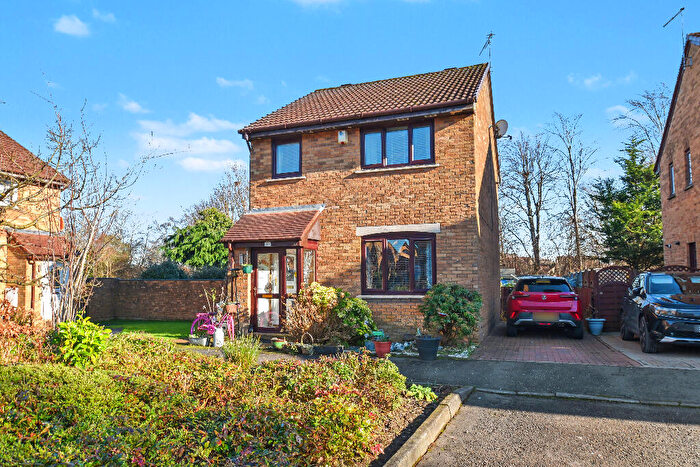
Properties for sale in Cardonald
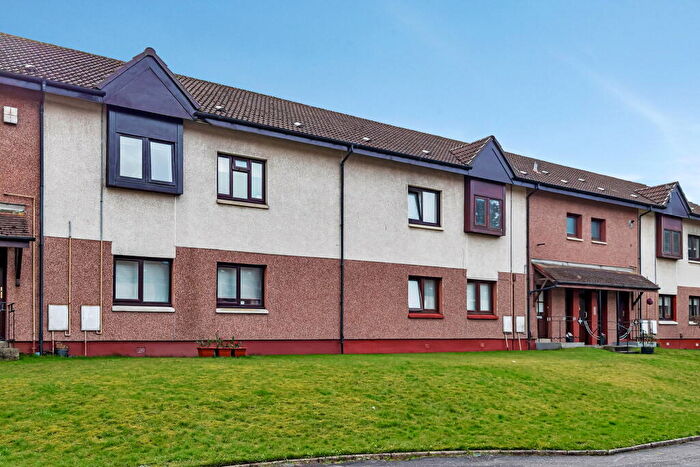

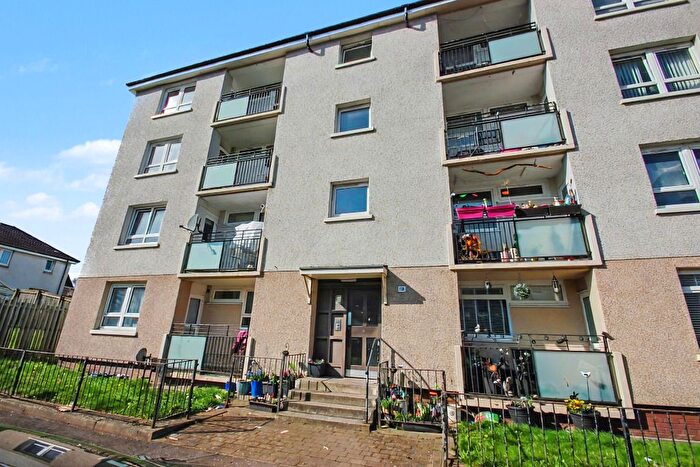
![]()
If you are looking to sell your house, let it out, or receive a property valuation, an expert can help you.
Click the button below to get started.


Roads and Postcodes in Cardonald
Navigate through our locations to find the location of your next house in Cardonald, Glasgow for sale or to rent.
Transport near Cardonald
-
 Mosspark Station
 -
Crookston Glasgow Station
-
Cardonald Station
-
Hillington East Station
-
Corkerhill Glasgow Station
-
Hillington West Station
-
Hawkhead Station
-
Dumbreck Station
-
Priesthill and Darnley Station
-
Nitshill Station
- FAQ
- Price Paid By Year
Frequently asked questions about Cardonald
What is the average price for a property for sale in Cardonald?
The average price for a property for sale in Cardonald is £153,355. This amount is 28% lower than the average price in Glasgow. There are 2,390 property listings for sale in Cardonald.
What streets have the most expensive properties for sale in Cardonald?
The streets with the most expensive properties for sale in Cardonald are Crookston Drive at an average of £462,500, Ralston Avenue at an average of £349,275 and Fife Avenue at an average of £333,000.
What streets have the most affordable properties for sale in Cardonald?
The streets with the most affordable properties for sale in Cardonald are Fochabers Drive at an average of £91,750, Tealing Avenue at an average of £95,000 and Lammermoor Avenue at an average of £101,325.
Which train stations are available in or near Cardonald?
Some of the train stations available in or near Cardonald are Mosspark, Crookston Glasgow and Cardonald.
Property Price Paid in Cardonald by Year
The average sold property price by year was:
| Year | Average Sold Price | Price Change |
Sold Properties
|
|---|---|---|---|
| 2025 | £160,706 | 3% |
170 Properties |
| 2024 | £156,404 | 7% |
213 Properties |
| 2023 | £145,375 | 5% |
238 Properties |
| 2022 | £138,301 | 6% |
399 Properties |
| 2021 | £129,877 | 4% |
491 Properties |
| 2020 | £124,051 | 13% |
372 Properties |
| 2019 | £108,543 | - |
457 Properties |
| 2018 | £108,532 | 7% |
421 Properties |
| 2017 | £100,573 | 0,2% |
433 Properties |
| 2016 | £100,327 | 7% |
460 Properties |
| 2015 | £93,617 | 5% |
428 Properties |
| 2014 | £88,524 | 3% |
373 Properties |
| 2013 | £85,487 | -6% |
371 Properties |
| 2012 | £90,495 | -1% |
306 Properties |
| 2011 | £91,127 | - |
272 Properties |
| 2010 | £91,130 | -1% |
319 Properties |
| 2009 | £92,031 | -8% |
289 Properties |
| 2008 | £98,935 | -12% |
494 Properties |
| 2007 | £110,610 | -336% |
777 Properties |
| 2006 | £482,740 | 22% |
770 Properties |
| 2005 | £375,197 | 81% |
763 Properties |
| 2004 | £73,013 | 28% |
624 Properties |
| 2003 | £52,549 | 13% |
673 Properties |
| 2002 | £45,476 | 6% |
703 Properties |
| 2001 | £42,832 | - |
62 Properties |