
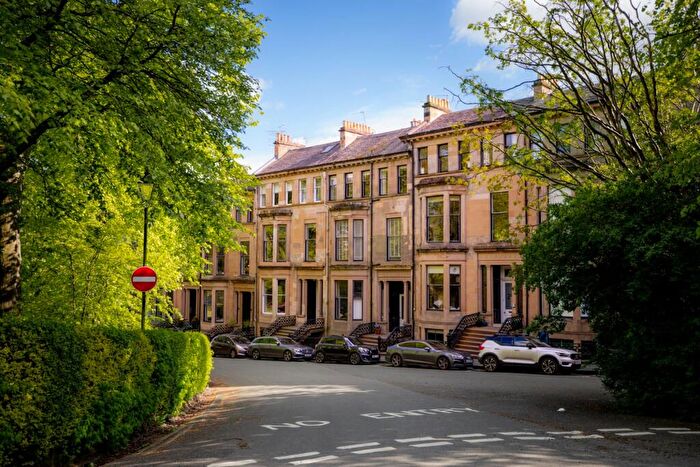
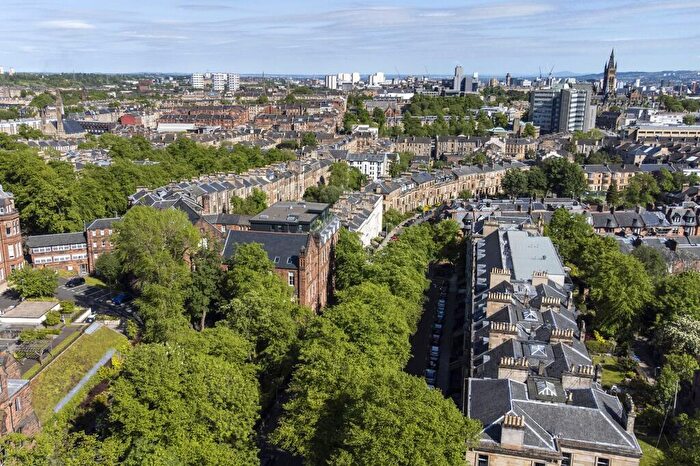
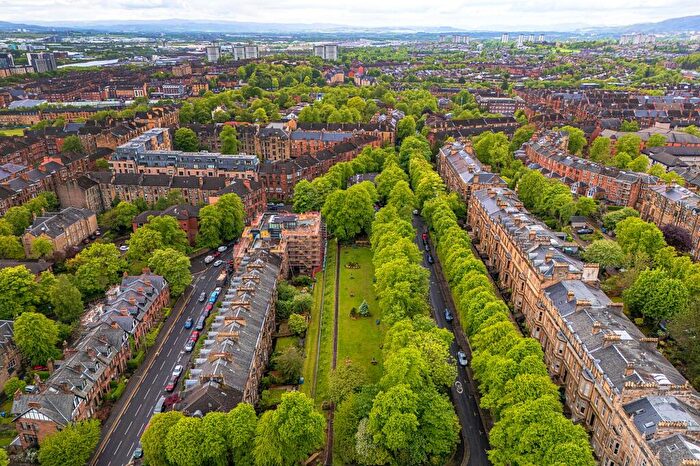
Houses for sale & to rent in Govan, Glasgow
House Prices in Govan
Properties in Govan have an average house price of £149k and had 257 Property Transactions within the last 3 years¹.
Govan is an area in Glasgow, Glasgow City with 12,982 households², where the most expensive property was sold for £715k.
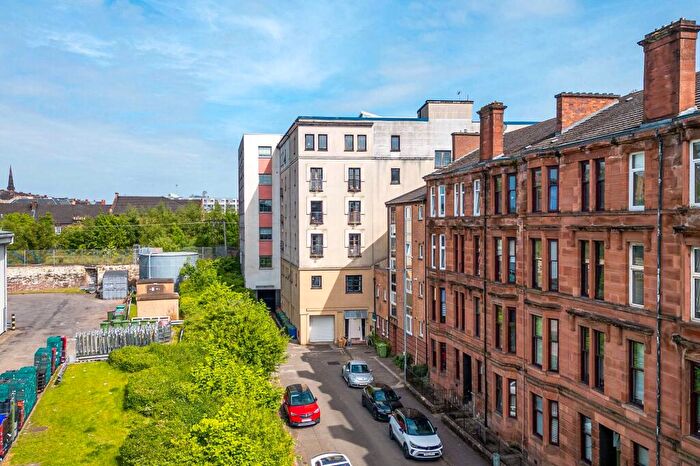
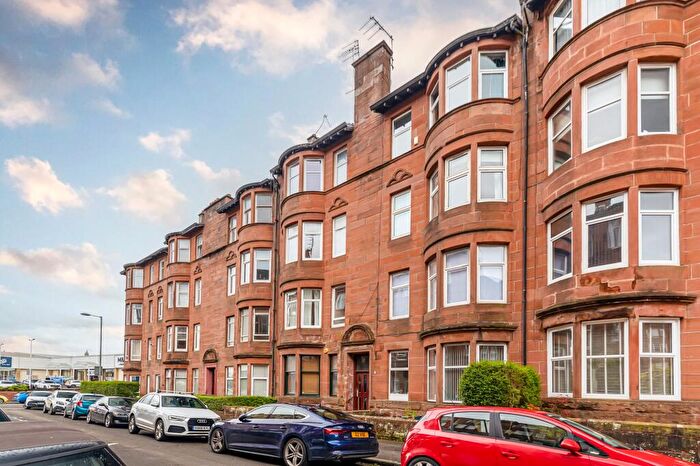
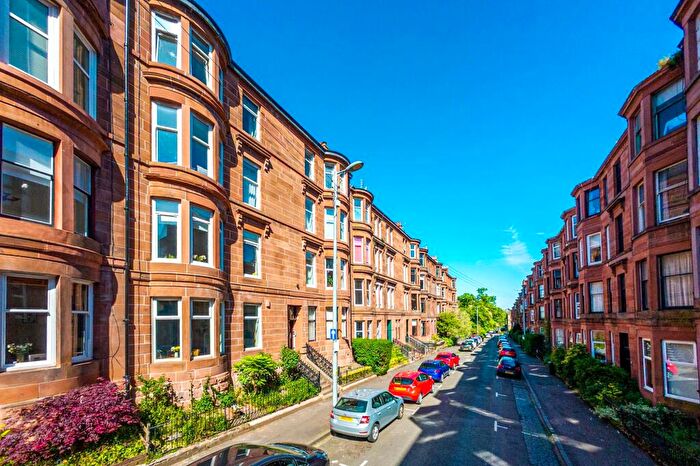
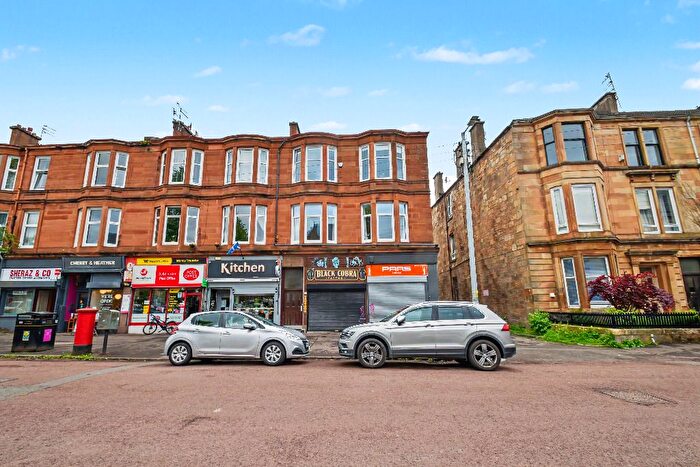
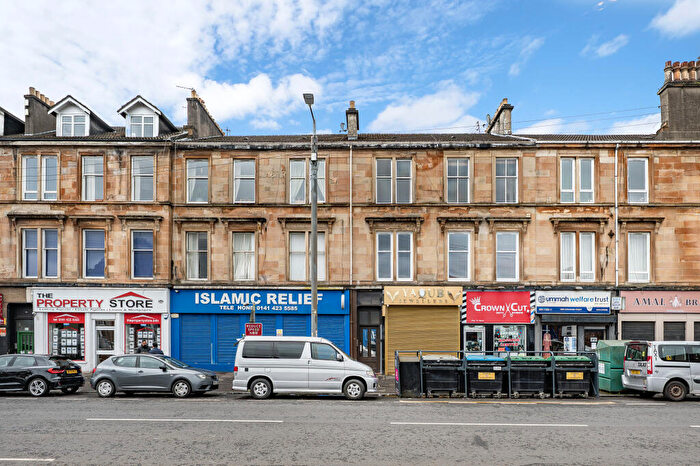
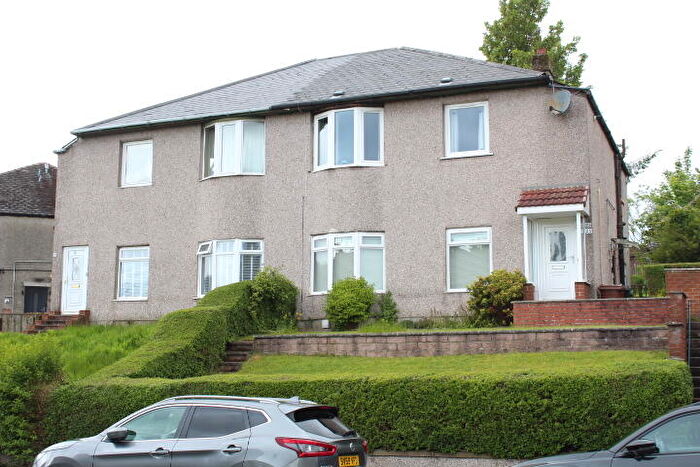
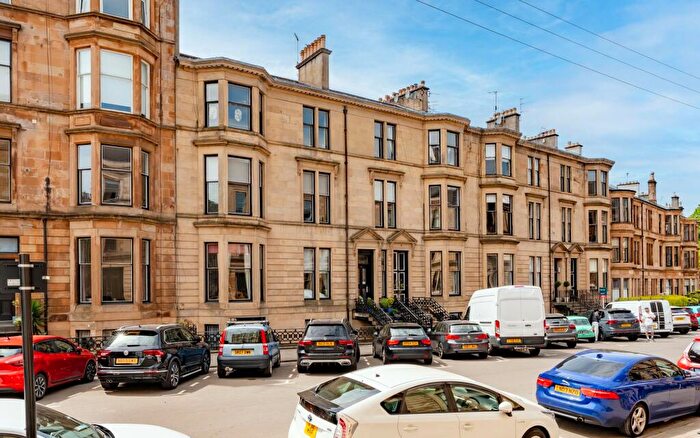
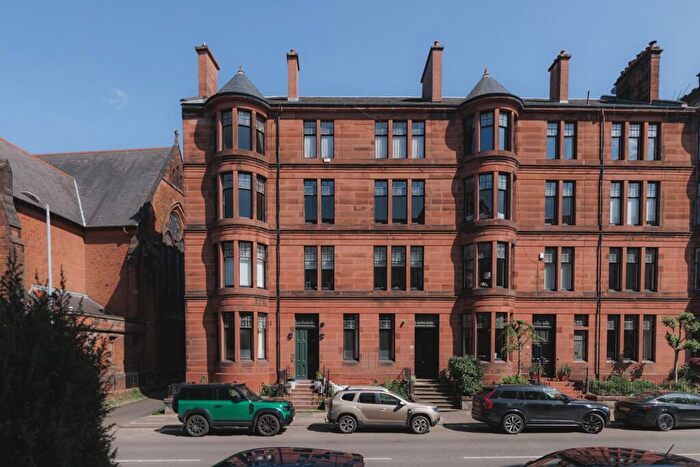
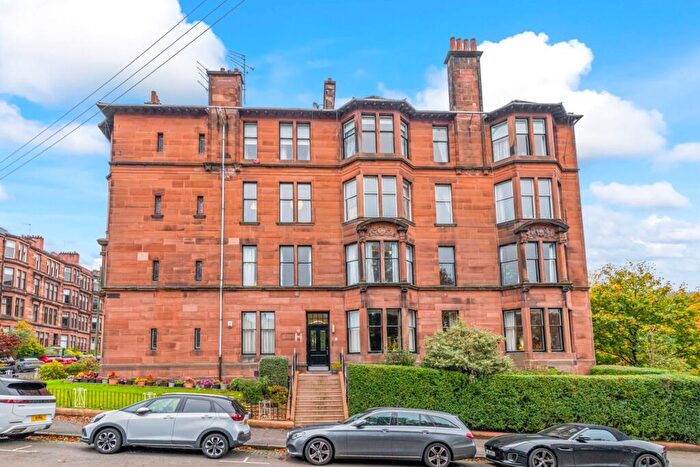
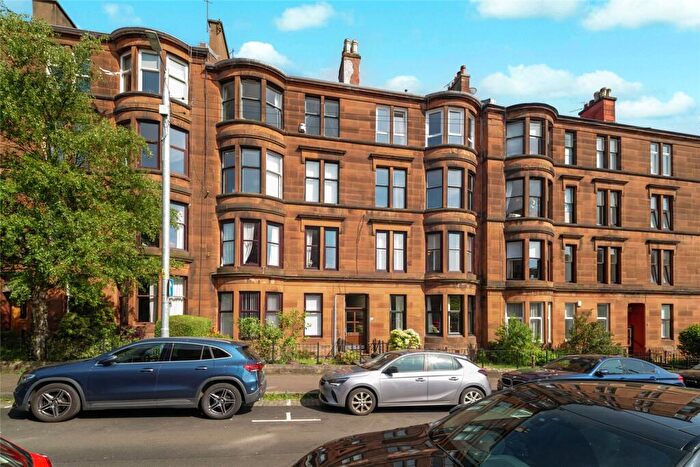
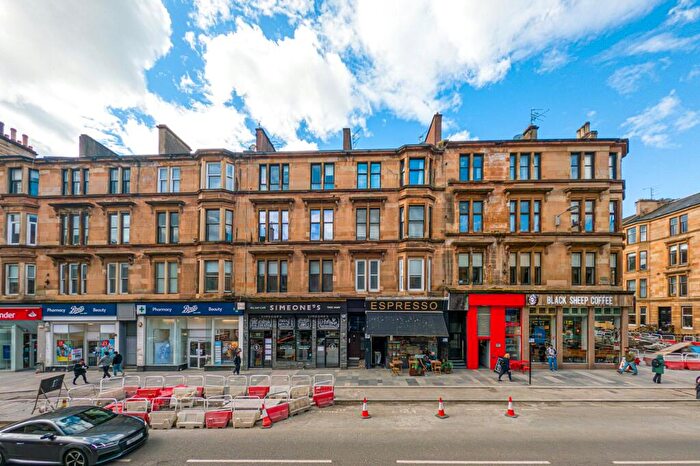
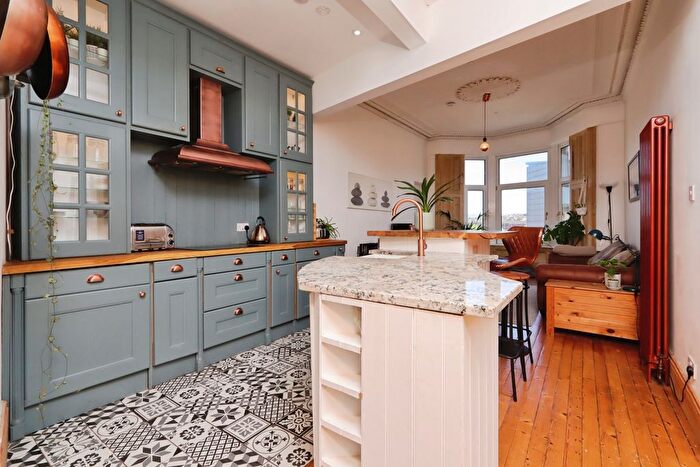
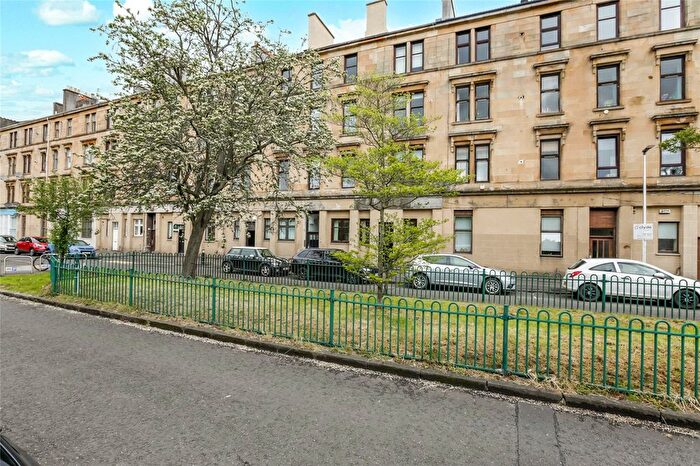
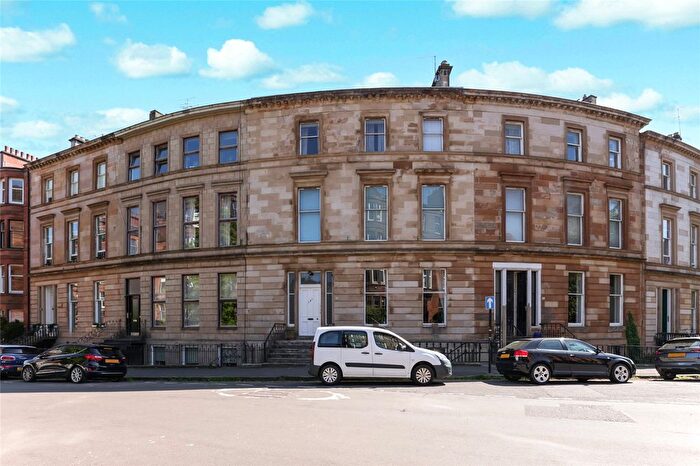
Properties for sale in Govan
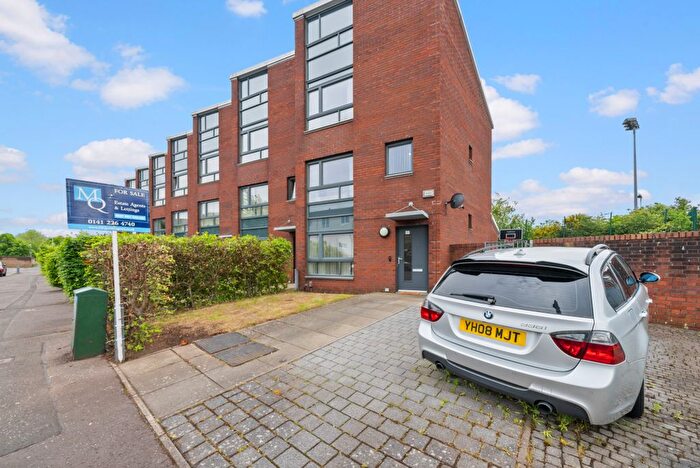
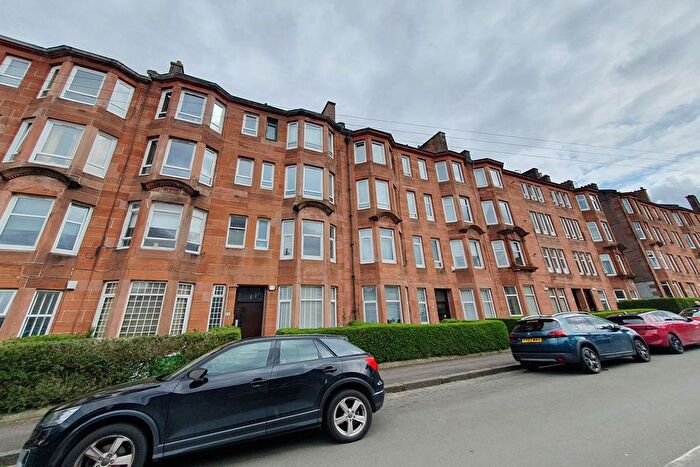
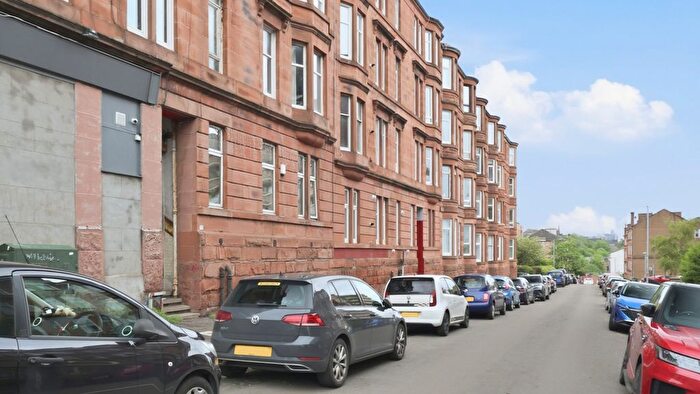
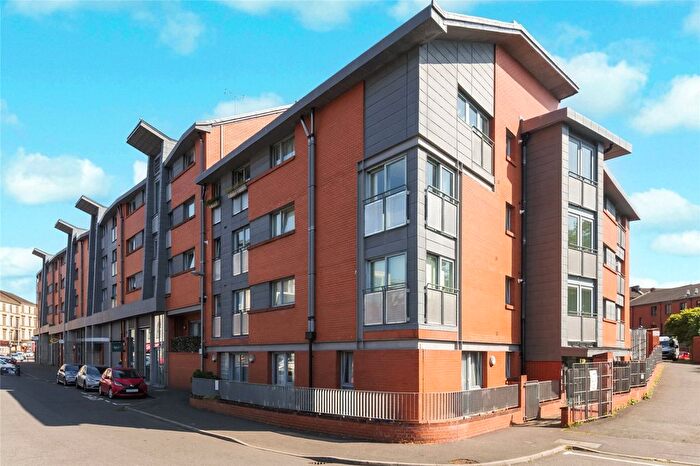
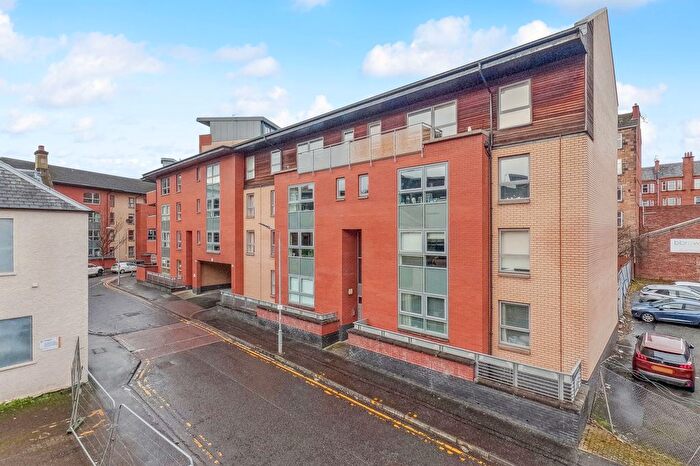
![]()
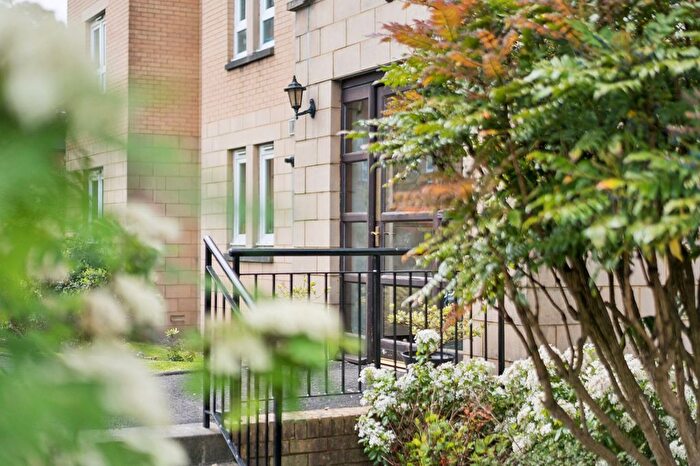
If you are looking to sell your house, let it out, or receive a property valuation, an expert can help you.
Click the button below to get started.

Roads and Postcodes in Govan
Navigate through our locations to find the location of your next house in Govan, Glasgow for sale or to rent.
Transport near Govan
-
 Dumbreck Station
 -
Partick Station
-
Exhibition Centre Glasgow Station
-
Cardonald Station
-
Anderston Station
-
Maxwell Park Station
-
Hyndland Station
-
Charing Cross (Glasgow) Station
-
Corkerhill Glasgow Station
-
Hillington East Station
- FAQ
- Price Paid By Year
Frequently asked questions about Govan
What is the average price for a property for sale in Govan?
The average price for a property for sale in Govan is £148,930. This amount is 31% lower than the average price in Glasgow. There are more than 10,000 property listings for sale in Govan.
What streets have the most expensive properties for sale in Govan?
The streets with the most expensive properties for sale in Govan are Marine Gardens at an average of £255,000, Silver Birch Drive at an average of £252,700 and Luss Road at an average of £242,022.
What streets have the most affordable properties for sale in Govan?
The streets with the most affordable properties for sale in Govan are Greenloan Avenue at an average of £91,500, Mallaig Road at an average of £95,000 and Cromdale Street at an average of £111,250.
Which train stations are available in or near Govan?
Some of the train stations available in or near Govan are Dumbreck, Partick and Exhibition Centre Glasgow.
Property Price Paid in Govan by Year
The average sold property price by year was:
| Year | Average Sold Price | Price Change |
Sold Properties
|
|---|---|---|---|
| 2025 | £170,320 | 9% |
50 Properties |
| 2024 | £154,499 | 10% |
63 Properties |
| 2023 | £139,065 | 5% |
144 Properties |
| 2022 | £131,873 | 3% |
438 Properties |
| 2021 | £127,767 | 16% |
520 Properties |
| 2020 | £106,837 | 0,4% |
338 Properties |
| 2019 | £106,358 | 2% |
413 Properties |
| 2018 | £104,465 | 6% |
416 Properties |
| 2017 | £98,167 | 14% |
437 Properties |
| 2016 | £84,857 | 4% |
495 Properties |
| 2015 | £81,161 | 2% |
456 Properties |
| 2014 | £79,346 | 7% |
383 Properties |
| 2013 | £73,675 | -14% |
362 Properties |
| 2012 | £84,014 | -4% |
322 Properties |
| 2011 | £87,489 | 3% |
247 Properties |
| 2010 | £85,071 | 0,1% |
304 Properties |
| 2009 | £84,971 | -27% |
332 Properties |
| 2008 | £107,641 | 1% |
601 Properties |
| 2007 | £106,311 | -11% |
712 Properties |
| 2006 | £117,772 | -1% |
775 Properties |
| 2005 | £119,076 | 13% |
867 Properties |
| 2004 | £103,031 | 31% |
897 Properties |
| 2003 | £71,356 | 21% |
769 Properties |
| 2002 | £56,084 | -38% |
651 Properties |
| 2001 | £77,303 | - |
46 Properties |