
Houses for sale & to rent in G20 0AQ, Caldercuilt Road, Maryhill, Glasgow
House Prices in G20 0AQ, Caldercuilt Road, Maryhill
Properties in G20 0AQ have an average house price of £325,000.00 and had 1 Property Transaction within the last 3 years.¹ G20 0AQ is a postcode in Caldercuilt Road located in Maryhill, an area in Glasgow, Glasgow City, with 4 households², where the most expensive property was sold for £325,000.00.
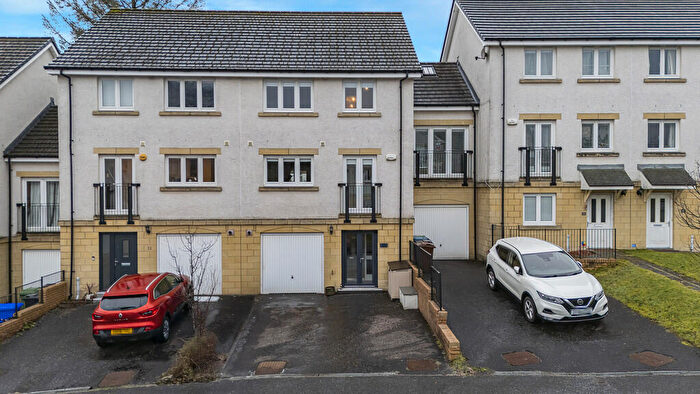
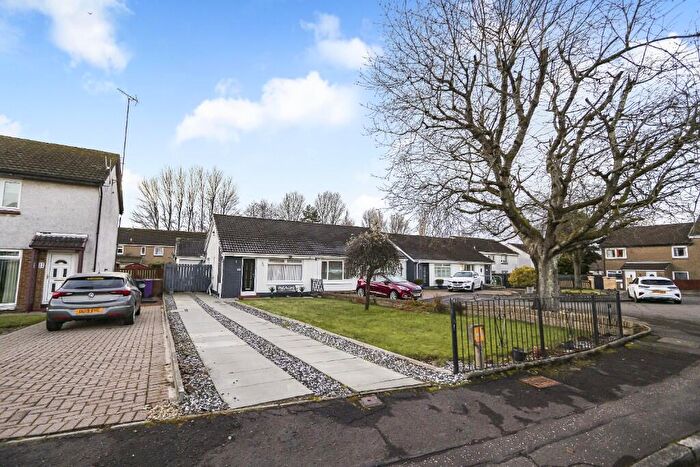
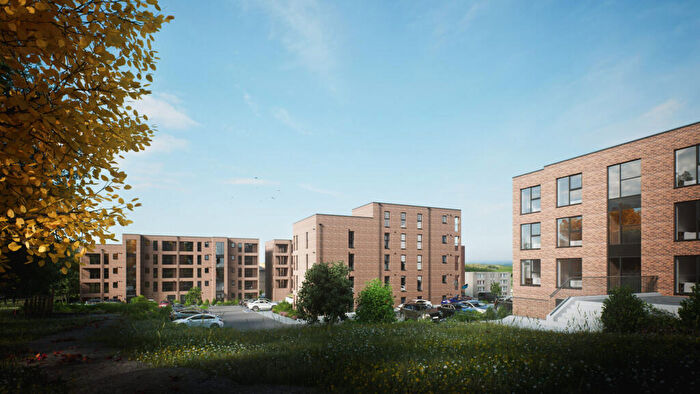
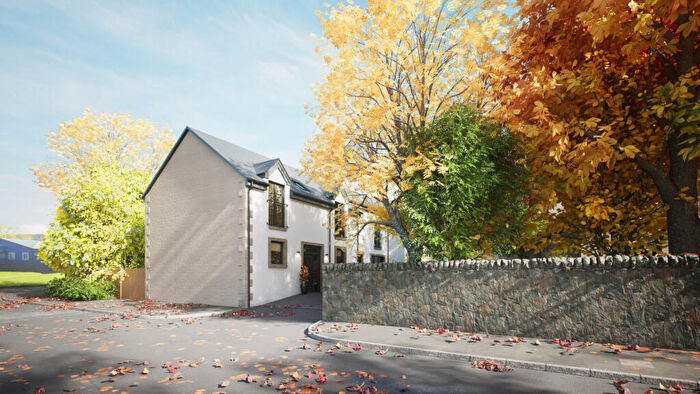
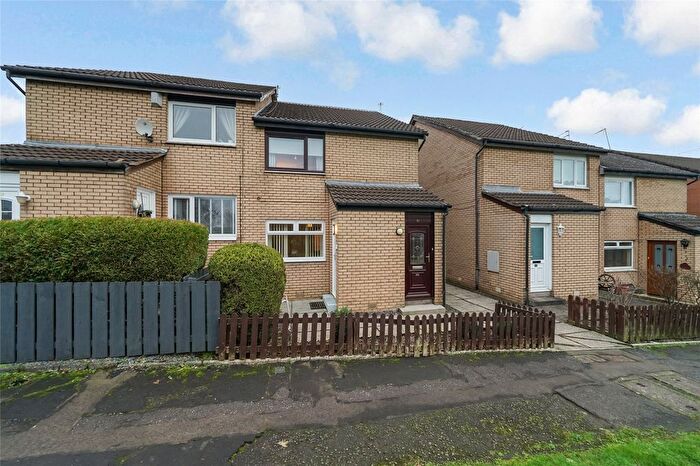
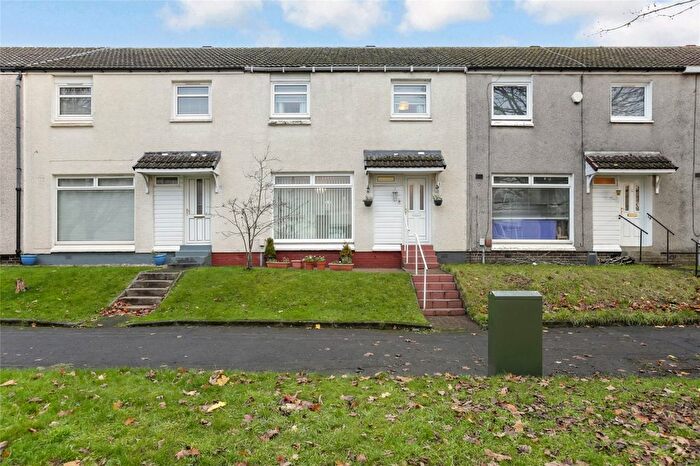
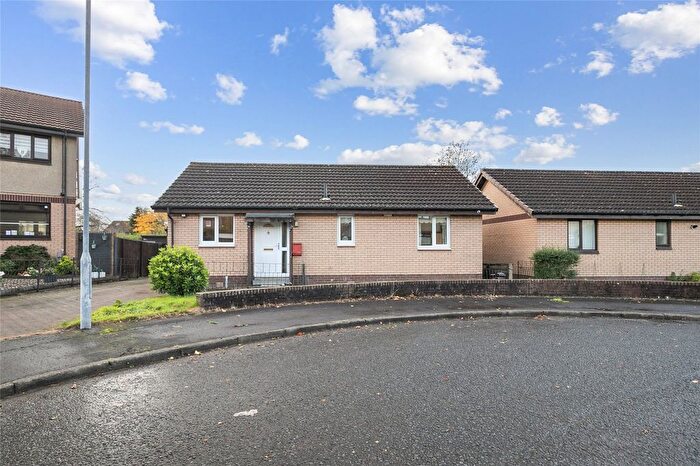
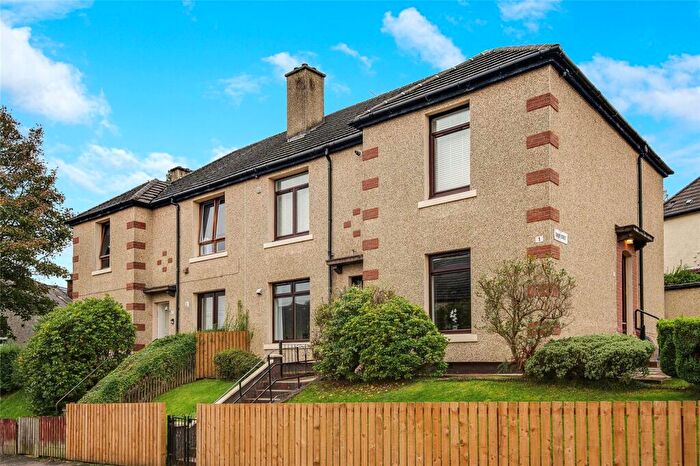
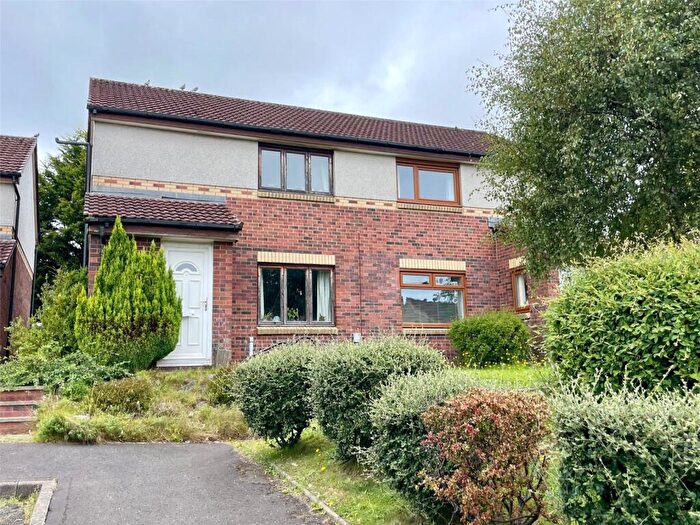
Properties for sale near G20 0AQ, Caldercuilt Road

![]()
If you are looking to sell your house, let it out, or receive a property valuation, an expert can help you.
Click the button below to get started.

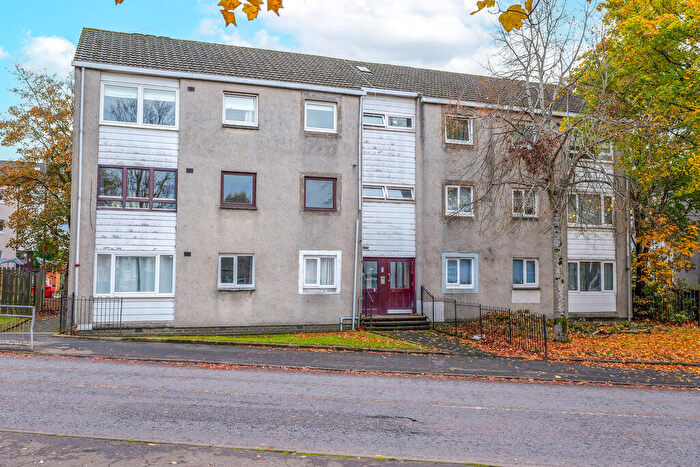
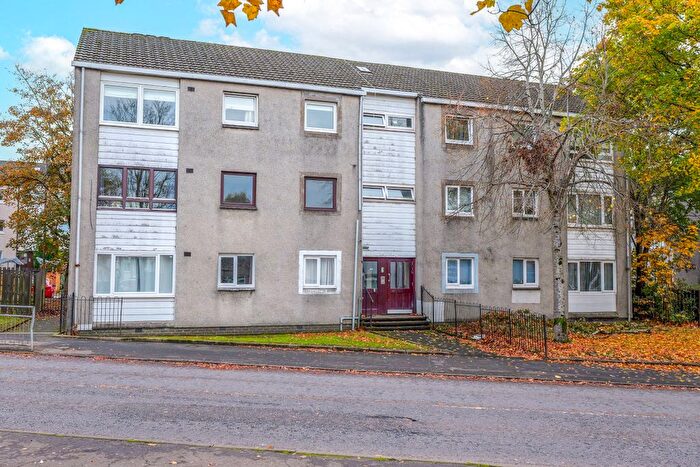
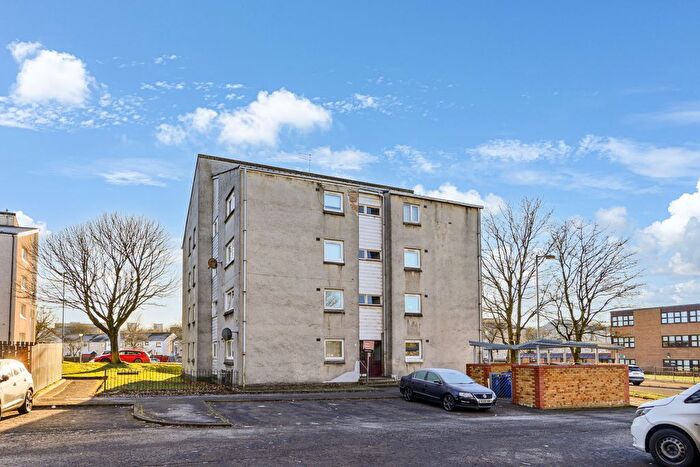
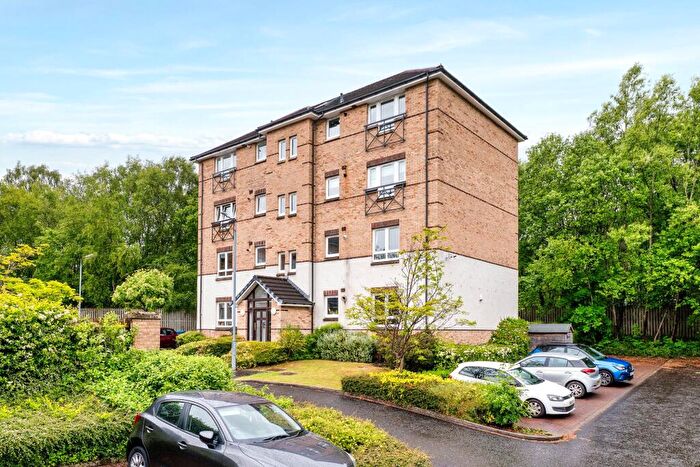
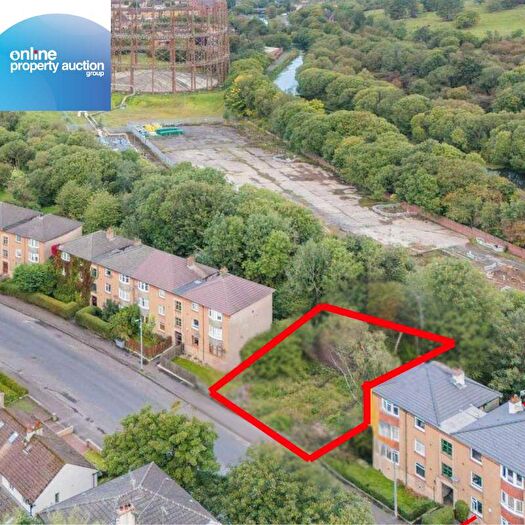
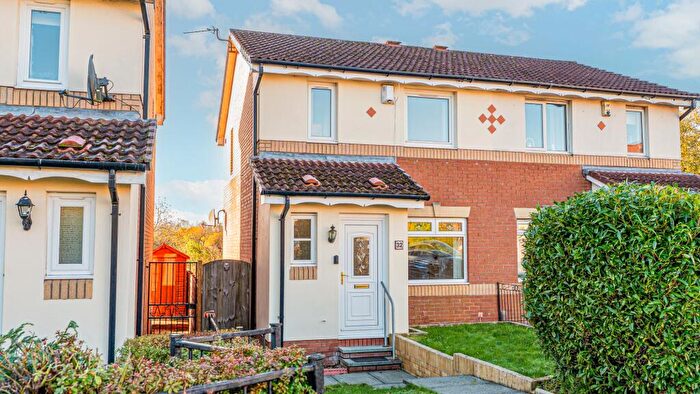
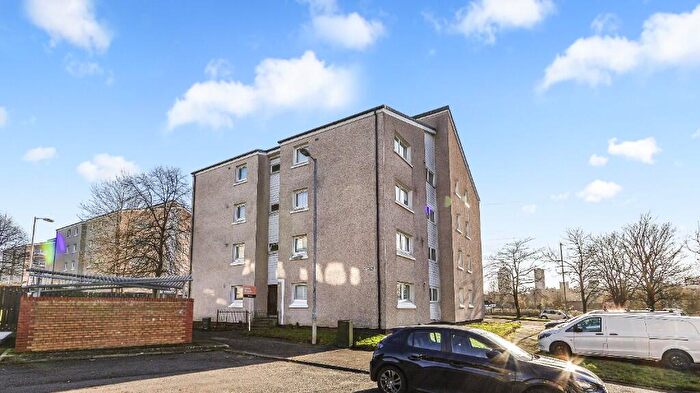
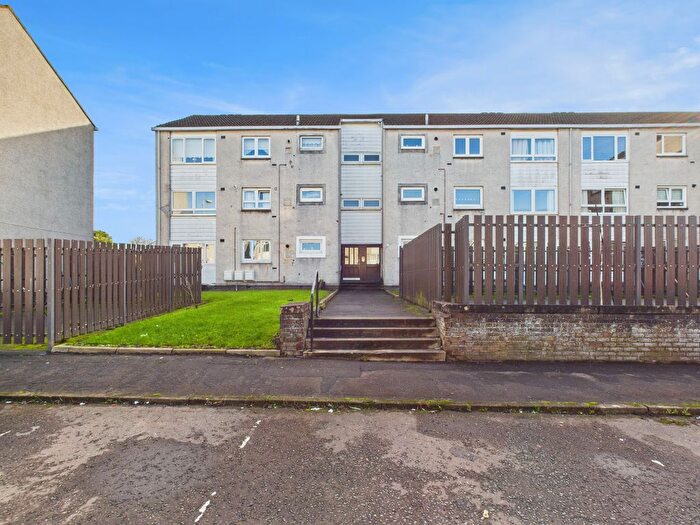
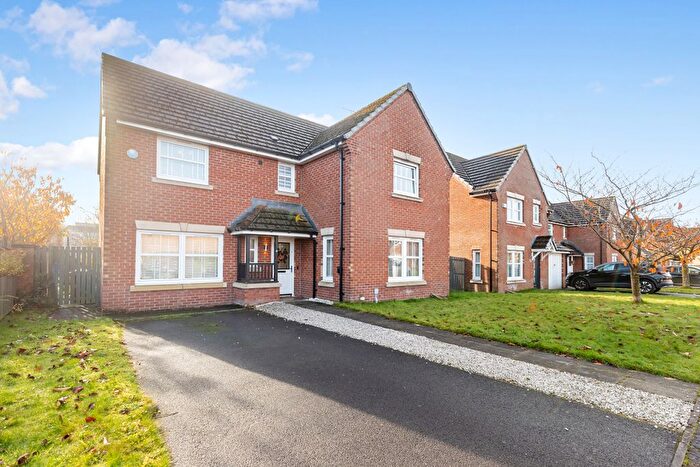
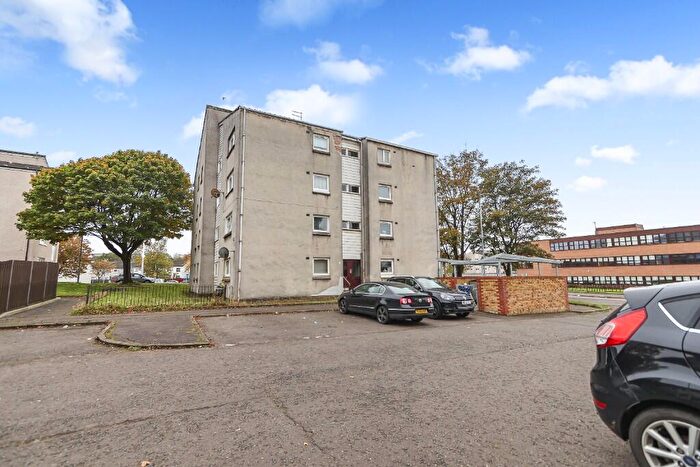
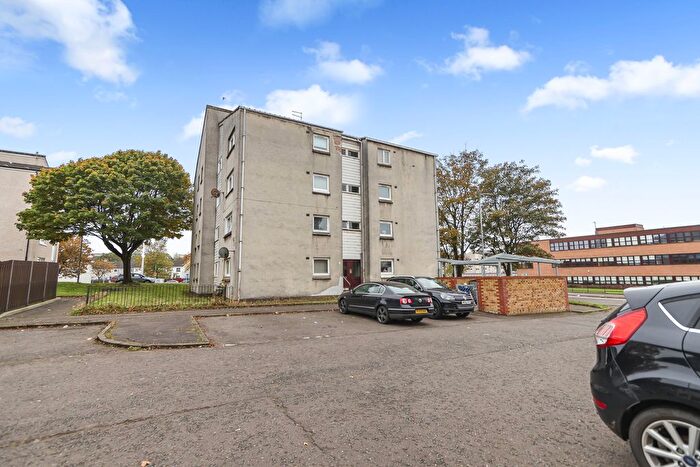
Previously listed properties near G20 0AQ, Caldercuilt Road

![]()
If you are looking to sell your house, let it out, or receive a property valuation, an expert can help you.
Click the button below to get started.

Price Paid in Caldercuilt Road, G20 0AQ, Maryhill
32 Caldercuilt Road, G20 0AQ, Maryhill Glasgow
Property 32 has been sold 2 times. The last time it was sold was in 10/03/2023 and the sold price was £325,000.00.
This is a Property which was sold as an Established Building in 10/03/2023
| Date | Price | Classification |
|---|---|---|
| 10/03/2023 | £325,000.00 | Established Building |
| 13/05/2019 | £300,000.00 | Established Building |
34 Caldercuilt Road, G20 0AQ, Maryhill Glasgow
Property 34 has been sold 3 times. The last time it was sold was in 09/08/2018 and the sold price was £480,000.00.
This is a Property which was sold as an Established Building in 09/08/2018
| Date | Price | Classification |
|---|---|---|
| 09/08/2018 | £480,000.00 | Established Building |
| 24/12/2002 | £275,000.00 | Established Building |
| 14/06/2002 | £187,500.00 | Established Building |
Postcodes in Caldercuilt Road, Maryhill
Navigate through other locations in Caldercuilt Road, Maryhill, Glasgow to see more property listings for sale or to rent.
Transport near G20 0AQ, Caldercuilt Road
-
 Maryhill Station
 -
Summerston Station
-
Gilshochill Station
-
Kelvindale Station
-
Anniesland Station
-
Westerton Station
-
Hyndland Station
-
Jordanhill Station
-
Possilpark and Parkhouse Station
-
Hillfoot Station
House price paid reports for G20 0AQ, Caldercuilt Road
Click on the buttons below to see price paid reports by year or property price:
- Price Paid By Year
Property Price Paid in G20 0AQ, Caldercuilt Road by Year
The average sold property price by year was:
| Year | Average Sold Price | Price Change |
Sold Properties
|
|---|---|---|---|
| 2023 | £325,000 | 8% |
1 Property |
| 2019 | £300,000 | -60% |
1 Property |
| 2018 | £480,000 | 52% |
1 Property |
| 2002 | £231,250 | - |
2 Properties |