
Houses for sale & to rent in Hillhead, Glasgow
House Prices in Hillhead
Properties in Hillhead have an average house price of £338k and had 228 Property Transactions within the last 3 years¹.
Hillhead is an area in Glasgow, Glasgow City with 11,269 households², where the most expensive property was sold for £1.2M.
Properties for sale in Hillhead
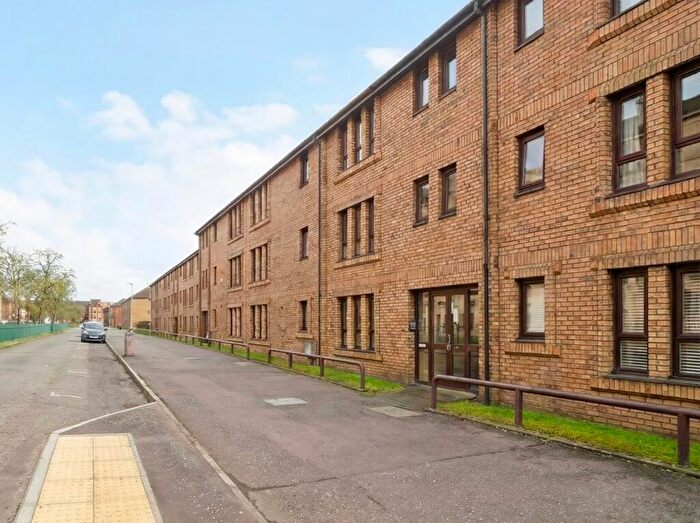

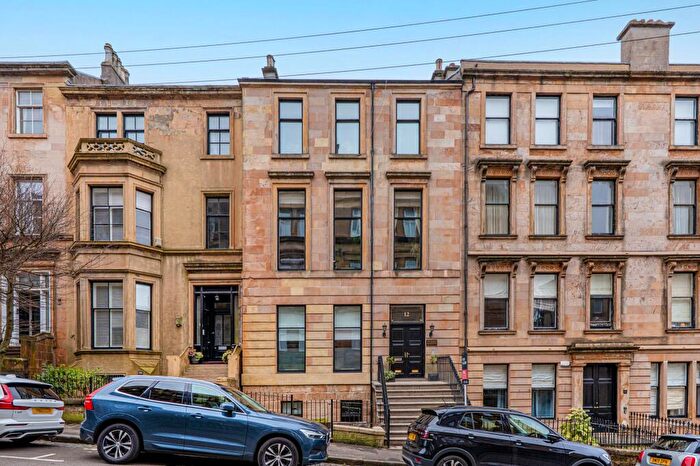
![]()
If you are looking to sell your house, let it out, or receive a property valuation, an expert can help you.
Click the button below to get started.

Roads and Postcodes in Hillhead
Navigate through our locations to find the location of your next house in Hillhead, Glasgow for sale or to rent.
Transport near Hillhead
-
 Charing Cross (Glasgow) Station
 -
Exhibition Centre Glasgow Station
-
Anderston Station
-
Partick Station
-
Glasgow Central Station
-
Possilpark and Parkhouse Station
-
Glasgow Queen Street Station
-
Ashfield Station
-
Hyndland Station
-
Gilshochill Station
- FAQ
- Price Paid By Year
Frequently asked questions about Hillhead
What is the average price for a property for sale in Hillhead?
The average price for a property for sale in Hillhead is £338,344. This amount is 58% higher than the average price in Glasgow. There are 2,827 property listings for sale in Hillhead.
What streets have the most expensive properties for sale in Hillhead?
The streets with the most expensive properties for sale in Hillhead are Hamilton Drive at an average of £1,118,400, Claremont Terrace Lane at an average of £640,500 and Kelvinside Gardens East at an average of £632,000.
What streets have the most affordable properties for sale in Hillhead?
The streets with the most affordable properties for sale in Hillhead are Kelvinside Drive at an average of £147,500, Manresa Place at an average of £157,500 and Maryhill Road at an average of £161,161.
Which train stations are available in or near Hillhead?
Some of the train stations available in or near Hillhead are Charing Cross (Glasgow), Exhibition Centre Glasgow and Anderston.
Property Price Paid in Hillhead by Year
The average sold property price by year was:
| Year | Average Sold Price | Price Change |
Sold Properties
|
|---|---|---|---|
| 2025 | £422,138 | 3% |
40 Properties |
| 2024 | £408,877 | 30% |
54 Properties |
| 2023 | £284,907 | -4% |
134 Properties |
| 2022 | £296,041 | 7% |
577 Properties |
| 2021 | £274,562 | -5% |
742 Properties |
| 2020 | £287,323 | 15% |
446 Properties |
| 2019 | £244,036 | -6% |
536 Properties |
| 2018 | £257,578 | 6% |
584 Properties |
| 2017 | £241,712 | 6% |
608 Properties |
| 2016 | £226,696 | 6% |
657 Properties |
| 2015 | £213,073 | 6% |
604 Properties |
| 2014 | £199,554 | 3% |
571 Properties |
| 2013 | £193,740 | 2% |
601 Properties |
| 2012 | £190,141 | -0,5% |
442 Properties |
| 2011 | £191,021 | 4% |
402 Properties |
| 2010 | £183,339 | 1% |
382 Properties |
| 2009 | £181,697 | -40% |
465 Properties |
| 2008 | £253,729 | 16% |
538 Properties |
| 2007 | £212,487 | 12% |
649 Properties |
| 2006 | £187,909 | 6% |
829 Properties |
| 2005 | £176,921 | 9% |
822 Properties |
| 2004 | £161,570 | 12% |
829 Properties |
| 2003 | £142,304 | 18% |
798 Properties |
| 2002 | £117,345 | -43% |
880 Properties |
| 2001 | £167,282 | - |
66 Properties |