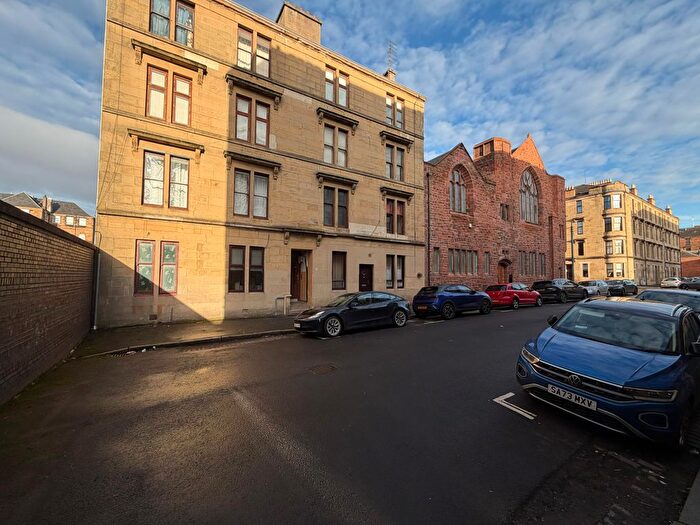
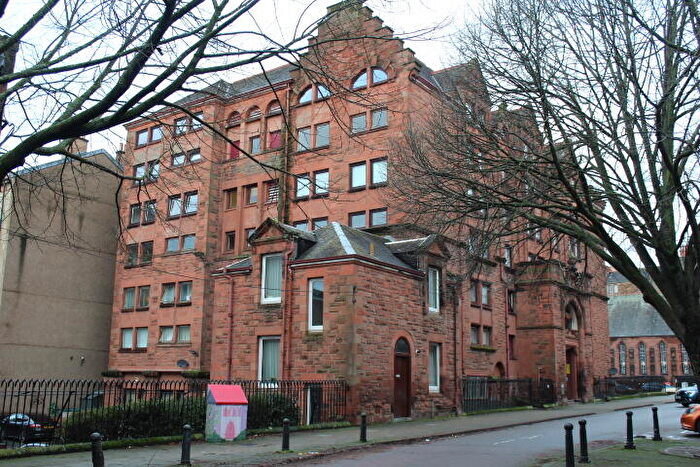
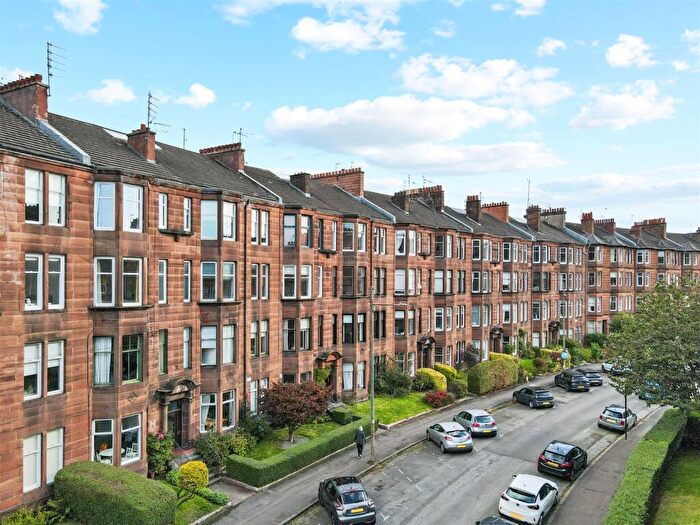
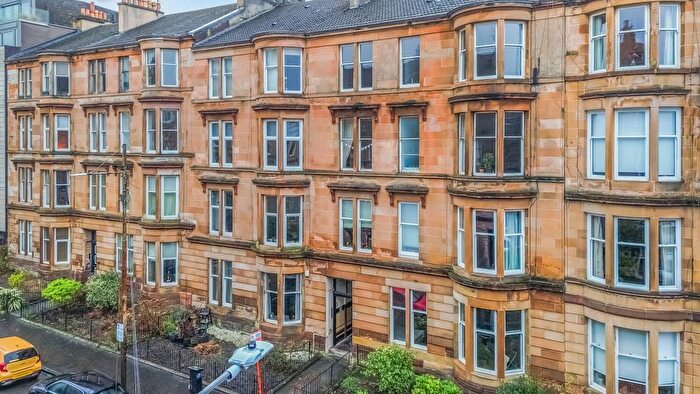
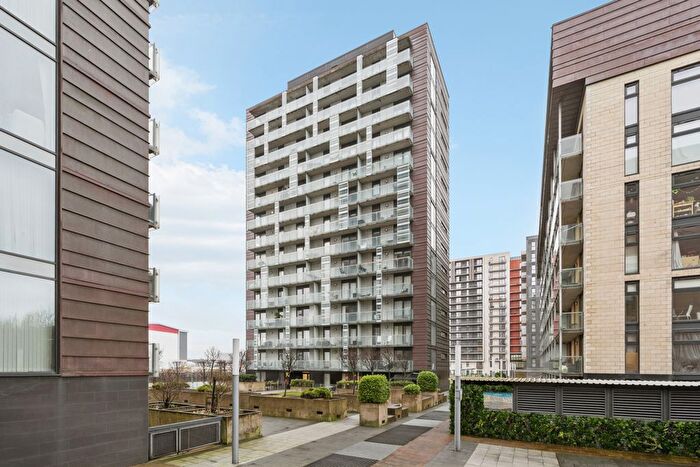
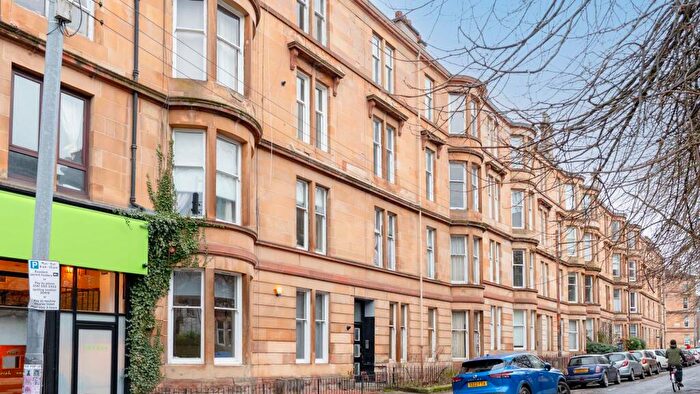
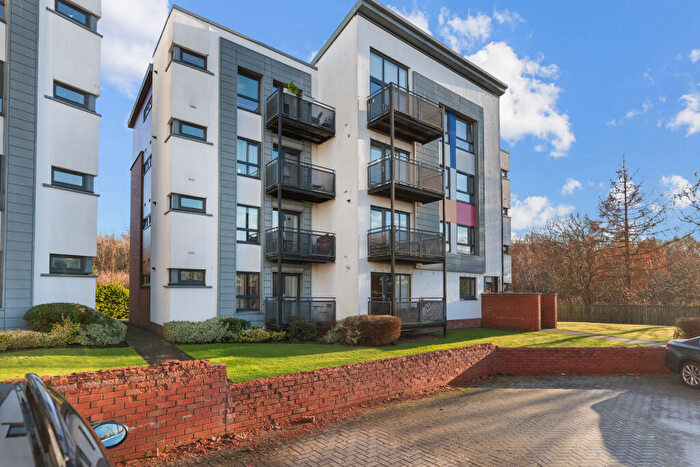
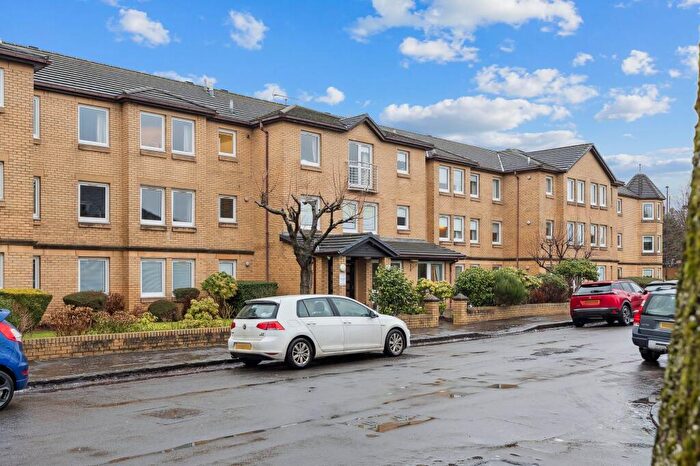
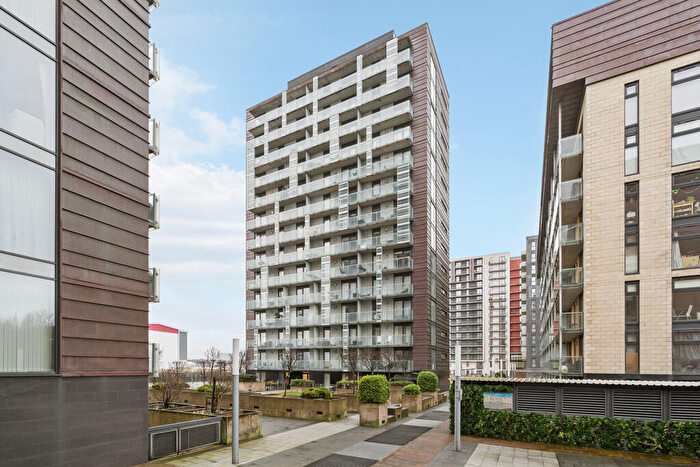
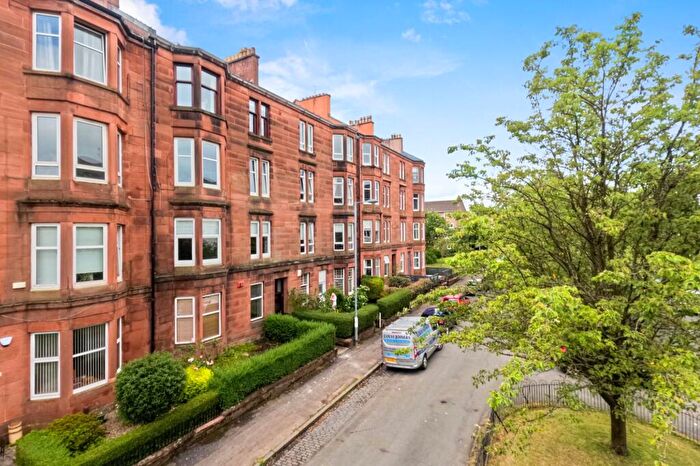
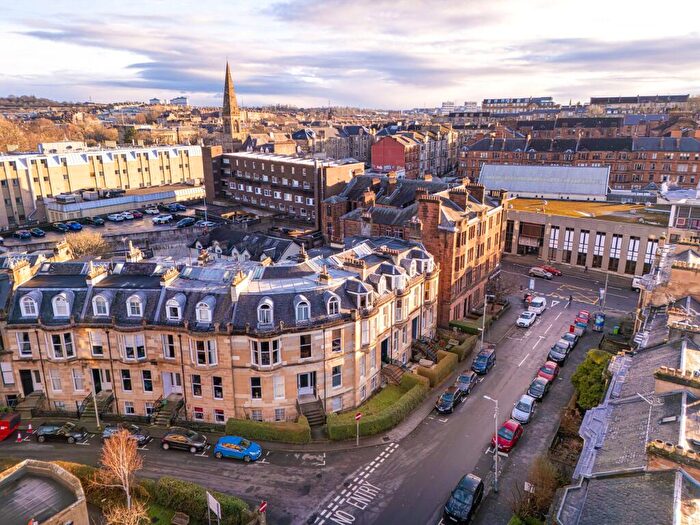
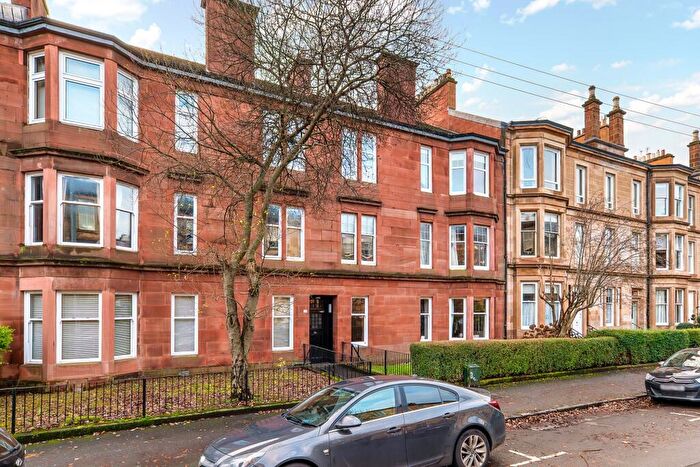
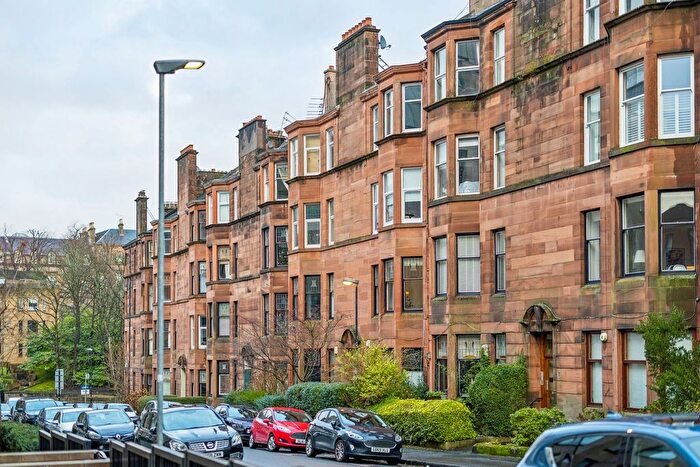
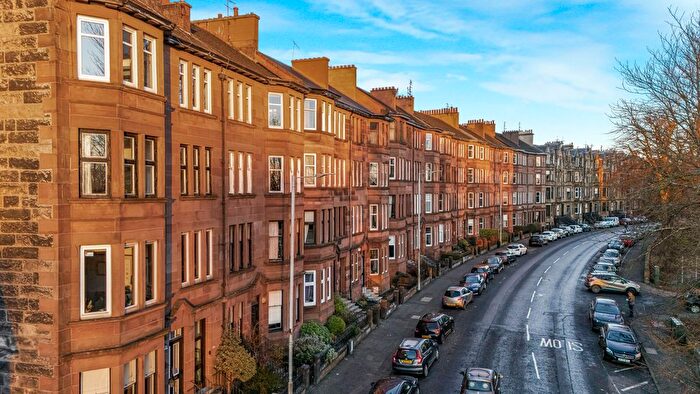
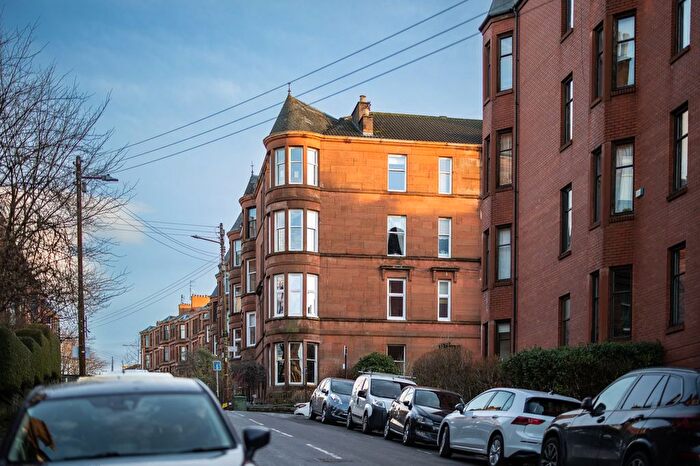
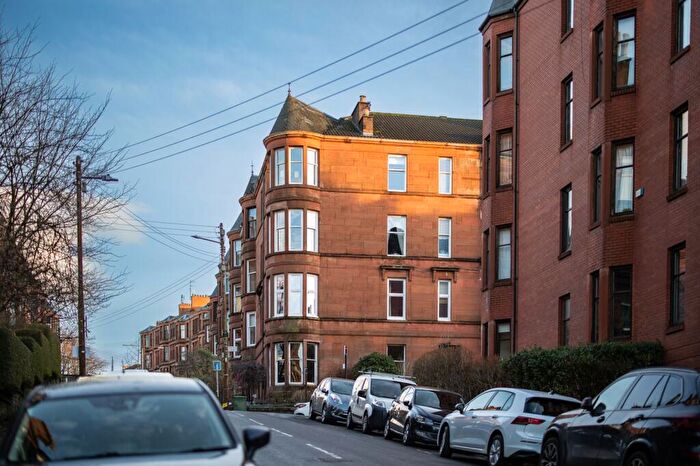
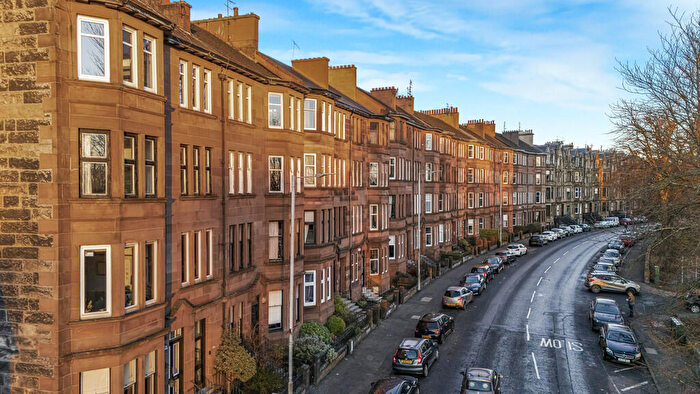
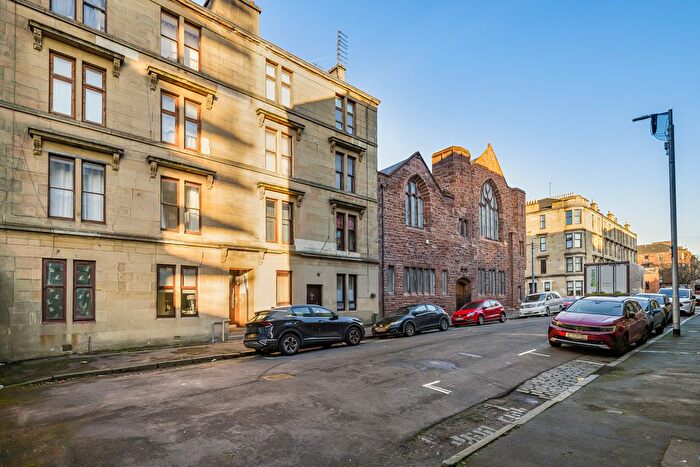
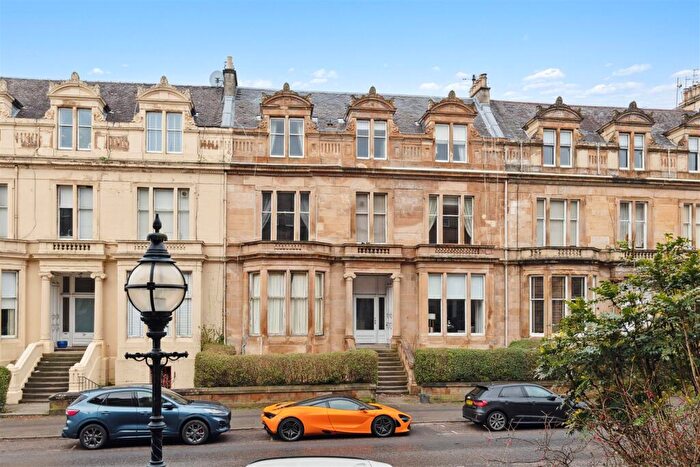
Houses for sale & to rent in Partick East/Kelvindale, Glasgow
House Prices in Partick East/Kelvindale
Properties in Partick East/Kelvindale have an average house price of £336,213.00 and had 932 Property Transactions within the last 3 years¹.
Partick East/Kelvindale is an area in Glasgow, Glasgow City with 13,632 households², where the most expensive property was sold for £3,000,000.00.
Properties for sale in Partick East/Kelvindale
Roads and Postcodes in Partick East/Kelvindale
Navigate through our locations to find the location of your next house in Partick East/Kelvindale, Glasgow for sale or to rent.
Transport near Partick East/Kelvindale
-
Hyndland Station
-
Partick Station
-
Jordanhill Station
-
Anniesland Station
-
Kelvindale Station
-
Maryhill Station
-
Summerston Station
-
Exhibition Centre Glasgow Station
-
Gilshochill Station
-
Charing Cross (Glasgow) Station
- FAQ
- Price Paid By Year
Frequently asked questions about Partick East/Kelvindale
What is the average price for a property for sale in Partick East/Kelvindale?
The average price for a property for sale in Partick East/Kelvindale is £336,213. This amount is 73% higher than the average price in Glasgow. There are 6,511 property listings for sale in Partick East/Kelvindale.
Which train stations are available in or near Partick East/Kelvindale?
Some of the train stations available in or near Partick East/Kelvindale are Hyndland, Partick and Jordanhill.
Property Price Paid in Partick East/Kelvindale by Year
The average sold property price by year was:
| Year | Average Sold Price | Price Change |
Sold Properties
|
|---|---|---|---|
| 2023 | £351,637 | 5% |
130 Properties |
| 2022 | £333,713 | 2% |
802 Properties |
| 2021 | £325,515 | 2% |
1,018 Properties |
| 2020 | £318,925 | 14% |
561 Properties |
| 2019 | £273,135 | -3% |
711 Properties |
| 2018 | £280,840 | 4% |
735 Properties |
| 2017 | £269,099 | 5% |
791 Properties |
| 2016 | £256,121 | 4% |
774 Properties |
| 2015 | £245,458 | 4% |
843 Properties |
| 2014 | £235,230 | 5% |
753 Properties |
| 2013 | £223,411 | -2% |
736 Properties |
| 2012 | £226,862 | -4% |
655 Properties |
| 2011 | £236,092 | 2% |
632 Properties |
| 2010 | £232,291 | 6% |
545 Properties |
| 2009 | £217,584 | -12% |
611 Properties |
| 2008 | £242,940 | -5% |
755 Properties |
| 2007 | £255,817 | 10% |
878 Properties |
| 2006 | £231,037 | 12% |
1,038 Properties |
| 2005 | £204,311 | 4% |
1,057 Properties |
| 2004 | £196,763 | 17% |
1,083 Properties |
| 2003 | £162,818 | 15% |
1,140 Properties |
| 2002 | £137,692 | 16% |
953 Properties |
| 2001 | £115,204 | - |
82 Properties |


