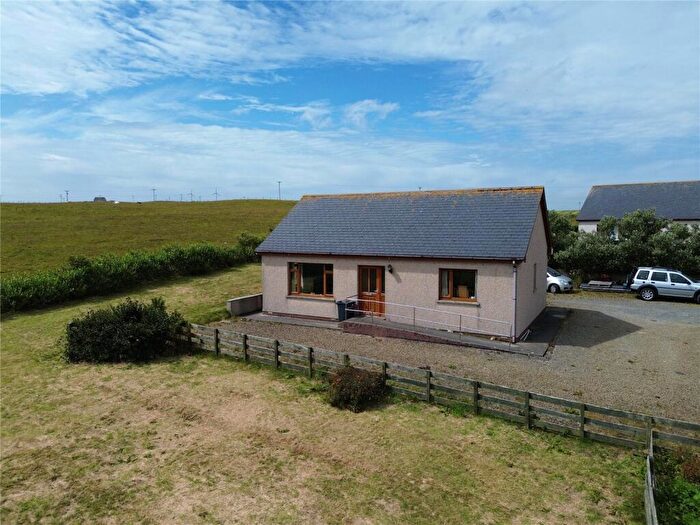
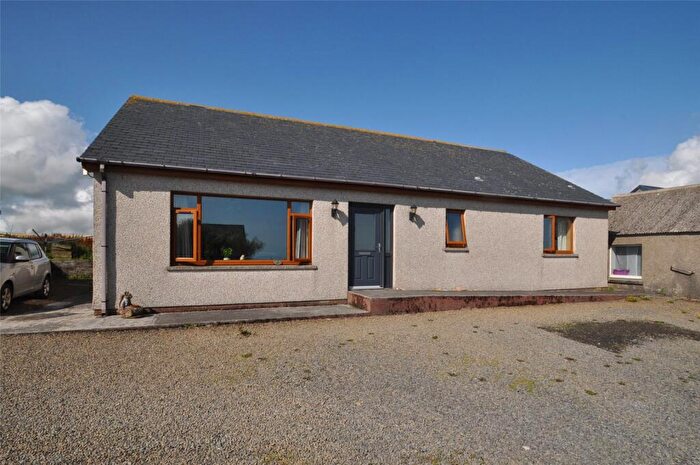
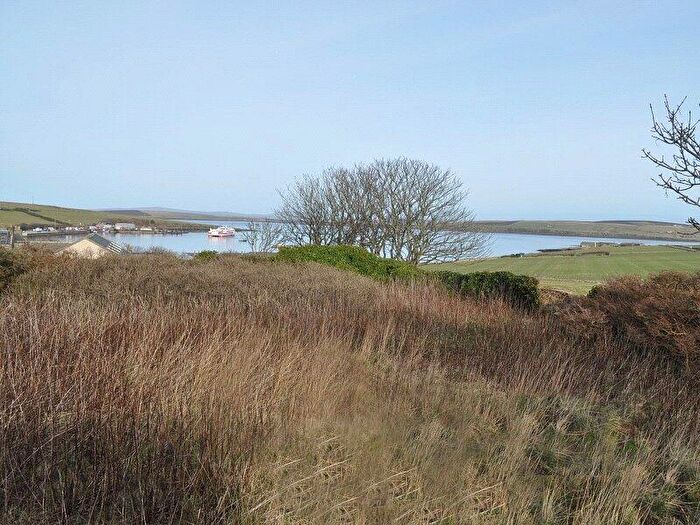
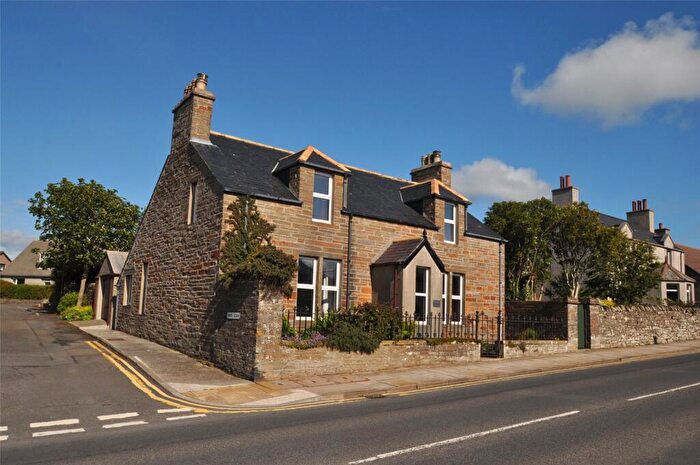
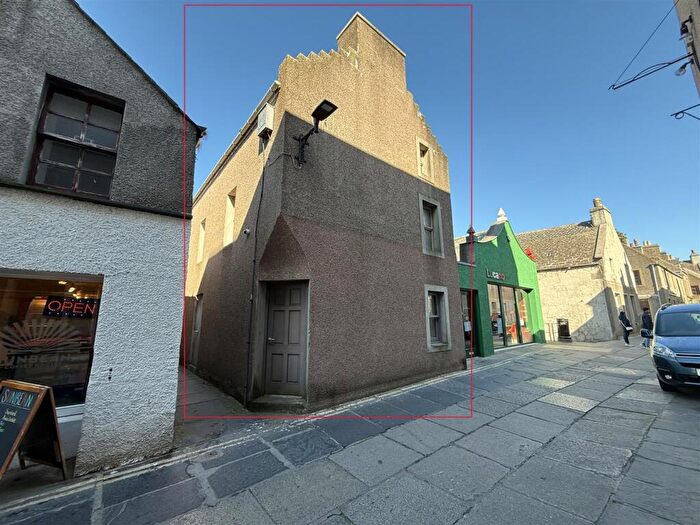
Houses for sale & to rent in East Mainland, South Ronaldsay and Burray, Orkney
House Prices in East Mainland, South Ronaldsay and Burray
Properties in East Mainland, South Ronaldsay and Burray have an average house price of £267,198.00 and had 44 Property Transactions within the last 3 years¹.
East Mainland, South Ronaldsay and Burray is an area in Orkney, Orkney Islands with 1,309 households², where the most expensive property was sold for £465,000.00.
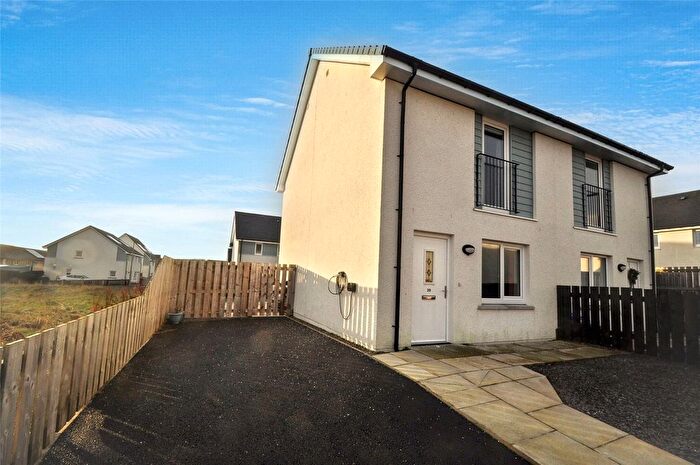
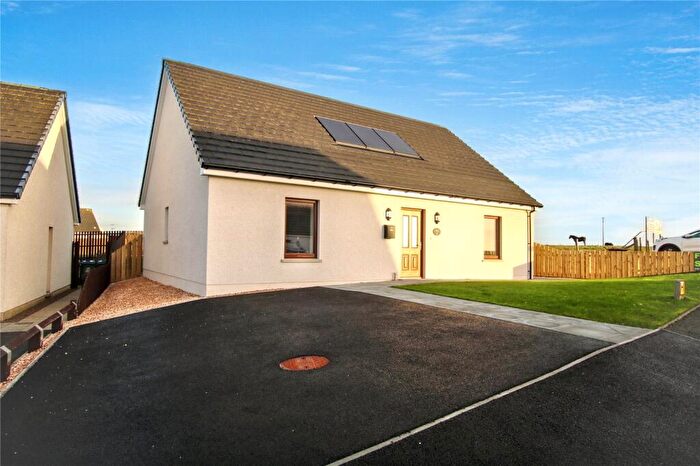
Properties for sale in East Mainland, South Ronaldsay and Burray
Roads and Postcodes in East Mainland, South Ronaldsay and Burray
Navigate through our locations to find the location of your next house in East Mainland, South Ronaldsay and Burray, Orkney for sale or to rent.
| Streets | Postcodes |
|---|---|
| Westhill Road | KW17 2TE |
| Back Road | KW17 2SP |
| Breckan Brae | KW17 2RR |
| Church Road | KW17 2SR |
| Erlend Terrace | KW17 2TP |
| Front Road | KW17 2SL |
| Graeme Park | KW17 2RG |
| Greenfield | KW17 2QN |
| Lairds Road | KW17 2TX |
| Macdonald Park | KW17 2AL |
| Marengo Road | KW17 2TD |
| Ness Road | KW17 2TB |
| Park Of Ayre | KW17 2QZ |
| Sands Park | KW17 2QW |
| School Road | KW17 2TN |
| Station Square | KW17 2SE |
| Storehouse Place | KW17 2TF |
| Sutherland Drive | KW17 2SG |
| Taftingus Place | KW17 2UD |
| Thorfinn Place | KW17 2TR |
| Toab | KW17 2QG |
| Upper Waston Road | KW17 2TT |
| Wards Park | KW17 2TS |
| West End | KW17 2SN |
| KW17 2QH KW17 2QJ KW17 2QL KW17 2QP KW17 2QQ KW17 2QR KW17 2QS KW17 2QT KW17 2QU KW17 2QX KW17 2QY KW17 2RH KW17 2RJ KW17 2RL KW17 2RN KW17 2RS KW17 2RT KW17 2RU KW17 2RW KW17 2RX KW17 2RY KW17 2RZ KW17 2SA KW17 2SB KW17 2SD KW17 2SF KW17 2SH KW17 2SS KW17 2ST KW17 2SU KW17 2SW KW17 2SX KW17 2SY KW17 2SZ KW17 2TA KW17 2TG KW17 2TH KW17 2TJ KW17 2TL KW17 2TQ KW17 2TW KW17 2UG KW17 2AX |
Transport near East Mainland, South Ronaldsay and Burray
- FAQ
- Price Paid By Year
Frequently asked questions about East Mainland, South Ronaldsay and Burray
What is the average price for a property for sale in East Mainland, South Ronaldsay and Burray?
The average price for a property for sale in East Mainland, South Ronaldsay and Burray is £267,198. This amount is 30% higher than the average price in Orkney. There are 550 property listings for sale in East Mainland, South Ronaldsay and Burray.
Which train stations are available in or near East Mainland, South Ronaldsay and Burray?
Some of the train stations available in or near East Mainland, South Ronaldsay and Burray are Thurso, Wick and Georgemas Junction.
Property Price Paid in East Mainland, South Ronaldsay and Burray by Year
The average sold property price by year was:
| Year | Average Sold Price | Price Change |
Sold Properties
|
|---|---|---|---|
| 2023 | £247,840 | -10% |
8 Properties |
| 2022 | £271,500 | 17% |
36 Properties |
| 2021 | £225,772 | 9% |
49 Properties |
| 2020 | £206,173 | 15% |
43 Properties |
| 2019 | £175,660 | 7% |
47 Properties |
| 2018 | £162,489 | -7% |
47 Properties |
| 2017 | £174,195 | 3% |
43 Properties |
| 2016 | £168,605 | 17% |
48 Properties |
| 2015 | £139,933 | -2% |
34 Properties |
| 2014 | £142,595 | 19% |
43 Properties |
| 2013 | £116,028 | -44% |
31 Properties |
| 2012 | £167,438 | 14% |
31 Properties |
| 2011 | £143,546 | 26% |
30 Properties |
| 2010 | £105,966 | -13% |
22 Properties |
| 2009 | £119,487 | 7% |
30 Properties |
| 2008 | £111,692 | -3% |
20 Properties |
| 2007 | £114,923 | -25% |
34 Properties |
| 2006 | £143,318 | 41% |
41 Properties |
| 2005 | £84,613 | 19% |
67 Properties |
| 2004 | £68,640 | -5% |
64 Properties |
| 2003 | £72,050 | 16% |
32 Properties |
| 2002 | £60,711 | 51% |
9 Properties |
| 2001 | £30,000 | -58% |
1 Property |
| 2000 | £47,333 | - |
3 Properties |

