
Houses for sale & to rent in Stromness and South Isles, Stromness
House Prices in Stromness and South Isles
Properties in Stromness and South Isles have an average house price of £194k and had 49 Property Transactions within the last 3 years¹.
Stromness and South Isles is an area in Stromness, Orkney Islands with 1,404 households², where the most expensive property was sold for £407k.
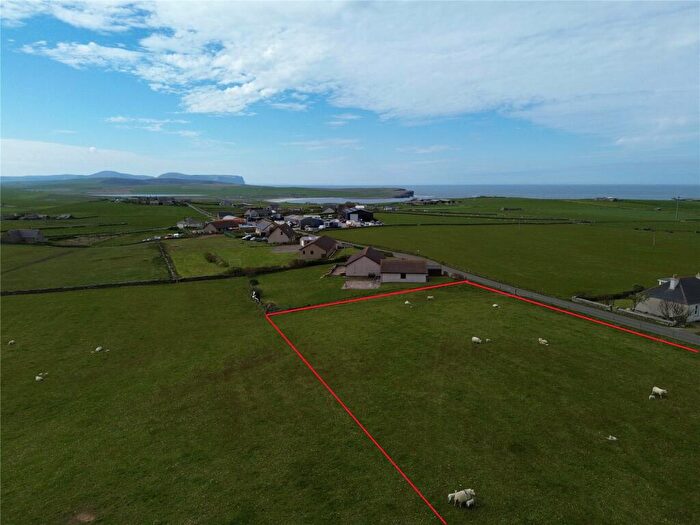
Properties for sale in Stromness and South Isles

![]()
If you are looking to sell your house, let it out, or receive a property valuation, an expert can help you.
Click the button below to get started.


Roads and Postcodes in Stromness and South Isles
Navigate through our locations to find the location of your next house in Stromness and South Isles, Stromness for sale or to rent.
| Streets | Postcodes |
|---|---|
| Alfred Street | KW16 3DF |
| Alfred Terrace | KW16 3DQ |
| Artillery Road | KW16 3NR |
| Back Road | KW16 3AJ KW16 3AW KW16 3AX KW16 3BP KW16 3DS KW16 3DU KW16 3DX |
| Baldry's Road | KW16 3NS |
| Bu Road | KW16 3JH |
| Cairston Drive | KW16 3JL |
| Cairston Road | KW16 3JS KW16 3JT |
| Christies Brae | KW16 3BF |
| Church Road | KW16 3BA KW16 3BT |
| Citadel Crescent | KW16 3EL |
| Citadel Drive | KW16 3EJ |
| Coplands Drive | KW16 3BN |
| Coplands Road | KW16 3BW |
| Downies Lane | KW16 3EP |
| Dundas Street | KW16 3BZ KW16 3DA |
| Ferry Road | KW16 3AE KW16 3BH |
| Franklin Road | KW16 3AN KW16 3AR KW16 3DZ |
| French Road | KW16 3NW |
| Garson Drive | KW16 3JG |
| Garson Industrial Estate | KW16 3AF |
| Garson Park | KW16 3BL |
| Garson Place | KW16 3EE |
| Garson Way | KW16 3EF |
| Graham Place | KW16 3BY |
| Grieveship Brae | KW16 3BG |
| Grieveship Road | KW16 3AZ |
| Grieveship Terrace | KW16 3AY |
| Guardhouse Park | KW16 3DP |
| Hellihole Road | KW16 3DE KW16 3DY |
| Hillside Park | KW16 3HJ |
| Hillside Road | KW16 3AH KW16 3HR |
| Hillside Terrace | KW16 3AQ |
| John Street | KW16 3AD |
| Khyber Pass | KW16 3DB |
| Knockhall Drive | KW16 3EQ |
| Manse Lane | KW16 3AP KW16 3BX |
| Manse Park | KW16 3AU |
| Mayburn Court | KW16 3DH |
| Melvin Place | KW16 3DD |
| Ness Road | KW16 3DL KW16 3DW |
| North End Road | KW16 3AG KW16 3LH |
| Pumpwell Park | KW16 3AT KW16 3EA |
| Queen Street | KW16 3AL |
| Raes Close | KW16 3ED |
| South End | KW16 3DJ |
| Springfield Crescent | KW16 3AS |
| St Colms Quadrant | KW16 3PH |
| St Peters Park | KW16 3EH |
| Victoria Street | KW16 3AA KW16 3BB KW16 3BS KW16 3BU |
| Well Park | KW16 3DN |
| White House Lane | KW16 3DG |
| Yorston Drive | KW16 3ER |
| KW16 3BQ KW16 3DR KW16 3DT KW16 3EB KW16 3EU KW16 3EX KW16 3HS KW16 3HT KW16 3HU KW16 3JJ KW16 3JN KW16 3JP KW16 3JQ KW16 3JR KW16 3JU KW16 3JW KW16 3LE KW16 3LJ KW16 3LL KW16 3LN KW16 3NG KW16 3NJ KW16 3NP KW16 3NQ KW16 3NT KW16 3NU KW16 3NX KW16 3NY KW16 3NZ KW16 3PA KW16 3PG KW16 3PQ KW16 9AB |
Transport near Stromness and South Isles
-
 Thurso Station
 -
Georgemas Junction Station
-
Scotscalder Station
-
Wick Station
-
Altnabreac Station
-
Forsinard Station
- FAQ
- Price Paid By Year
Frequently asked questions about Stromness and South Isles
What is the average price for a property for sale in Stromness and South Isles?
The average price for a property for sale in Stromness and South Isles is £193,929. This amount is 1% lower than the average price in Stromness. There are 236 property listings for sale in Stromness and South Isles.
What streets have the most expensive properties for sale in Stromness and South Isles?
The streets with the most expensive properties for sale in Stromness and South Isles are South End at an average of £407,000, Ferry Road at an average of £307,000 and Hillside Road at an average of £265,166.
What streets have the most affordable properties for sale in Stromness and South Isles?
The streets with the most affordable properties for sale in Stromness and South Isles are Khyber Pass at an average of £120,000, John Street at an average of £130,083 and Citadel Crescent at an average of £133,666.
Which train stations are available in or near Stromness and South Isles?
Some of the train stations available in or near Stromness and South Isles are Thurso, Georgemas Junction and Scotscalder.
Property Price Paid in Stromness and South Isles by Year
The average sold property price by year was:
| Year | Average Sold Price | Price Change |
Sold Properties
|
|---|---|---|---|
| 2025 | £199,464 | -1% |
14 Properties |
| 2024 | £201,802 | 12% |
20 Properties |
| 2023 | £178,267 | -36% |
15 Properties |
| 2022 | £242,761 | 29% |
51 Properties |
| 2021 | £171,972 | 3% |
65 Properties |
| 2020 | £166,634 | 11% |
50 Properties |
| 2019 | £148,043 | 1% |
55 Properties |
| 2018 | £147,025 | 18% |
56 Properties |
| 2017 | £121,122 | -6% |
56 Properties |
| 2016 | £128,869 | -6% |
49 Properties |
| 2015 | £136,899 | 11% |
52 Properties |
| 2014 | £122,366 | -0,1% |
44 Properties |
| 2013 | £122,522 | - |
31 Properties |
| 2012 | £122,537 | 7% |
27 Properties |
| 2011 | £113,710 | 8% |
25 Properties |
| 2010 | £105,153 | -6% |
34 Properties |
| 2009 | £111,910 | 11% |
45 Properties |
| 2008 | £99,510 | 7% |
42 Properties |
| 2007 | £92,664 | -18% |
43 Properties |
| 2006 | £109,106 | -94% |
48 Properties |
| 2005 | £211,743 | 75% |
43 Properties |
| 2004 | £52,164 | 8% |
40 Properties |
| 2003 | £48,148 | 11% |
30 Properties |
| 2002 | £42,798 | -3% |
13 Properties |
| 2001 | £43,928 | -33% |
14 Properties |
| 2000 | £58,250 | - |
4 Properties |