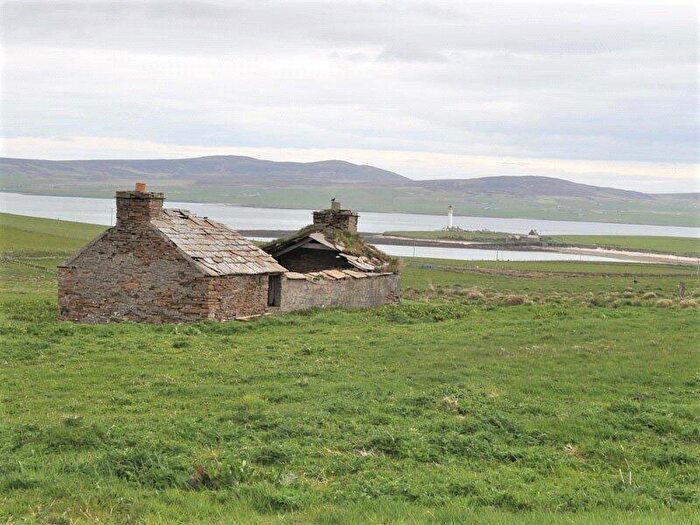
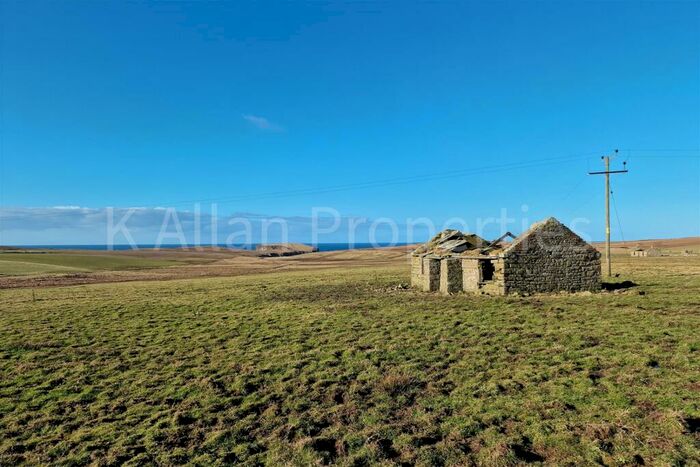
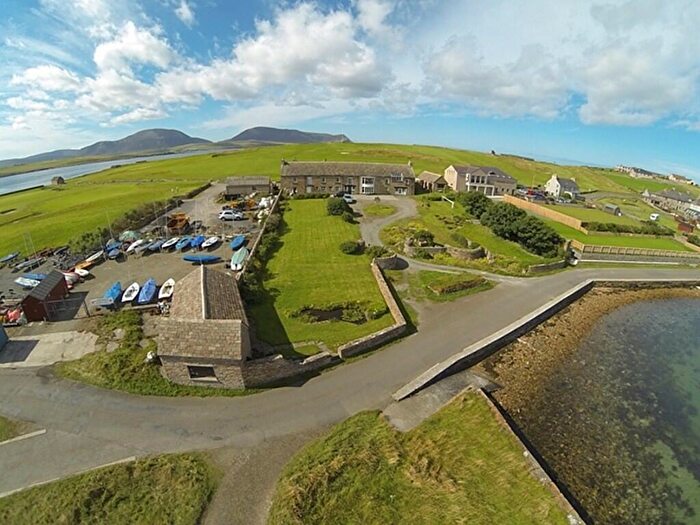
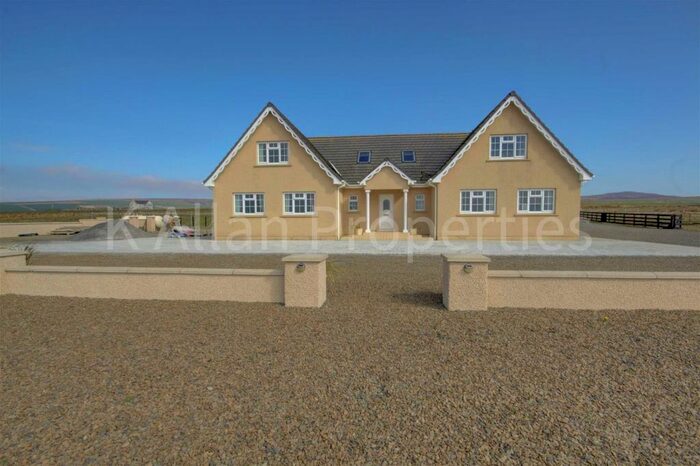
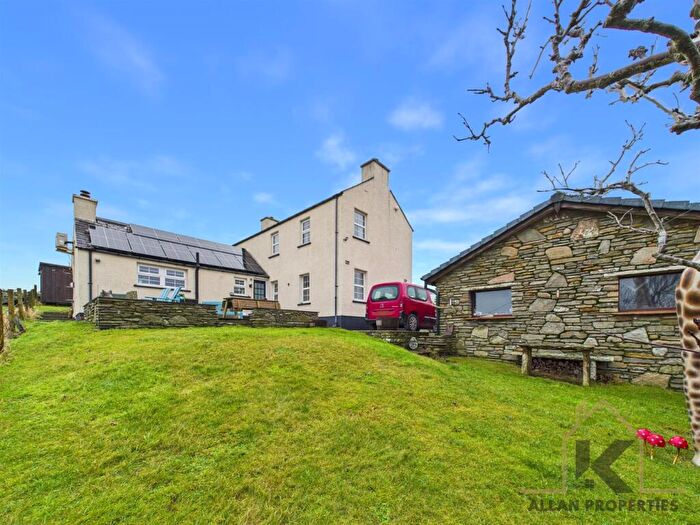
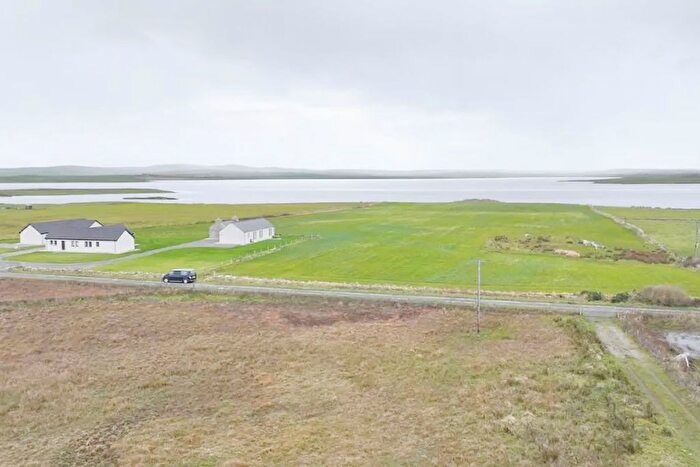
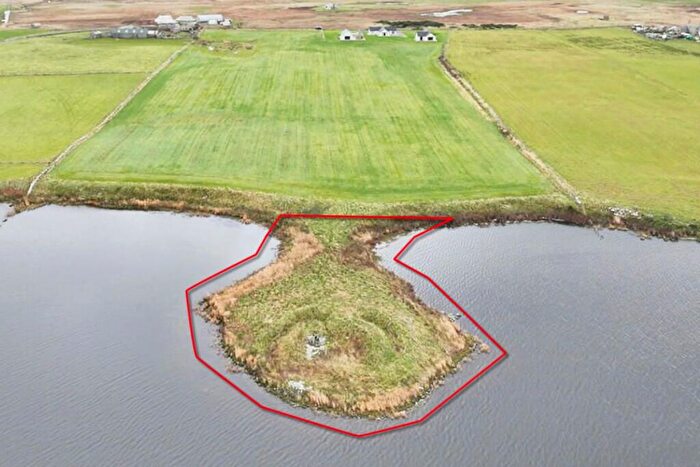
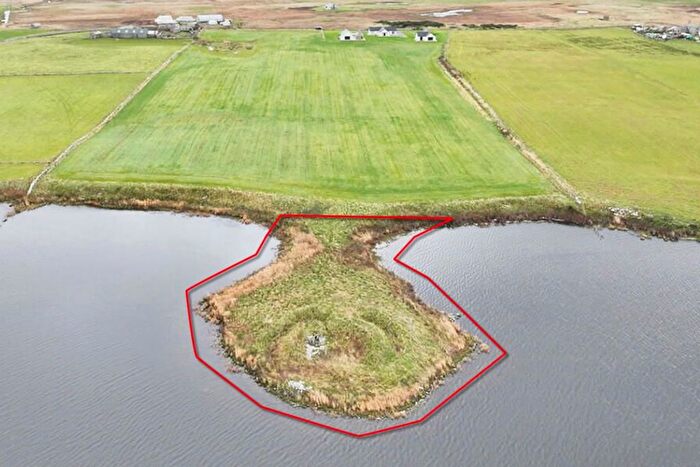
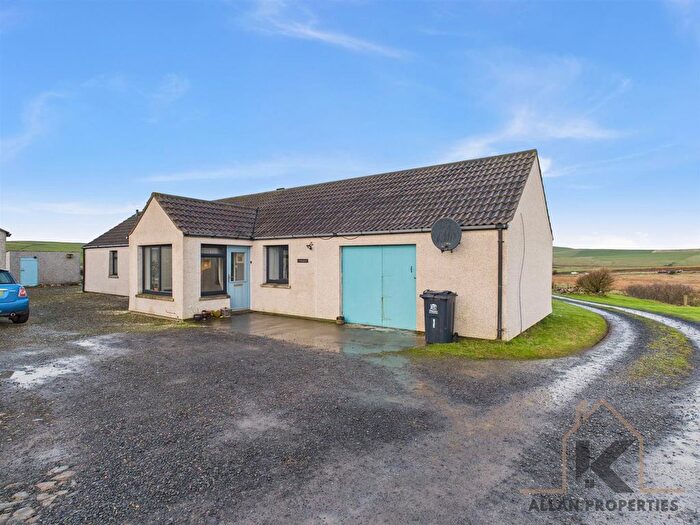
Houses for sale & to rent in West Mainland, Stromness
House Prices in West Mainland
Properties in West Mainland have an average house price of £281,465.00 and had 3 Property Transactions within the last 3 years¹.
West Mainland is an area in Stromness, Orkney Islands with 385 households², where the most expensive property was sold for £342,395.00.
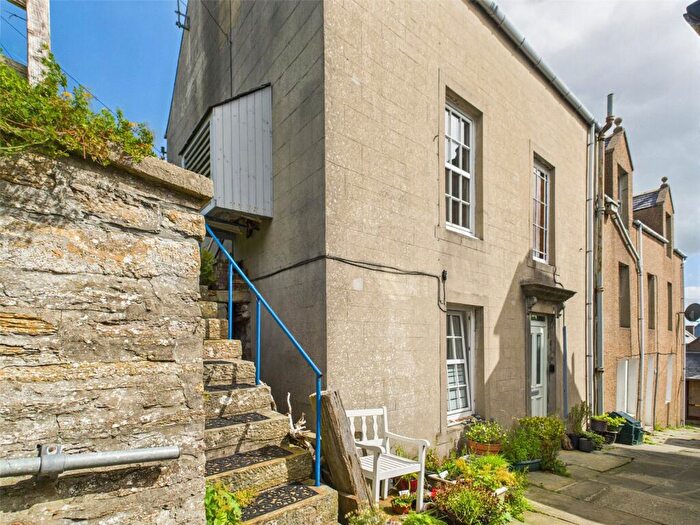
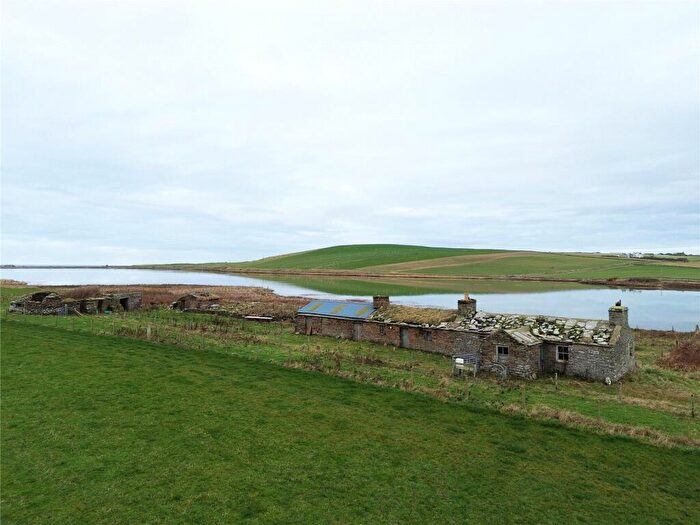
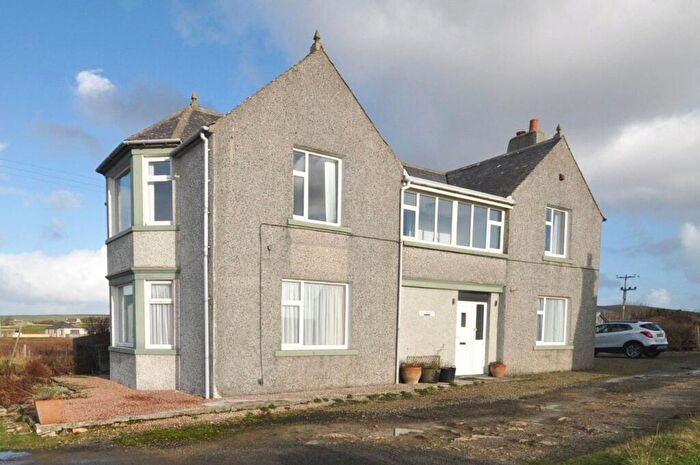
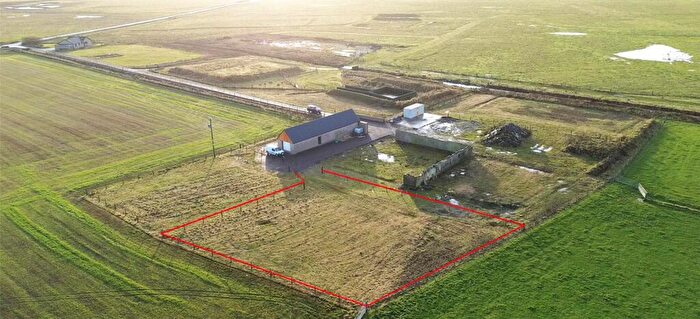
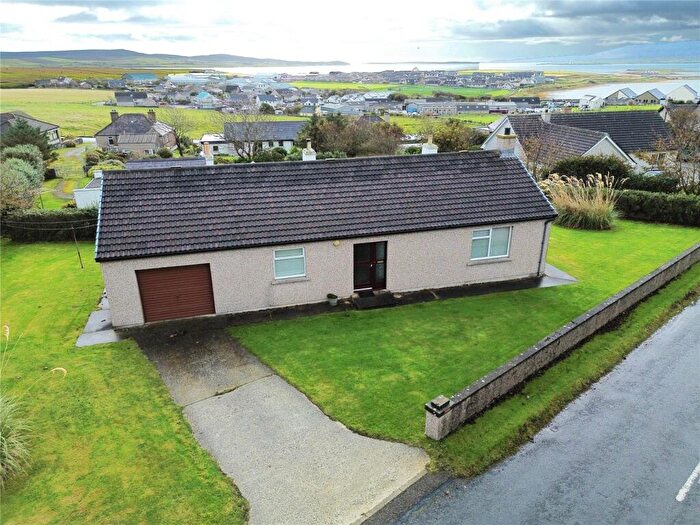
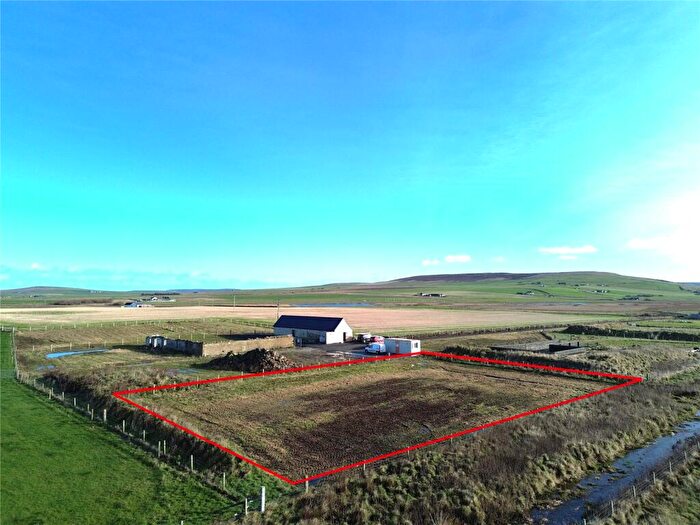
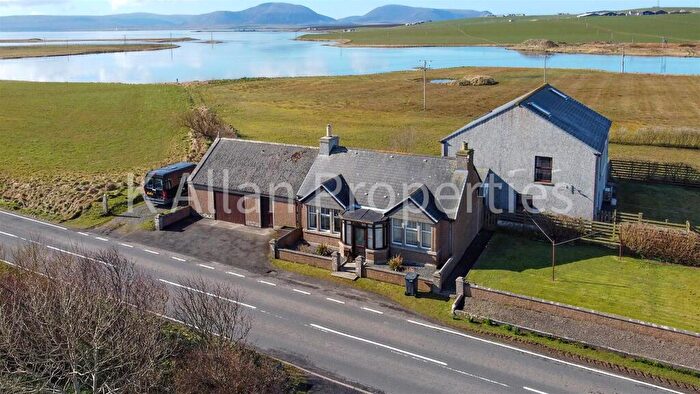
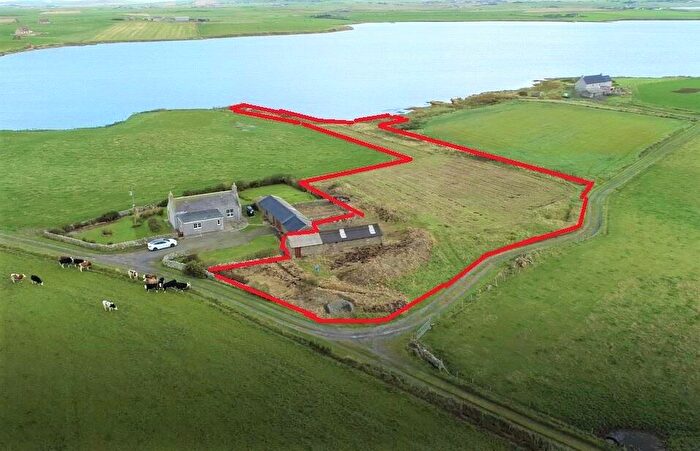
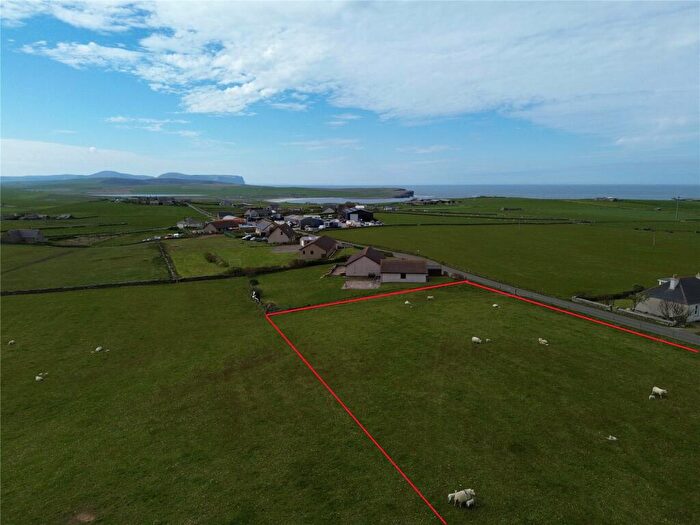
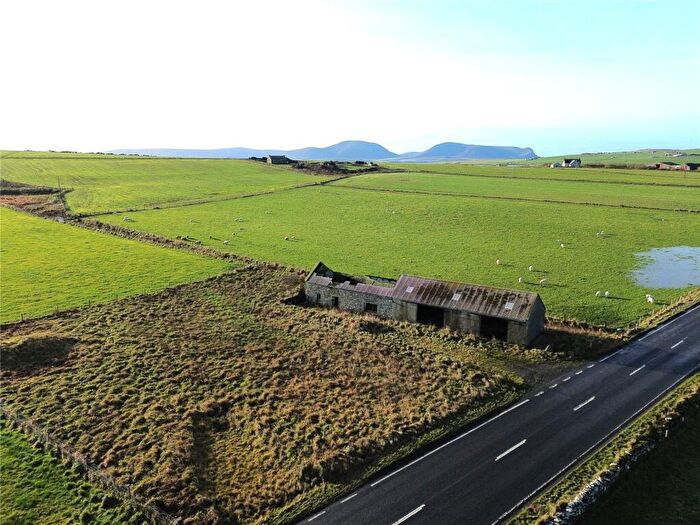
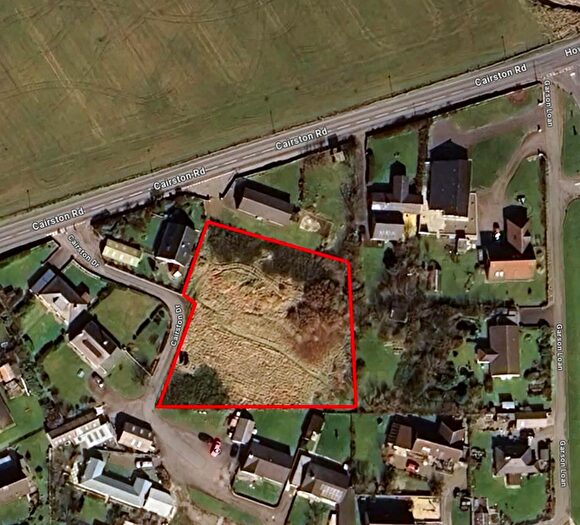
Properties for sale in West Mainland
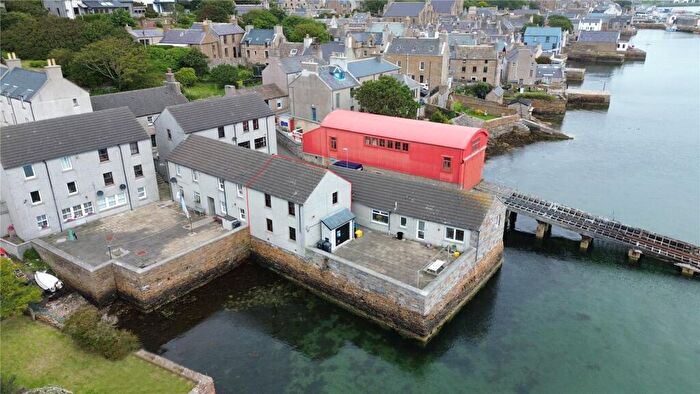
Previously listed properties in West Mainland
Roads and Postcodes in West Mainland
Navigate through our locations to find the location of your next house in West Mainland, Stromness for sale or to rent.
| Streets | Postcodes |
|---|---|
| Daisybank | KW16 3LZ |
| The Fidges | KW16 3LF |
| KW16 3EY KW16 3EZ KW16 3HA KW16 3HE KW16 3HF KW16 3HG KW16 3HH KW16 3HQ KW16 3HX KW16 3HY KW16 3HZ KW16 3JA KW16 3JB KW16 3JD KW16 3JE KW16 3JF KW16 3JX KW16 3JY KW16 3JZ KW16 3LA KW16 3LB KW16 3LP KW16 3LR KW16 3LS KW16 3LT KW16 3LU KW16 3LW KW16 3LX KW16 3LY |
Transport near West Mainland
- FAQ
- Price Paid By Year
Frequently asked questions about West Mainland
What is the average price for a property for sale in West Mainland?
The average price for a property for sale in West Mainland is £281,465. This amount is 42% higher than the average price in Stromness. There are 200 property listings for sale in West Mainland.
Which train stations are available in or near West Mainland?
Some of the train stations available in or near West Mainland are Thurso, Georgemas Junction and Scotscalder.
Property Price Paid in West Mainland by Year
The average sold property price by year was:
| Year | Average Sold Price | Price Change |
Sold Properties
|
|---|---|---|---|
| 2023 | £281,465 | 11% |
3 Properties |
| 2022 | £250,000 | 17% |
12 Properties |
| 2021 | £206,599 | 13% |
16 Properties |
| 2020 | £180,239 | -9% |
11 Properties |
| 2019 | £195,821 | 25% |
14 Properties |
| 2018 | £147,285 | -16% |
7 Properties |
| 2017 | £170,700 | 7% |
15 Properties |
| 2016 | £159,324 | -11% |
14 Properties |
| 2015 | £176,538 | 49% |
13 Properties |
| 2014 | £89,573 | -34% |
17 Properties |
| 2013 | £120,045 | -20% |
11 Properties |
| 2012 | £144,166 | -14% |
9 Properties |
| 2011 | £164,148 | 1% |
10 Properties |
| 2010 | £162,875 | 35% |
10 Properties |
| 2009 | £106,214 | -34% |
7 Properties |
| 2008 | £142,772 | 7% |
11 Properties |
| 2007 | £132,340 | 26% |
15 Properties |
| 2006 | £98,166 | 6% |
6 Properties |
| 2005 | £92,627 | 36% |
23 Properties |
| 2004 | £59,373 | -142% |
13 Properties |
| 2003 | £143,619 | 67% |
11 Properties |
| 2002 | £47,500 | -40% |
1 Property |
| 2001 | £66,666 | 21% |
3 Properties |
| 2000 | £52,500 | - |
2 Properties |

