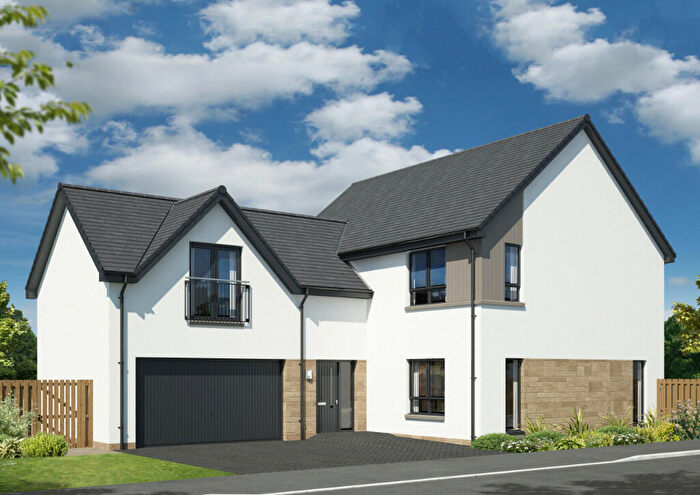
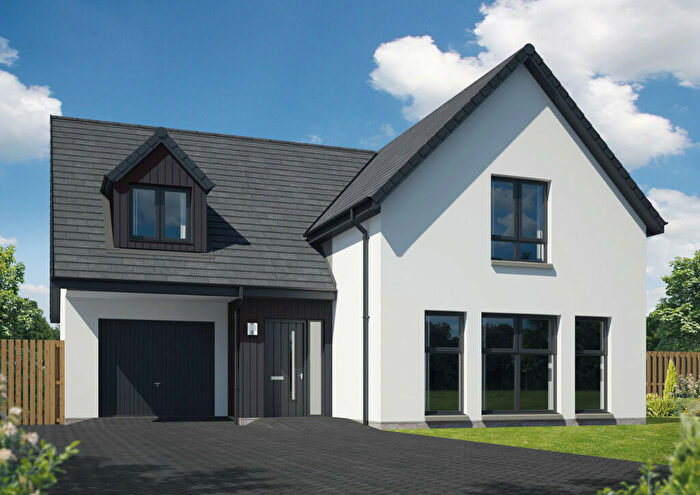
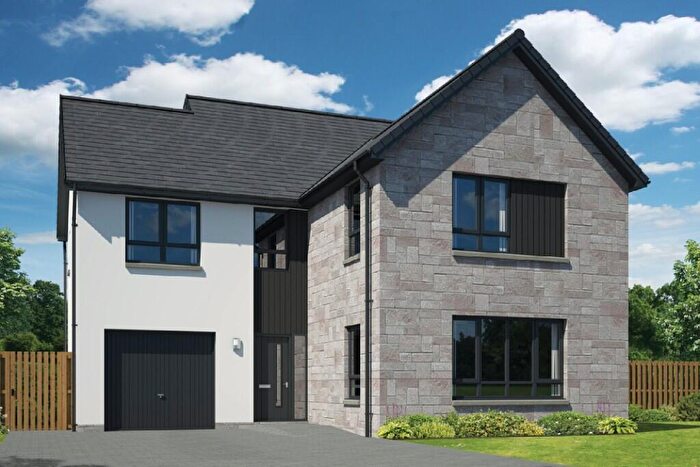
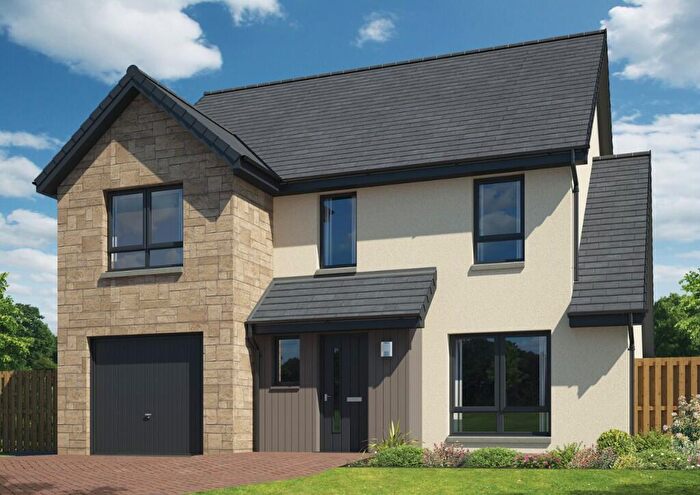
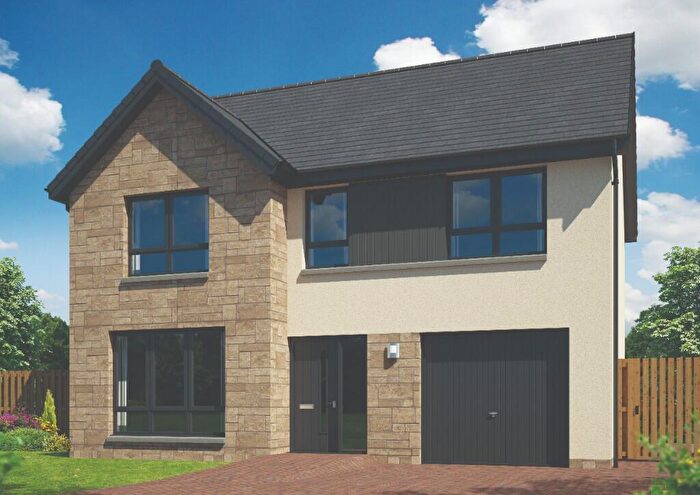
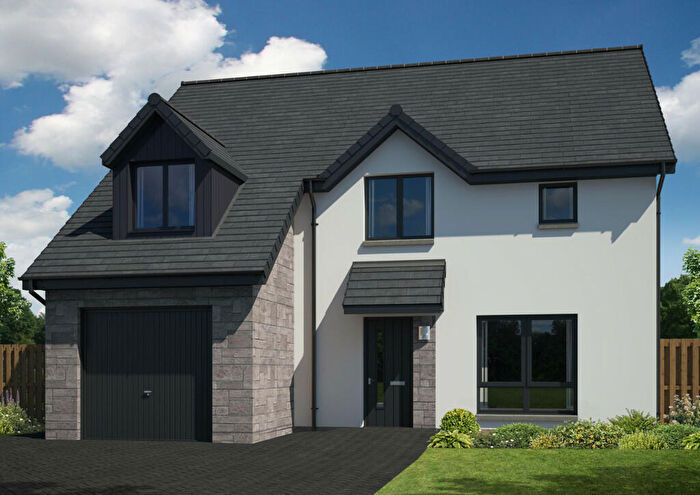
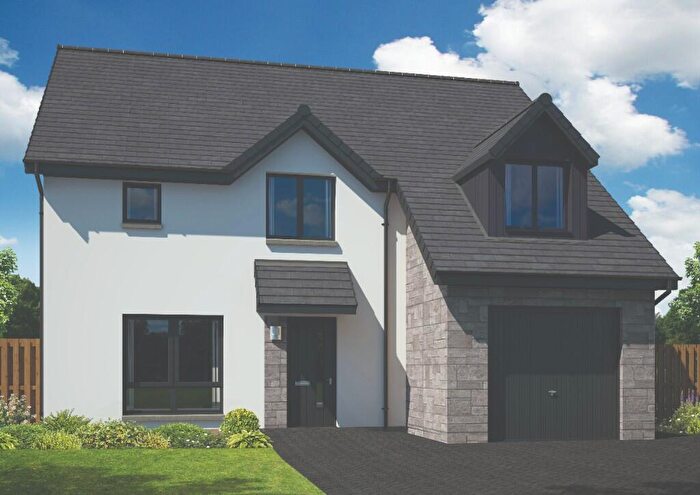
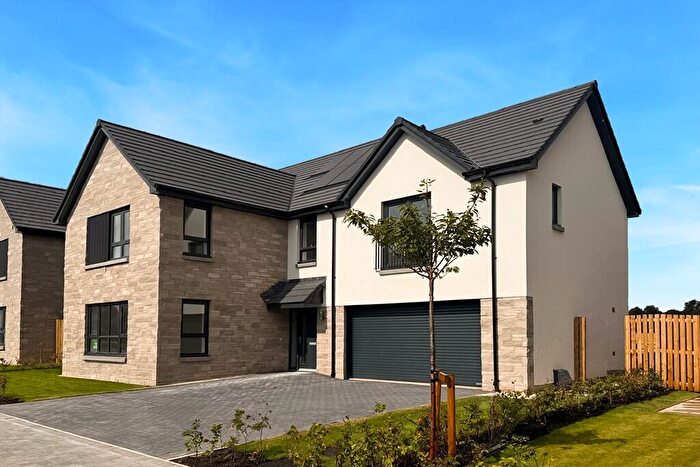
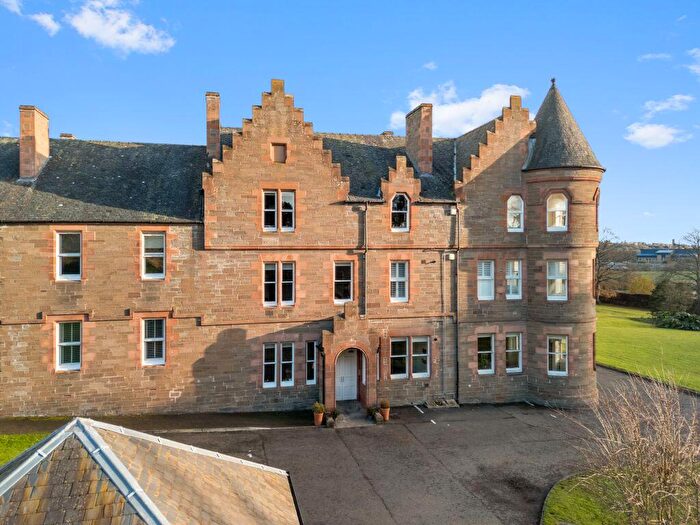
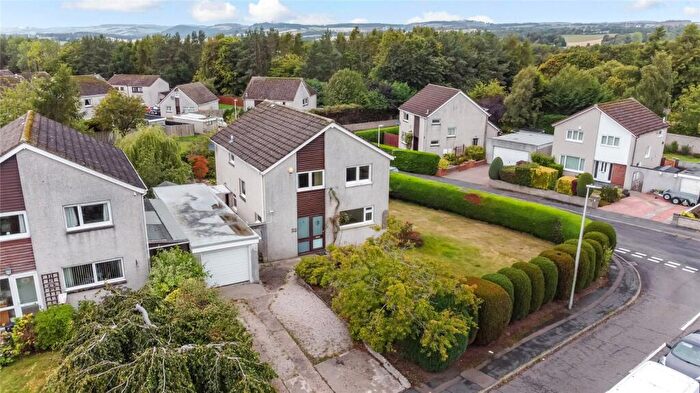
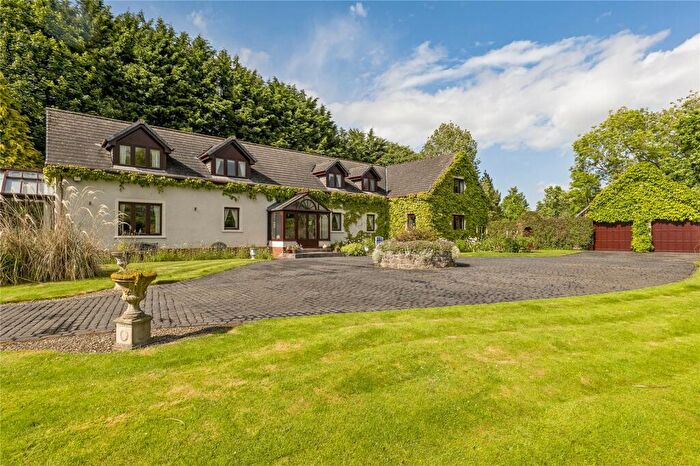
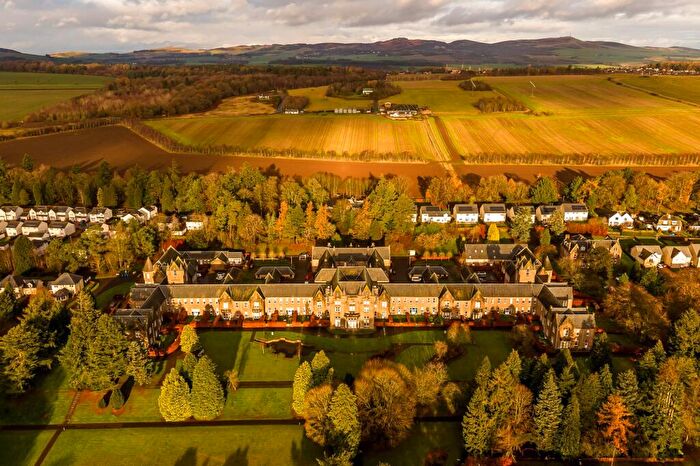
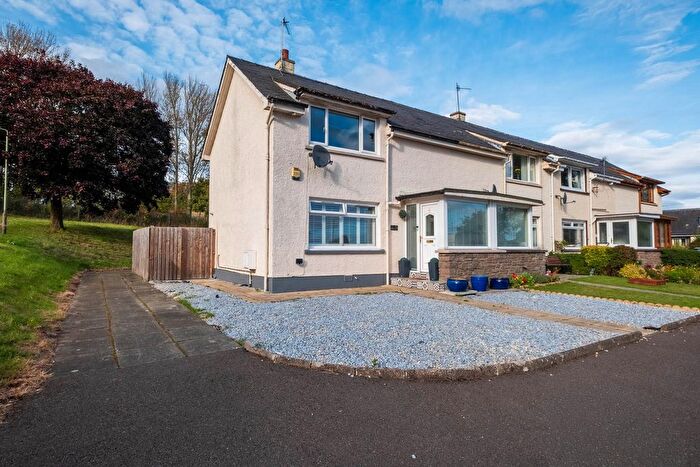
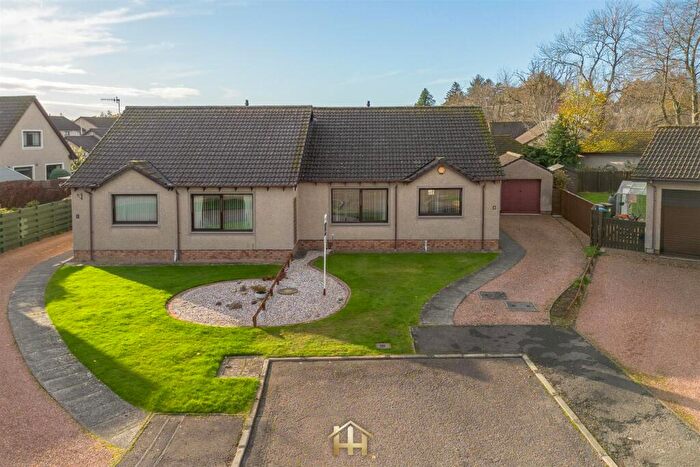
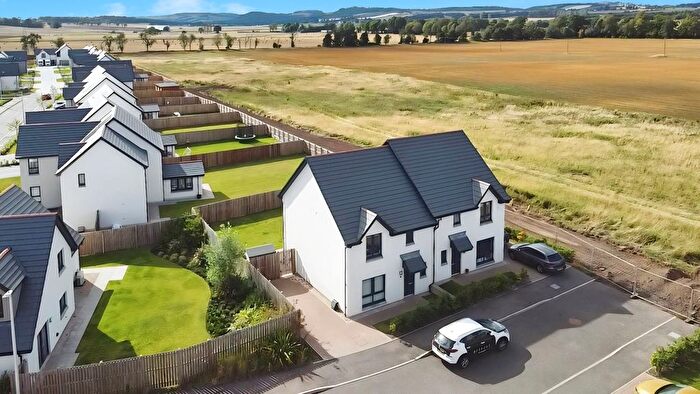
Houses for sale & to rent in Carse of Gowrie, Dundee
House Prices in Carse of Gowrie
Properties in Carse of Gowrie have an average house price of £198,709.00 and had 52 Property Transactions within the last 3 years¹.
Carse of Gowrie is an area in Dundee, Perth and Kinross with 1,431 households², where the most expensive property was sold for £1,500,000.00.
Properties for sale in Carse of Gowrie
Previously listed properties in Carse of Gowrie
Roads and Postcodes in Carse of Gowrie
Navigate through our locations to find the location of your next house in Carse of Gowrie, Dundee for sale or to rent.
| Streets | Postcodes |
|---|---|
| Alastair Soutar Crescent | DD2 5BL DD2 5BN |
| Bayview Road | DD2 5AR |
| Boniface Gardens | DD2 5RS |
| Boniface Place | DD2 5DR |
| Boniface Road | DD2 5DW |
| Braehead Road | DD2 5DD |
| Burnside Road | DD2 5JL |
| Carse Place | DD2 5BH |
| Carselea Road | DD2 5AW |
| Castle Grove | DD2 5HZ |
| Castle Huntly | DD2 5HL DD2 5JF |
| Castle Road | DD2 5HA |
| Dargie Road | DD2 5AS |
| Dorward Place | DD2 5EB |
| Dryburgh Terrace | DD2 5AZ |
| Eastbank Place | DD2 5EQ |
| Eastbank Steading | DD2 5FE |
| Errol Road | DD2 5AD DD2 5AF DD2 5AG DD2 5BX DD2 5BY DD2 5BZ DD2 5DA DD2 5DB |
| Falkland Place | DD2 5DY |
| George Place | DD2 5AQ |
| Gowrie Crescent | DD2 5AX |
| Greystane Road | DD2 5JQ |
| Greystane Terrace | DD2 5RH |
| Hunter Crescent | DD2 5AU |
| Inverbay | DD2 5DQ |
| Johnston Avenue | DD2 5AY |
| Kingoodie | DD2 5DE |
| Kings Mason | DD2 5DJ |
| Kingswell Road | DD2 5FJ |
| Linlithgow Place | DD2 5DG |
| Main Street | DD2 5AA DD2 5AB DD2 5BA DD2 5BD DD2 5BE DD2 5EA DD2 5EP DD2 5ET DD2 5EU DD2 5EW DD2 5HB |
| Mary Findlay Drive | DD2 5JE |
| Mcdonald Road | DD2 5BW |
| Mill Road | DD2 5BB |
| Morris Place | DD2 5AJ |
| Mylnefield Cottages | DD2 5BU |
| Mylnefield Road | DD2 5AT |
| Noble Avenue | DD2 5AL DD2 5AN |
| Norval Place | DD2 5ER |
| Park Road | DD2 5AH |
| Paterson Place | DD2 5HE |
| Peter Arbuckle Place | DD2 5AE |
| Rawes Farm Steading | DD2 5BF |
| Redcliffs | DD2 5DL |
| Rosamunde Pilcher Drive | DD2 5EF |
| Smiths Court | DD2 5ED |
| Station Crescent | DD2 5DT |
| Station Road | DD2 5AP DD2 5DU DD2 5EX |
| Station Terrace | DD2 5DS |
| The Avenue | DD2 5HN |
| The Court | DD2 5BQ |
| The Drive | DD2 5HY |
| The Neuk | DD2 5DX |
| The Shore | DD2 5DH |
| The Stables | DD2 5FD |
| Wallace Place | DD2 5EE |
| Westbank Road | DD2 5FB |
| Wood Loan | DD2 5HF |
| Woodland Way | DD2 5DZ |
| Worbey Place | DD2 5BS |
| DD2 5DN DD2 5DP DD2 5EH DD2 5EJ DD2 5EL DD2 5EN DD2 5EY DD2 5EZ DD2 5HG DD2 5HH DD2 5HJ DD2 5HP DD2 5HQ DD2 5HR DD2 5HS DD2 5HT DD2 5HU DD2 5HW DD2 5LD DD2 5LG DD2 5LH |
Transport near Carse of Gowrie
- FAQ
- Price Paid By Year
Frequently asked questions about Carse of Gowrie
What is the average price for a property for sale in Carse of Gowrie?
The average price for a property for sale in Carse of Gowrie is £198,709. There are 286 property listings for sale in Carse of Gowrie.
Which train stations are available in or near Carse of Gowrie?
Some of the train stations available in or near Carse of Gowrie are Invergowrie, Dundee and Broughty Ferry.
Property Price Paid in Carse of Gowrie by Year
The average sold property price by year was:
| Year | Average Sold Price | Price Change |
Sold Properties
|
|---|---|---|---|
| 2023 | £150,214 | -37% |
7 Properties |
| 2022 | £206,253 | -6% |
45 Properties |
| 2021 | £217,612 | 3% |
82 Properties |
| 2020 | £211,392 | 9% |
48 Properties |
| 2019 | £191,803 | 7% |
56 Properties |
| 2018 | £178,075 | -15% |
44 Properties |
| 2017 | £205,066 | 22% |
65 Properties |
| 2016 | £159,066 | -30% |
55 Properties |
| 2015 | £206,480 | 2% |
64 Properties |
| 2014 | £201,604 | 14% |
51 Properties |
| 2013 | £173,101 | 13% |
42 Properties |
| 2012 | £150,527 | -7% |
41 Properties |
| 2011 | £161,038 | -8% |
41 Properties |
| 2010 | £174,315 | -15% |
41 Properties |
| 2009 | £200,134 | 29% |
40 Properties |
| 2008 | £141,384 | -21569,7% |
62 Properties |
| 2007 | £30,637,469 | 100% |
64 Properties |
| 2006 | £138,515 | 18% |
77 Properties |
| 2005 | £114,146 | 15% |
87 Properties |
| 2004 | £96,625 | -2% |
105 Properties |
| 2003 | £98,423 | 9% |
88 Properties |
| 2002 | £89,189 | 11% |
119 Properties |
| 2001 | £79,117 | - |
12 Properties |

