
Houses for sale & to rent in PA2 8AT, Ochil Drive, Paisley Southeast, Paisley
House Prices in PA2 8AT, Ochil Drive, Paisley Southeast
Properties in PA2 8AT have no sales history available within the last 3 years. PA2 8AT is a postcode in Ochil Drive located in Paisley Southeast, an area in Paisley, Renfrewshire, with 11 households².
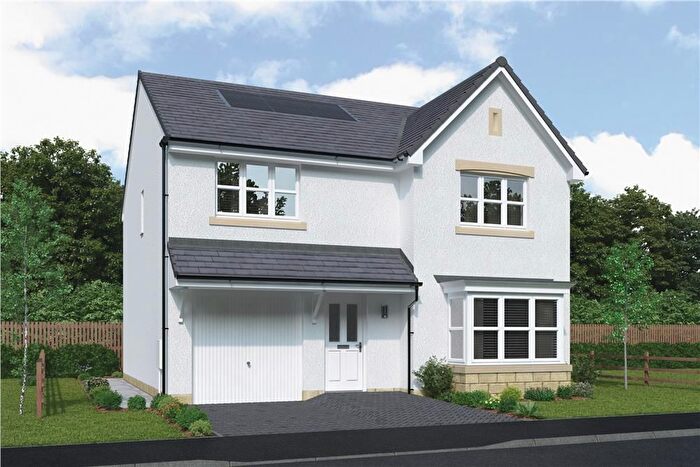
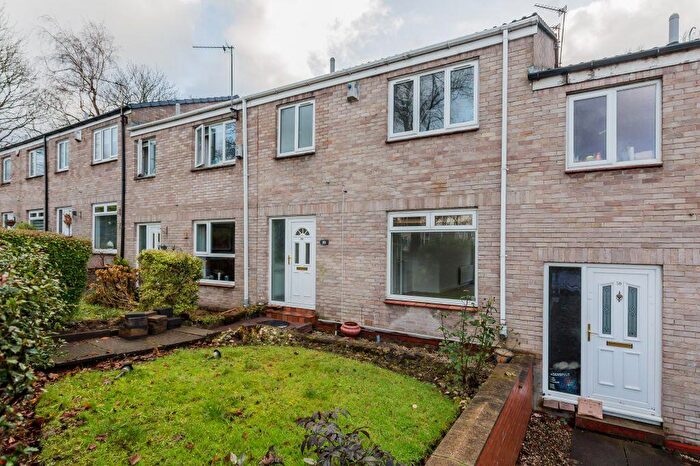
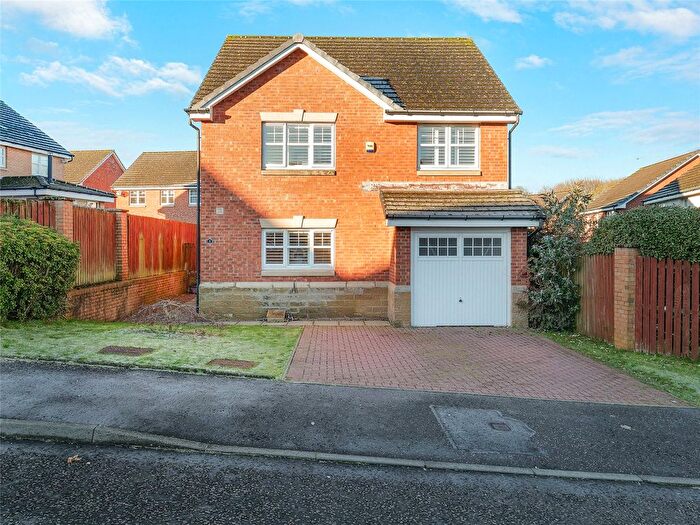
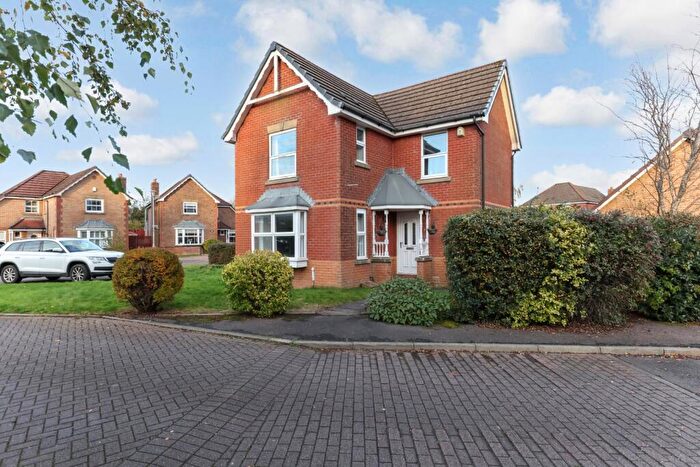
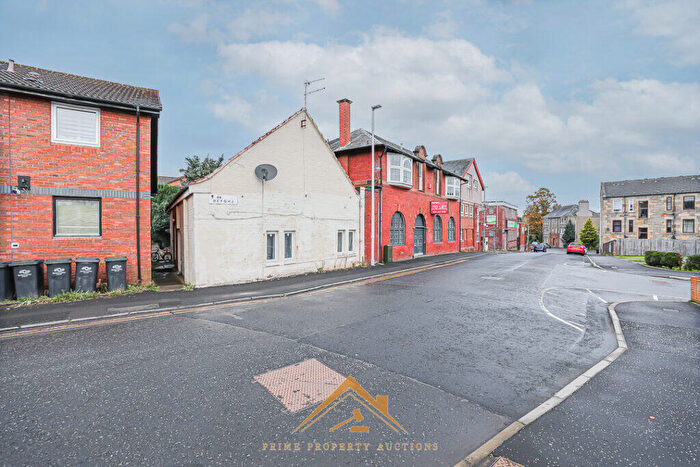
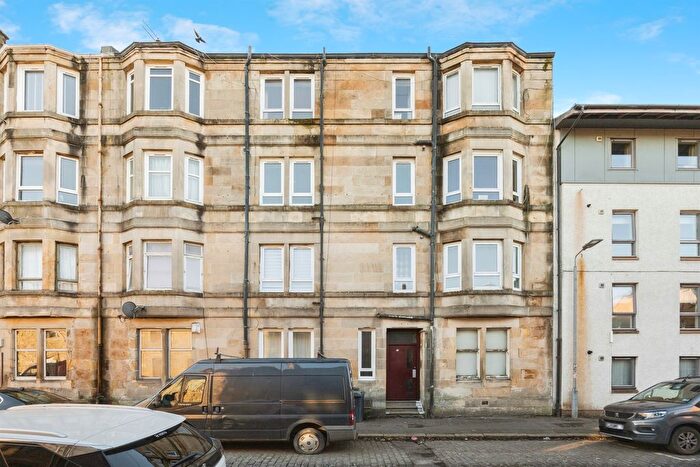
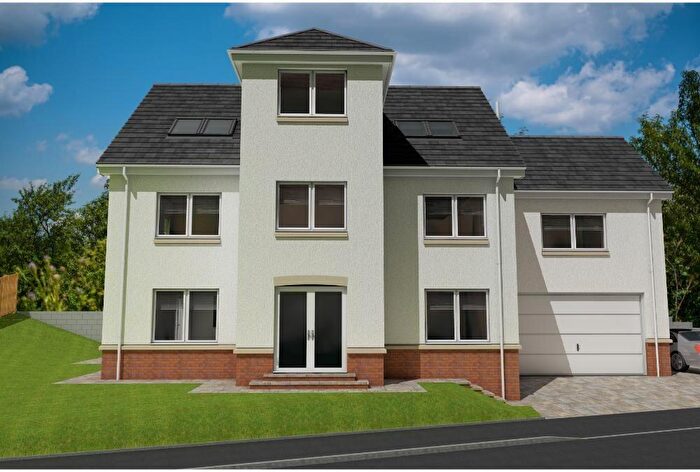
Properties for sale near PA2 8AT, Ochil Drive
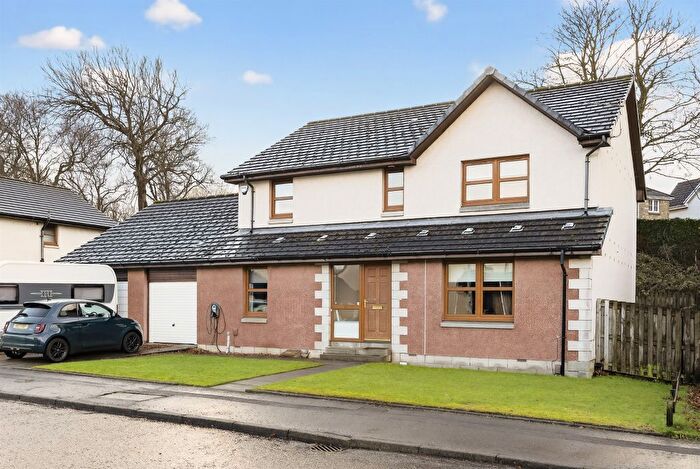

![]()
If you are looking to sell your house, let it out, or receive a property valuation, an expert can help you.
Click the button below to get started.
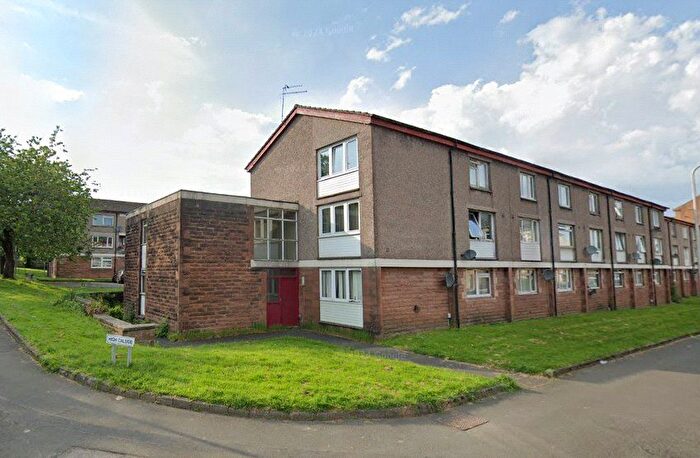
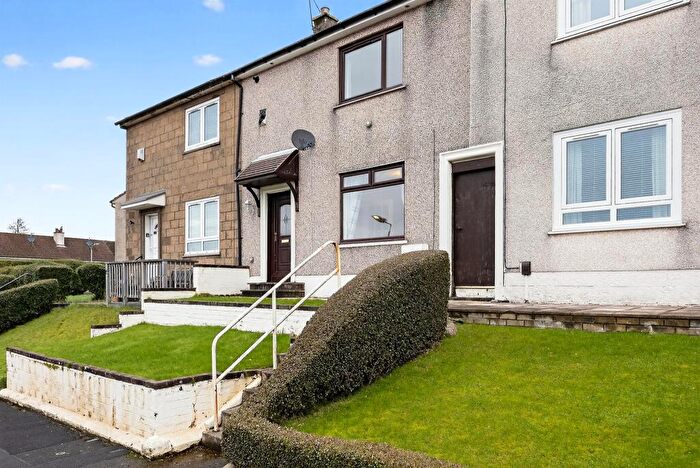

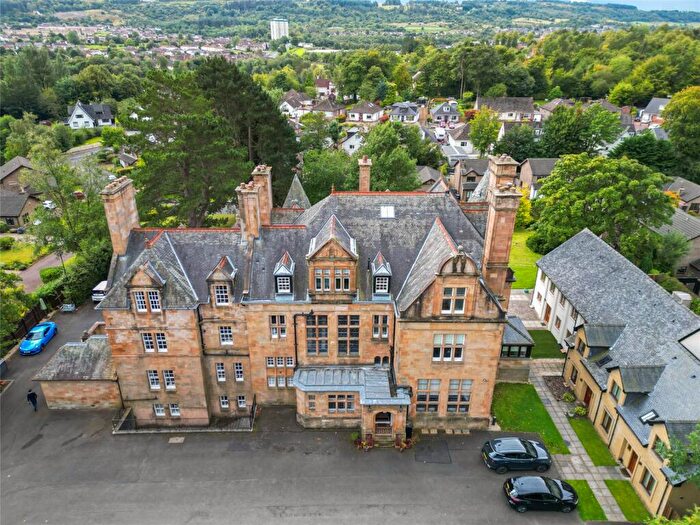
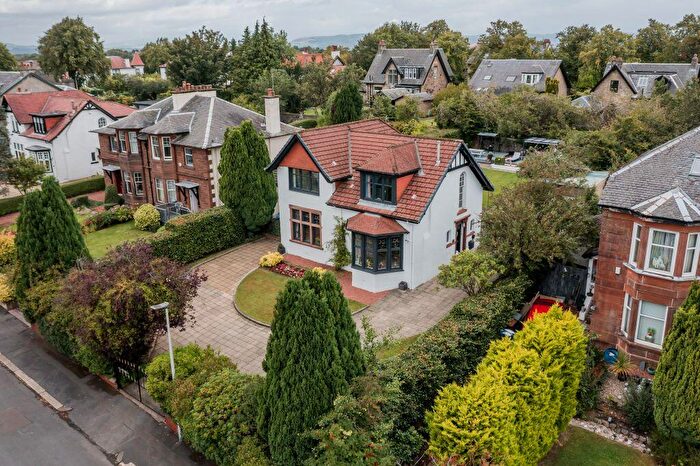
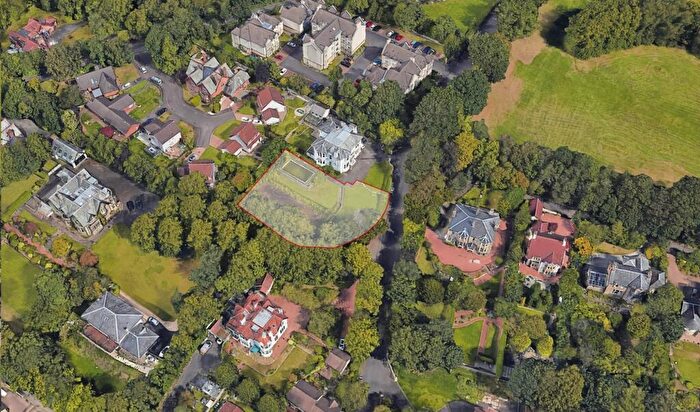
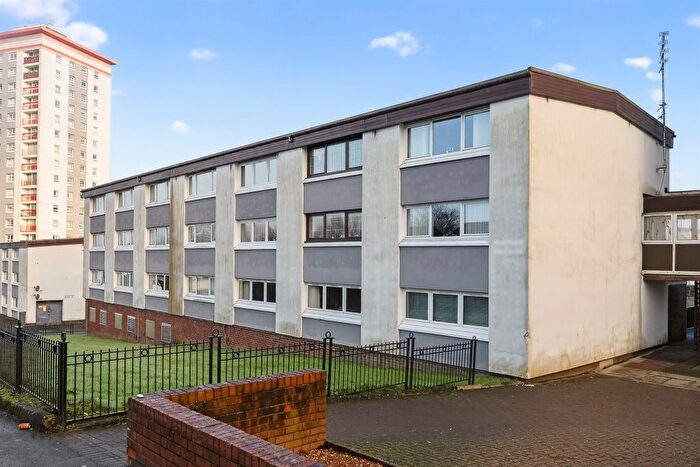
Previously listed properties near PA2 8AT, Ochil Drive

![]()
If you are looking to sell your house, let it out, or receive a property valuation, an expert can help you.
Click the button below to get started.
Price Paid in Ochil Drive, PA2 8AT, Paisley Southeast
12 Ochil Drive, PA2 8AT, Paisley Southeast Paisley
Property 12 has been sold 2 times. The last time it was sold was in 24/04/2017 and the sold price was £95,000.00.
This is a Property which was sold as an Established Building in 24/04/2017
| Date | Price | Classification |
|---|---|---|
| 24/04/2017 | £95,000.00 | Established Building |
| 20/08/2007 | £103,000.00 | Established Building |
6 Ochil Drive, PA2 8AT, Paisley Southeast Paisley
Property 6 has been sold 1 time. The last time it was sold was in 24/04/2008 and the sold price was £82,000.00.
This is a Property which was sold as an Established Building in 24/04/2008
| Date | Price | Classification |
|---|---|---|
| 24/04/2008 | £82,000.00 | Established Building |
4 Ochil Drive, PA2 8AT, Paisley Southeast Paisley
Property 4 has been sold 1 time. The last time it was sold was in 03/02/2006 and the sold price was £82,950.00.
This is a Property which was sold as an Established Building in 03/02/2006
| Date | Price | Classification |
|---|---|---|
| 03/02/2006 | £82,950.00 | Established Building |
Transport near PA2 8AT, Ochil Drive
-
 Paisley Canal Station
 -
Paisley Gilmour Street Station
-
Hawkhead Station
-
Paisley St.James Station
-
Barrhead Station
-
Crookston Glasgow Station
-
Nitshill Station
-
Neilston Station
House price paid reports for PA2 8AT, Ochil Drive
Click on the buttons below to see price paid reports by year or property price:
- Price Paid By Year
Property Price Paid in PA2 8AT, Ochil Drive by Year
The average sold property price by year was:
| Year | Average Sold Price | Price Change |
Sold Properties
|
|---|---|---|---|
| 2017 | £95,000 | 14% |
1 Property |
| 2008 | £82,000 | -26% |
1 Property |
| 2007 | £103,000 | 19% |
1 Property |
| 2006 | £82,950 | - |
1 Property |