
Houses for sale & to rent in TD9 7DX, Wellington Road, Hawick and Denholm, Hawick
House Prices in TD9 7DX, Wellington Road, Hawick and Denholm
Properties in TD9 7DX have an average house price of £125k and had 1 Property Transaction within the last 3 years.¹ TD9 7DX is a postcode in Wellington Road located in Hawick and Denholm, an area in Hawick, Scottish Borders, with 6 households², where the most expensive property was sold for £125k.
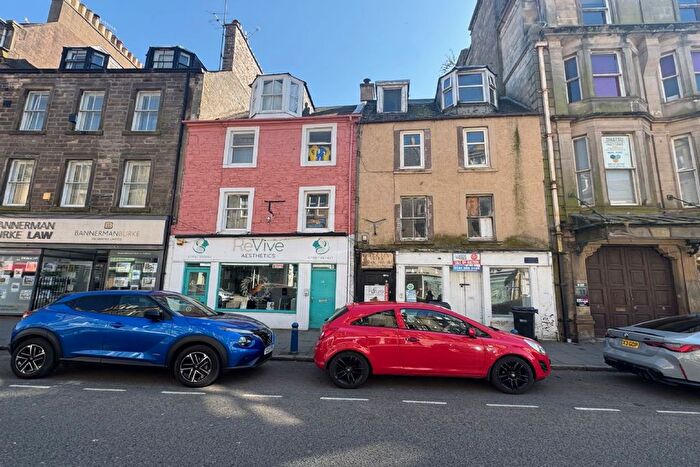
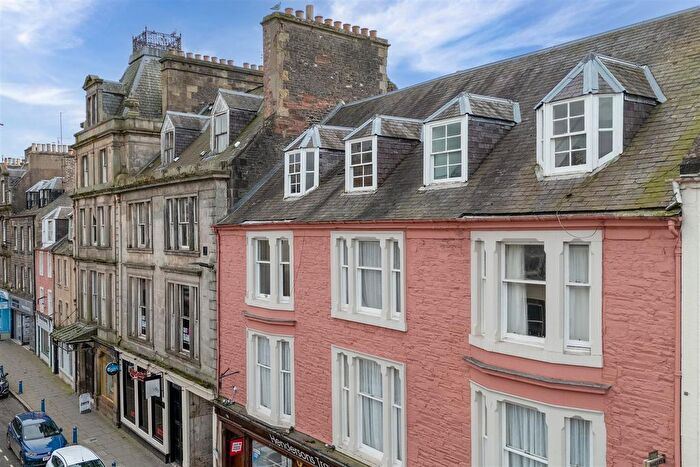
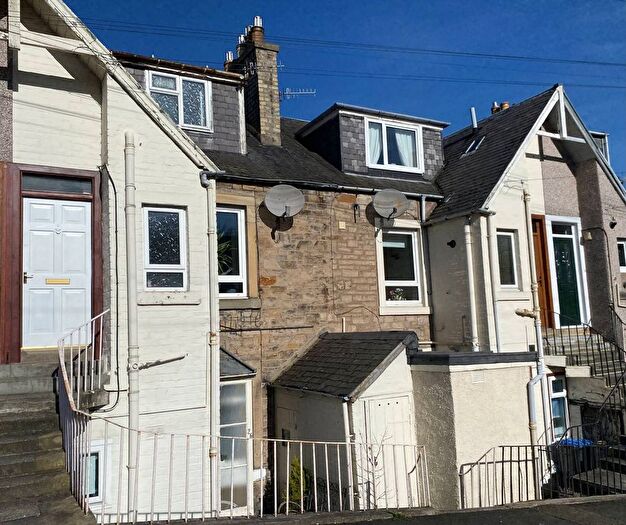
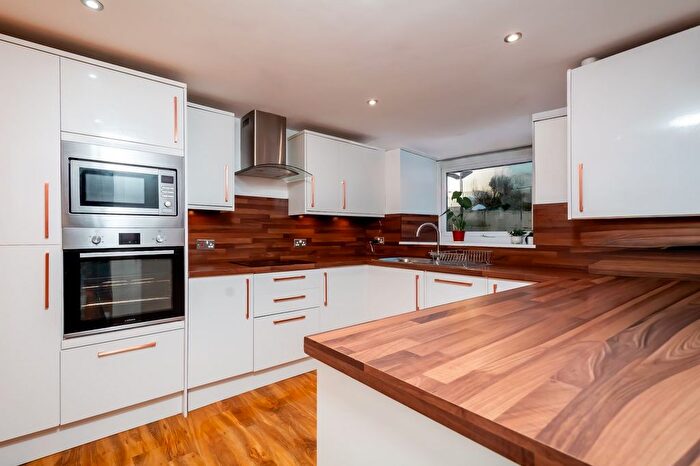
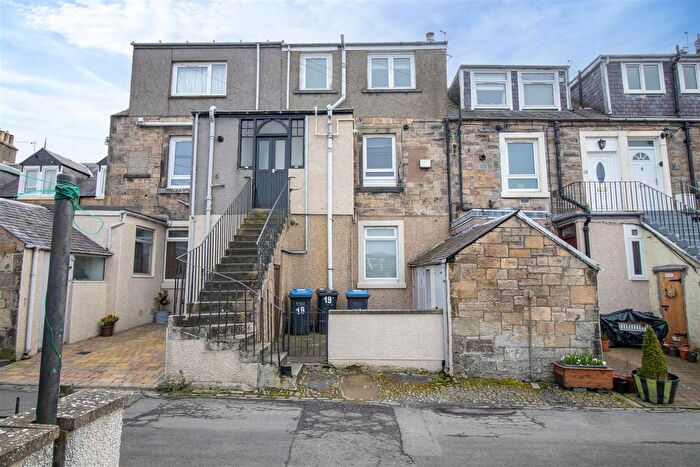
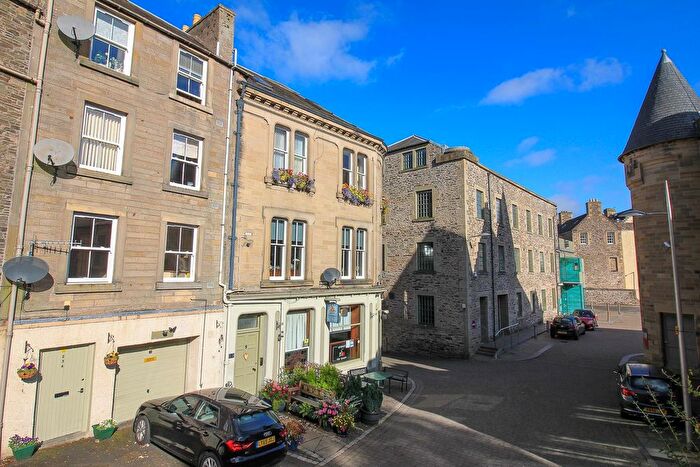
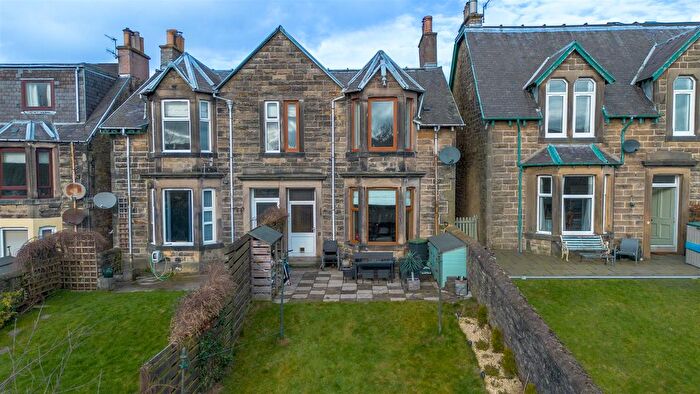
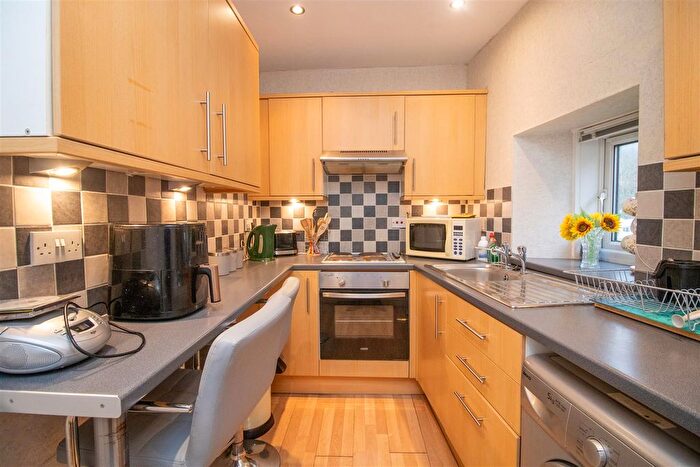
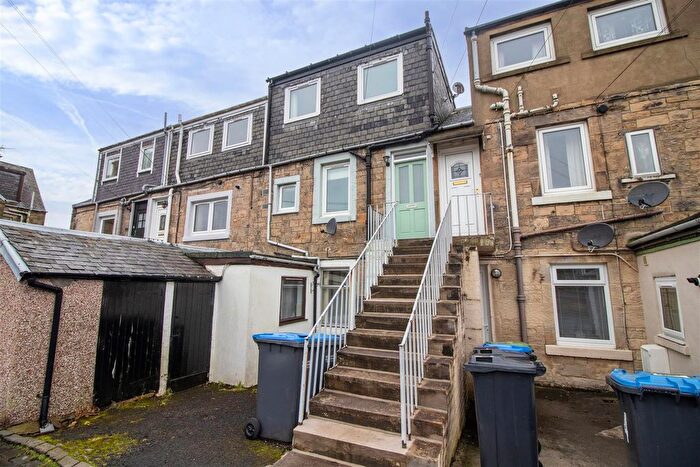
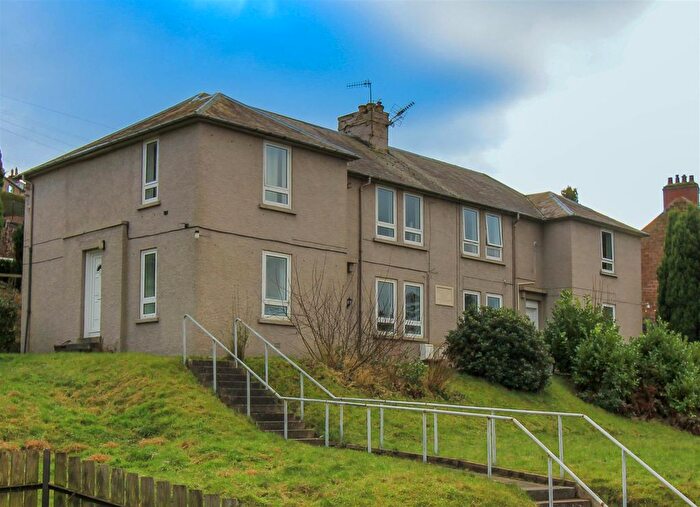
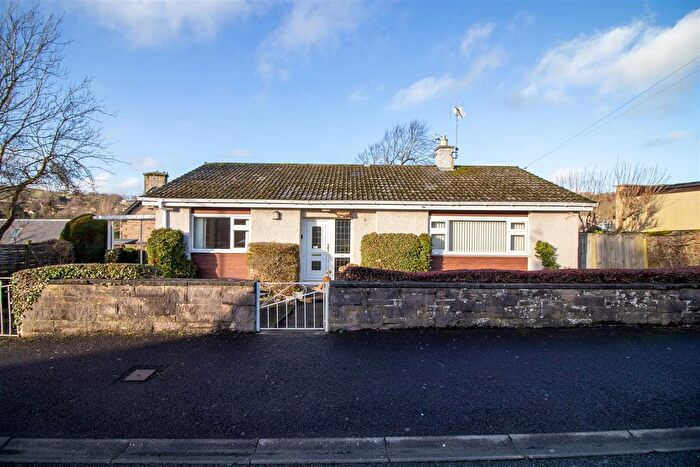
Properties for sale near TD9 7DX, Wellington Road
![]()
If you are looking to sell your house, let it out, or receive a property valuation, an expert can help you.
Click the button below to get started.
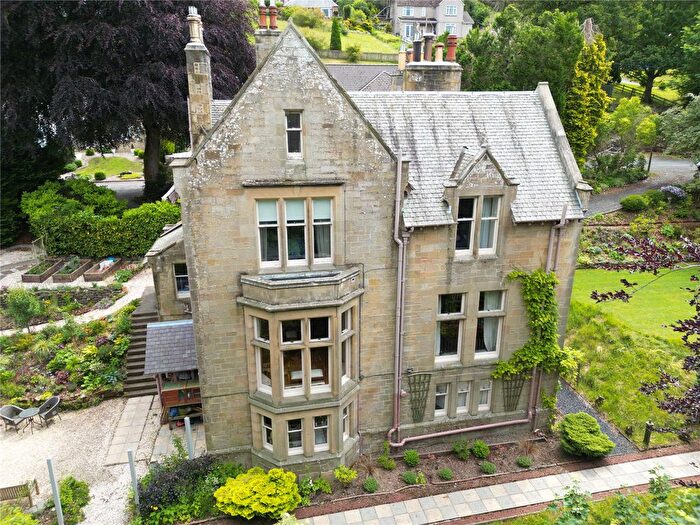
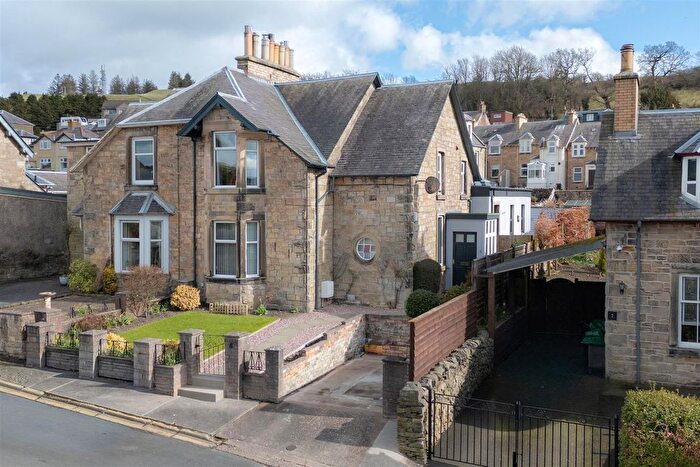
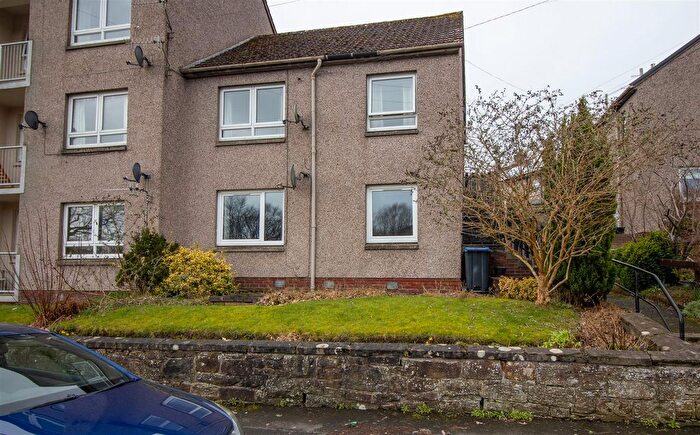
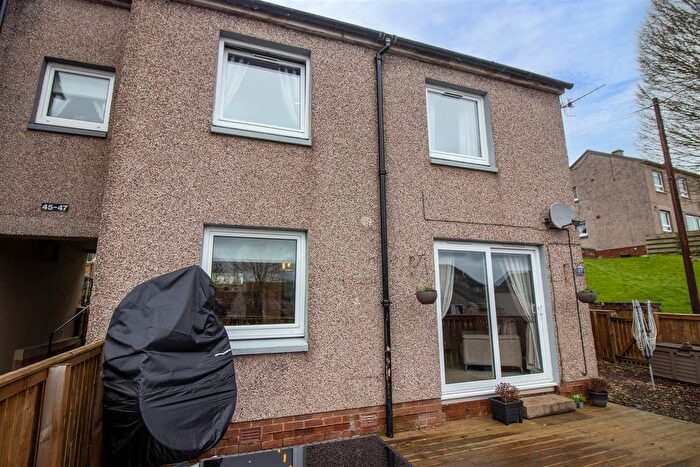
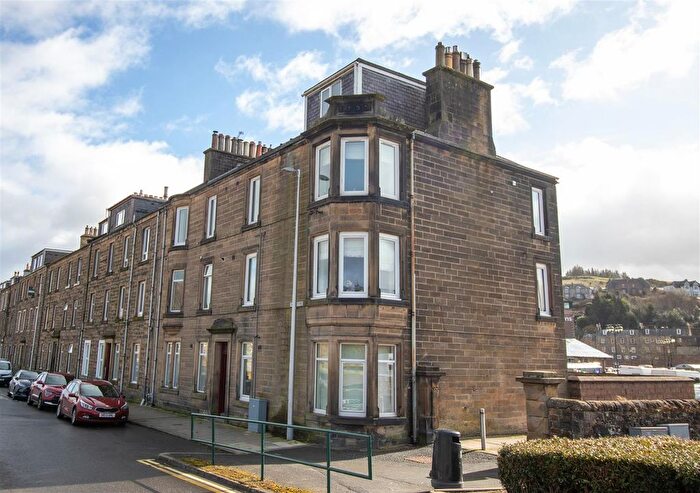
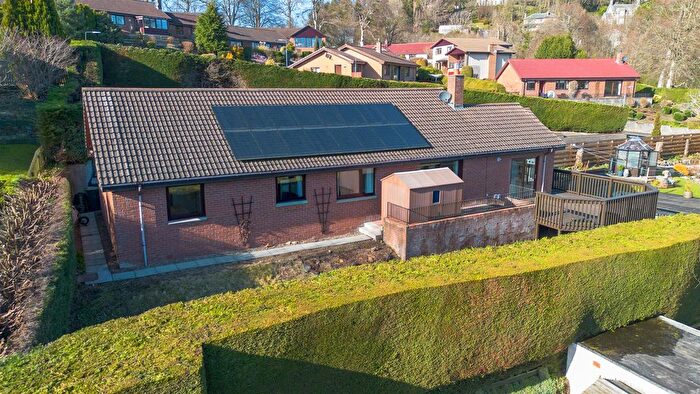
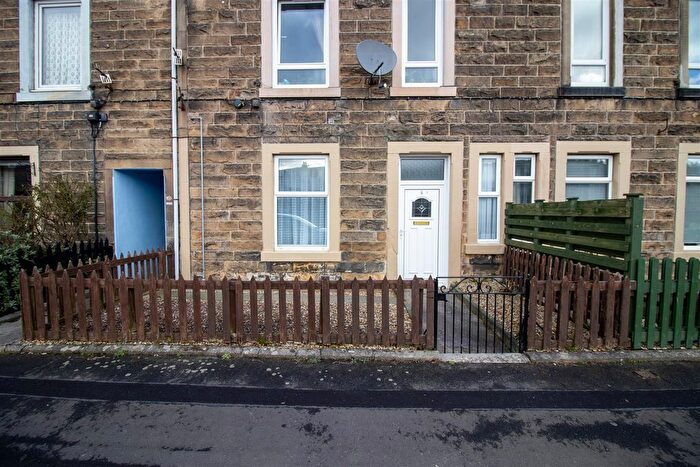
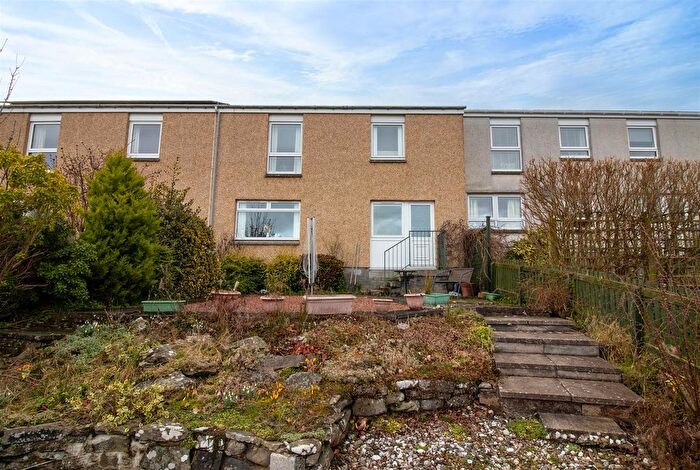
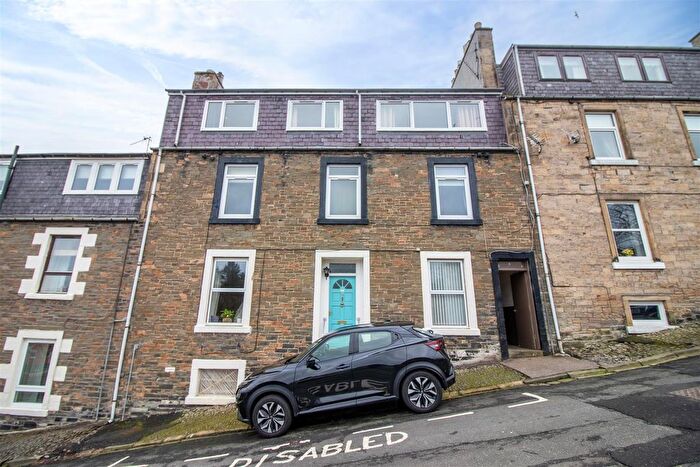
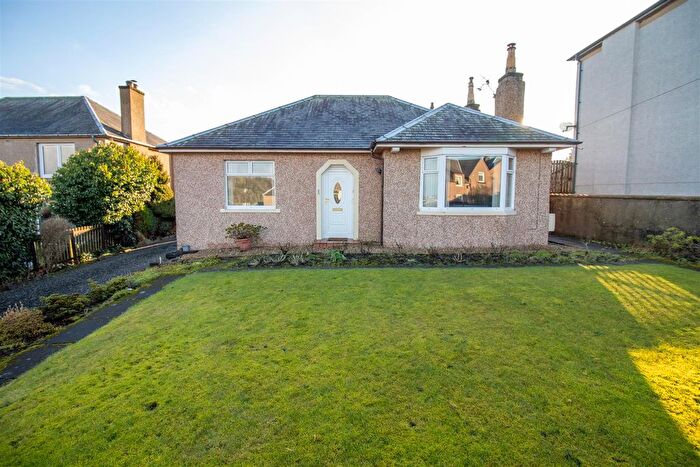
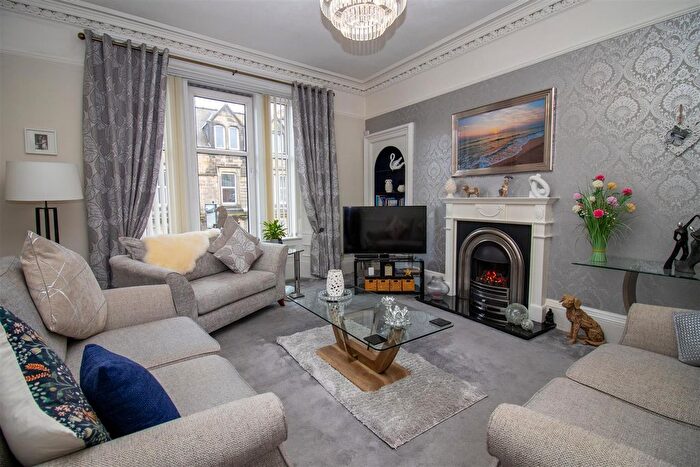
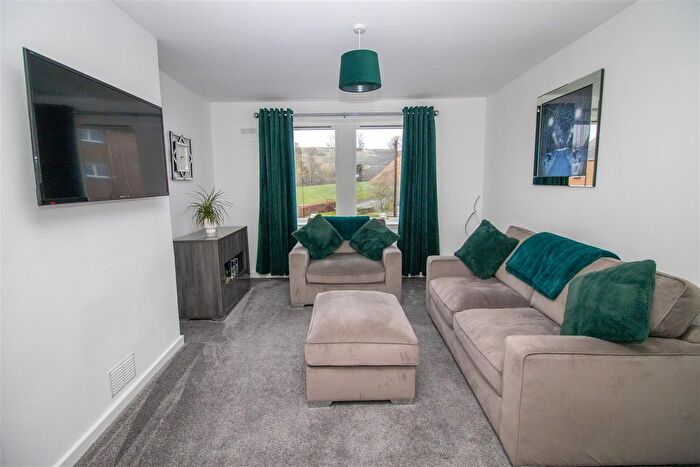
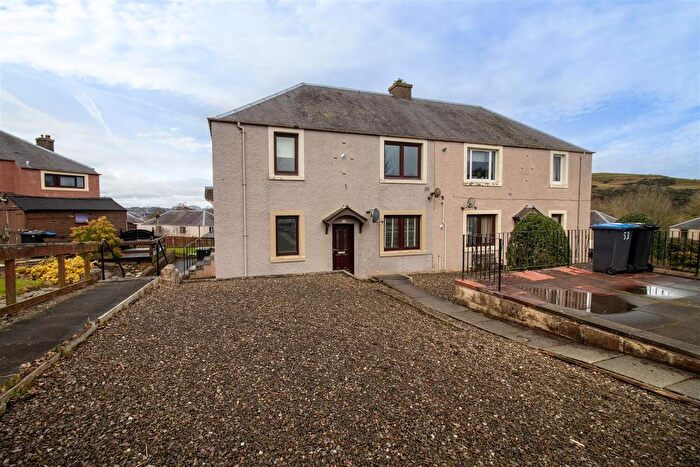
Previously listed properties near TD9 7DX, Wellington Road
![]()
If you are looking to sell your house, let it out, or receive a property valuation, an expert can help you.
Click the button below to get started.
Price Paid in Wellington Road, TD9 7DX, Hawick and Denholm
3 Wellington Road, TD9 7DX, Hawick and Denholm Hawick
Property 3 has been sold 2 times. The last time it was sold was in 21/02/2025 and the sold price was £125,000.00.
This is a Property which was sold as a New Build in 21/02/2025
| Date | Price | Classification |
|---|---|---|
| 21/02/2025 | £125,000.00 | New Build |
| 10/10/2013 | £60,000.00 | Established Building |
2a Wellington Road, TD9 7DX, Hawick and Denholm Hawick
Property 2a has been sold 2 times. The last time it was sold was in 29/11/2021 and the sold price was £165,000.00.
This is a Property which was sold as an Established Building in 29/11/2021
| Date | Price | Classification |
|---|---|---|
| 29/11/2021 | £165,000.00 | Established Building |
| 01/06/2010 | £20,000.00 | Established Building |
2 Wellington Road, TD9 7DX, Hawick and Denholm Hawick
Property 2 has been sold 2 times. The last time it was sold was in 07/11/2017 and the sold price was £125,000.00.
This is a Property which was sold as an Established Building in 07/11/2017
| Date | Price | Classification |
|---|---|---|
| 07/11/2017 | £125,000.00 | Established Building |
| 26/10/2006 | £160,000.00 | Established Building |
Transport near TD9 7DX, Wellington Road

House price paid reports for TD9 7DX, Wellington Road
Click on the buttons below to see price paid reports by year or property price:
- Price Paid By Year
Property Price Paid in TD9 7DX, Wellington Road by Year
The average sold property price by year was:
| Year | Average Sold Price | Price Change |
Sold Properties
|
|---|---|---|---|
| 2025 | £125,000 | -32% |
1 Property |
| 2021 | £165,000 | 24% |
1 Property |
| 2017 | £125,000 | 52% |
1 Property |
| 2013 | £60,000 | 67% |
1 Property |
| 2010 | £20,000 | -700% |
1 Property |
| 2006 | £160,000 | - |
1 Property |