
Houses for sale & to rent in TD9 8TB, Hawick and Denholm, Hawick
House Prices in TD9 8TB, Hawick and Denholm
Properties in TD9 8TB have an average house price of £190k and had 1 Property Transaction within the last 3 years.¹ TD9 8TB is a postcode in Hawick and Denholm, an area in Hawick, Scottish Borders, with 15 households², where the most expensive property was sold for £190k.
Previously listed properties near TD9 8TB

Price Paid in TD9 8TB, Hawick and Denholm
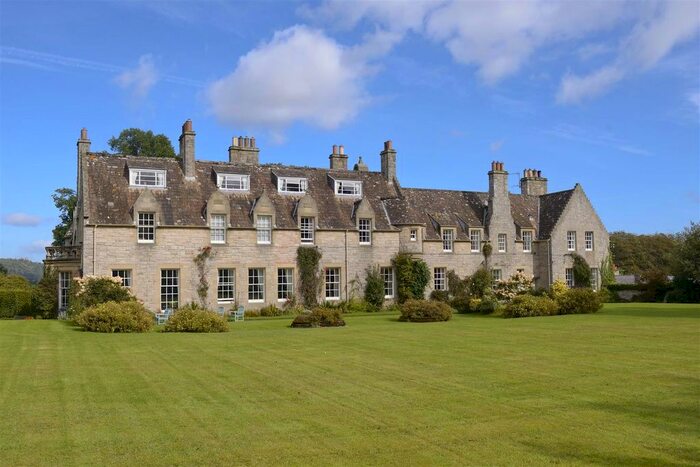
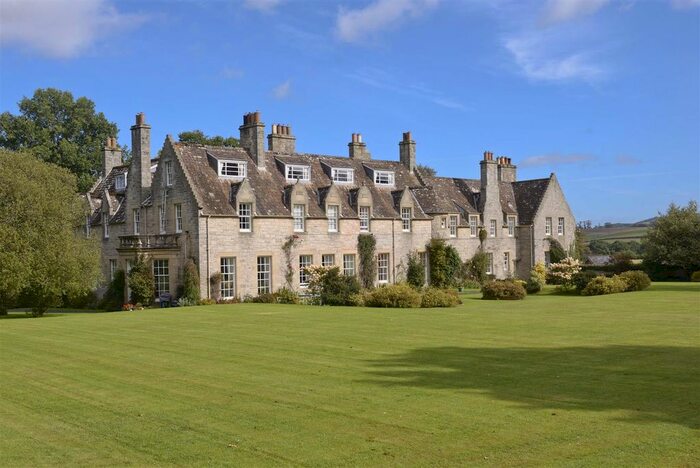
8 Towerburn Hawick TD9 8TB, Hawick and Denholm Hawick
Property 8 Towerburn Hawick has been sold 2 times. The last time it was sold was in 07/03/2023 and the sold price was £190,000.00.
This is a Property which was sold as an Established Building in 07/03/2023
| Date | Price | Classification |
|---|---|---|
| 07/03/2023 | £190,000.00 | Established Building |
| 19/08/2022 | £190,000.00 | Established Building |
The Garden Flat 3 Towerburn TD9 8TB, Hawick and Denholm Hawick
Property The Garden Flat 3 Towerburn has been sold 1 time. The last time it was sold was in 28/11/2022 and the sold price was £420,000.00.
This is a Property which was sold as an Established Building in 28/11/2022
| Date | Price | Classification |
|---|---|---|
| 28/11/2022 | £420,000.00 | Established Building |
4 Towerburn Hawick TD9 8TB, Hawick and Denholm Hawick
Property 4 Towerburn Hawick has been sold 1 time. The last time it was sold was in 08/12/2020 and the sold price was £150,000.00.
This is a Property which was sold as an Established Building in 08/12/2020
| Date | Price | Classification |
|---|---|---|
| 08/12/2020 | £150,000.00 | Established Building |
5 Towerburn Hawick TD9 8TB, Hawick and Denholm Hawick
Property 5 Towerburn Hawick has been sold 5 times. The last time it was sold was in 04/12/2019 and the sold price was £186,000.00.
This is a Property which was sold as an Established Building in 04/12/2019
| Date | Price | Classification |
|---|---|---|
| 04/12/2019 | £186,000.00 | Established Building |
| 21/05/2009 | £160,000.00 | Established Building |
| 20/09/2007 | £172,000.00 | Established Building |
| 13/10/2005 | £134,500.00 | Established Building |
| 17/12/2003 | £100,000.00 | Established Building |
7 Towerburn Hawick TD9 8TB TD9 8TB, Hawick and Denholm Hawick
Property 7 Towerburn Hawick TD9 8TB has been sold 2 times. The last time it was sold was in 14/02/2019 and the sold price was £205,000.00.
This is a Property which was sold as an Established Building in 14/02/2019
| Date | Price | Classification |
|---|---|---|
| 14/02/2019 | £205,000.00 | Established Building |
| 24/06/2010 | £191,102.00 | Established Building |
9 Towerburn Hawick TD9 8TB, Hawick and Denholm Hawick
Property 9 Towerburn Hawick has been sold 3 times. The last time it was sold was in 27/11/2018 and the sold price was £172,000.00.
This is a Property which was sold as an Established Building in 27/11/2018
| Date | Price | Classification |
|---|---|---|
| 27/11/2018 | £172,000.00 | Established Building |
| 02/11/2016 | £145,000.00 | Established Building |
| 01/02/2002 | £80,000.00 | Established Building |
3 Towerburn Hawick TD9 8TB, Hawick and Denholm Hawick
Property 3 Towerburn Hawick has been sold 1 time. The last time it was sold was in 07/04/2011 and the sold price was £100,000.00.
This is a Property which was sold as an Established Building in 07/04/2011
| Date | Price | Classification |
|---|---|---|
| 07/04/2011 | £100,000.00 | Established Building |
Bedrule Mill Hawick TD9 8TB, Hawick and Denholm Hawick
Property Bedrule Mill Hawick has been sold 1 time. The last time it was sold was in 17/06/2005 and the sold price was £510,000.00.
This is a Property which was sold as an Established Building in 17/06/2005
| Date | Price | Classification |
|---|---|---|
| 17/06/2005 | £510,000.00 | Established Building |
Transport near TD9 8TB

House price paid reports for TD9 8TB
Click on the buttons below to see price paid reports by year or property price:
- Price Paid By Year
Property Price Paid in TD9 8TB by Year
The average sold property price by year was:
| Year | Average Sold Price | Price Change |
Sold Properties
|
|---|---|---|---|
| 2023 | £190,000 | -61% |
1 Property |
| 2022 | £305,000 | 51% |
2 Properties |
| 2020 | £150,000 | -30% |
1 Property |
| 2019 | £195,500 | 12% |
2 Properties |
| 2018 | £172,000 | 16% |
1 Property |
| 2016 | £145,000 | 31% |
1 Property |
| 2011 | £100,000 | -91% |
1 Property |
| 2010 | £191,102 | 16% |
1 Property |
| 2009 | £160,000 | -8% |
1 Property |
| 2007 | £172,000 | -87% |
1 Property |
| 2005 | £322,250 | 69% |
2 Properties |
| 2003 | £100,000 | 20% |
1 Property |
| 2002 | £80,000 | - |
1 Property |