
Houses for sale & to rent in Prestwick, South Ayrshire
House Prices in Prestwick
Properties in Prestwick have an average house price of £213k and had 580 Property Transactions within the last 3 years.¹
Prestwick is an area in South Ayrshire with 7,370 households², where the most expensive property was sold for £850k.
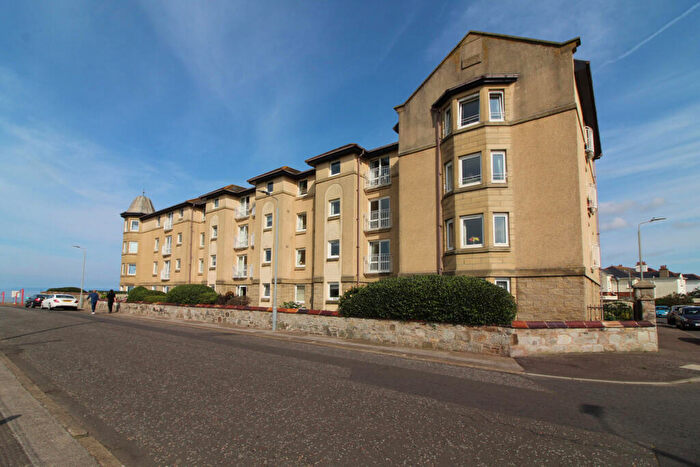
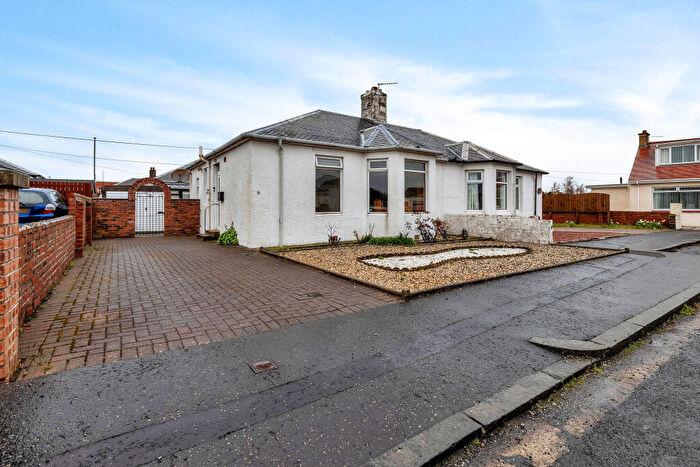
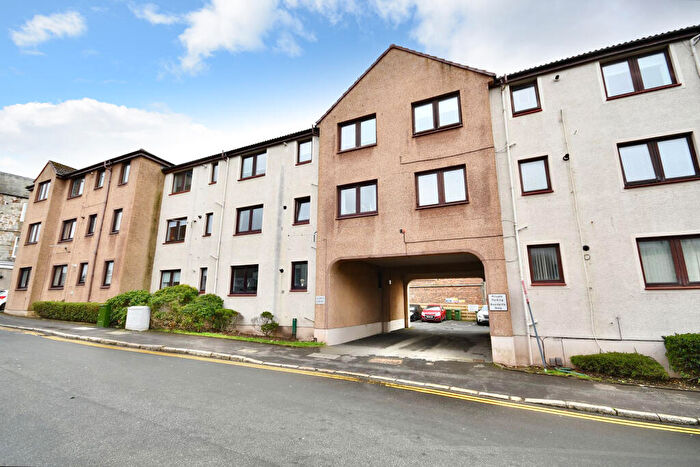
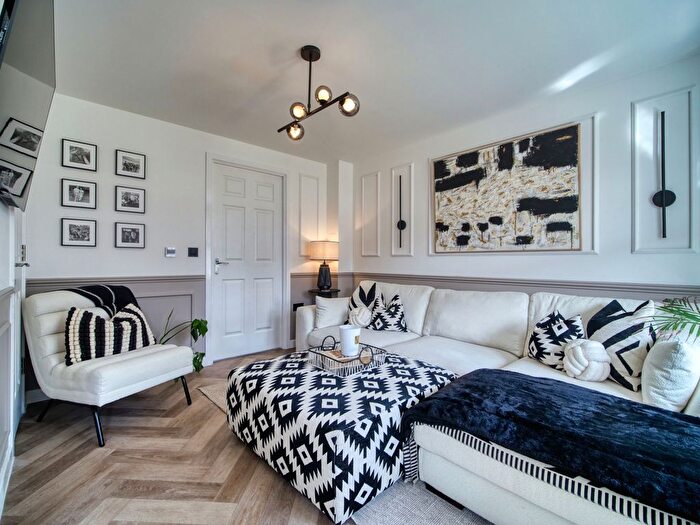
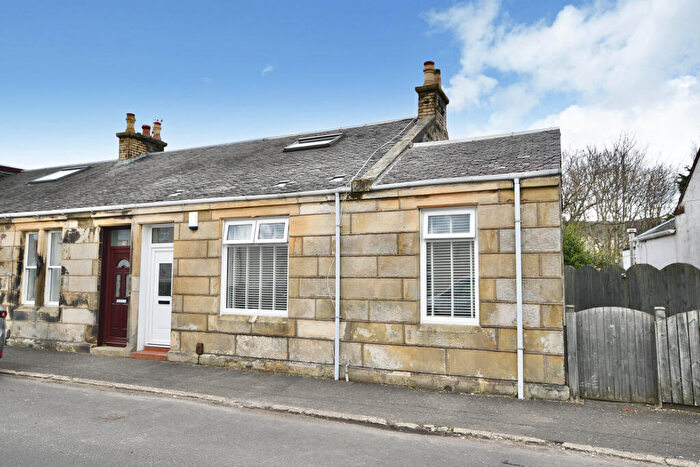
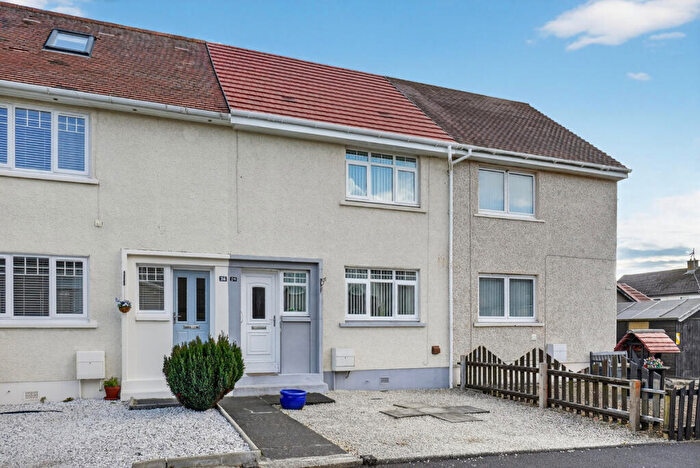
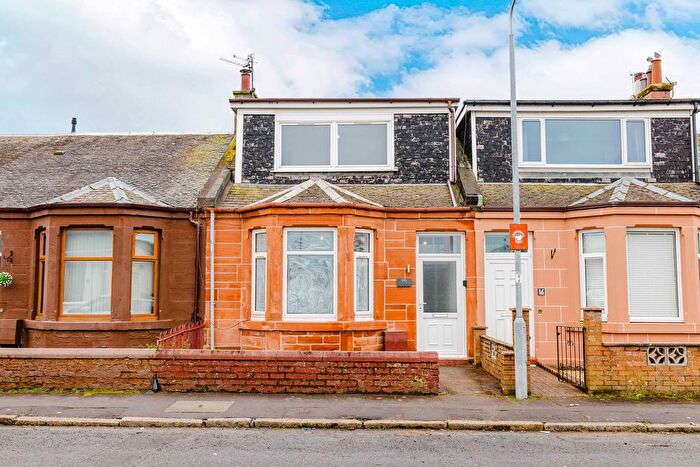
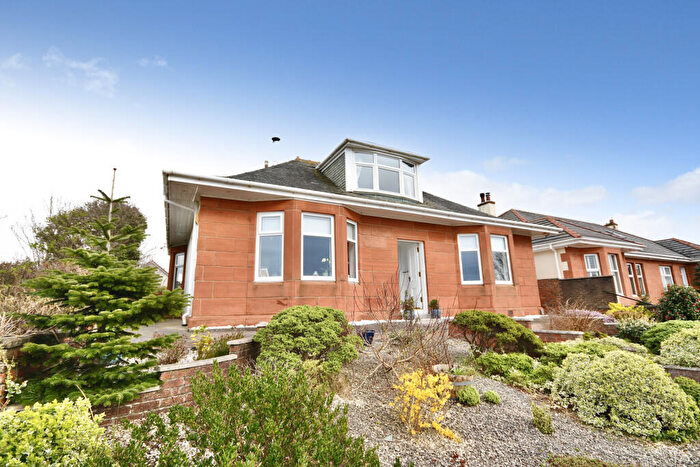
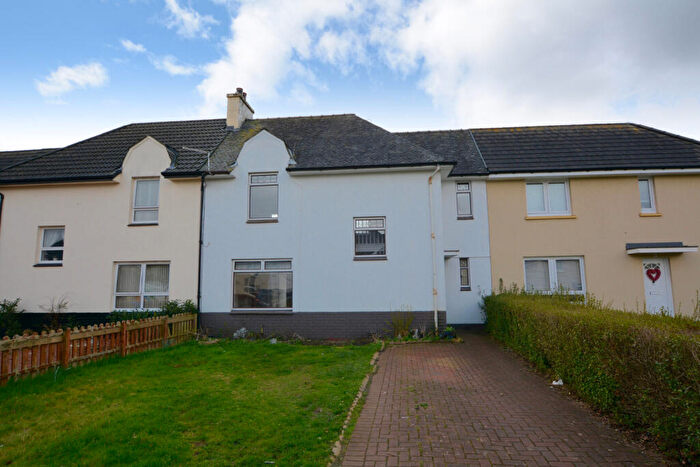
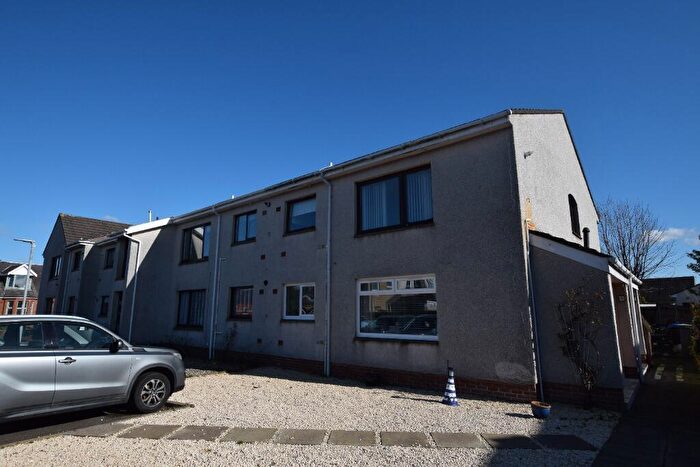
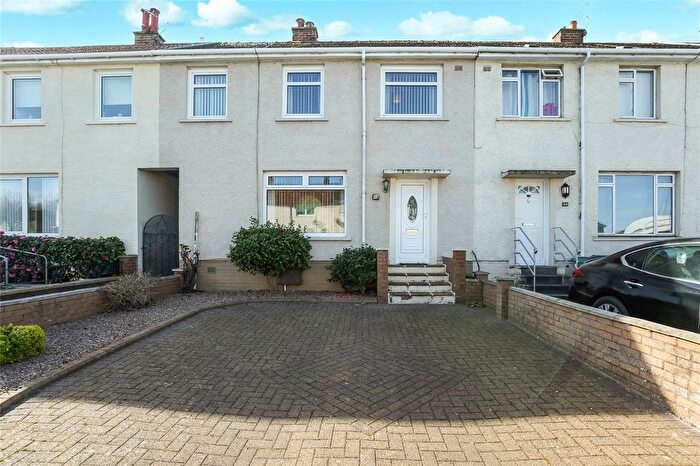
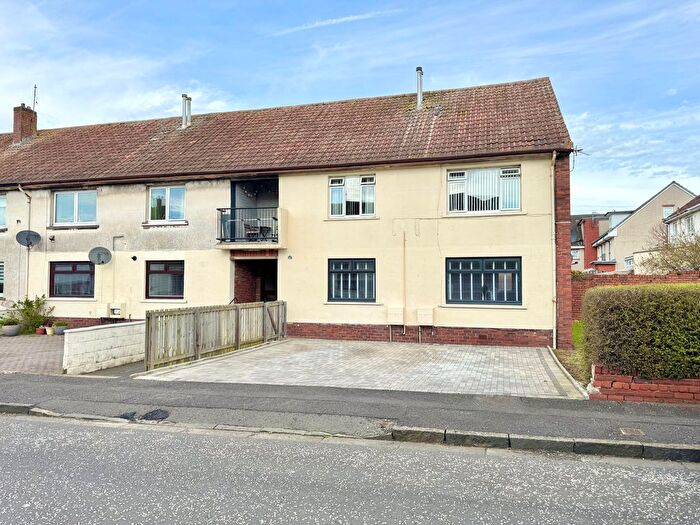
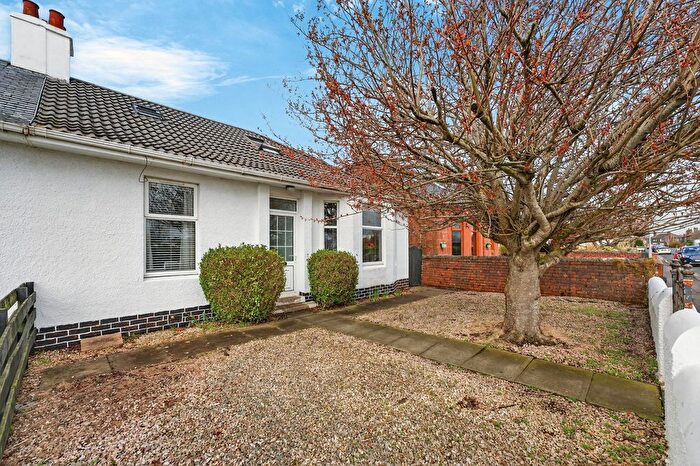
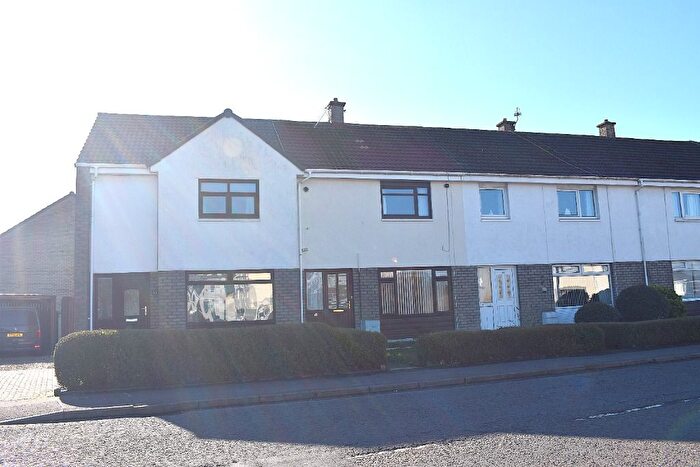
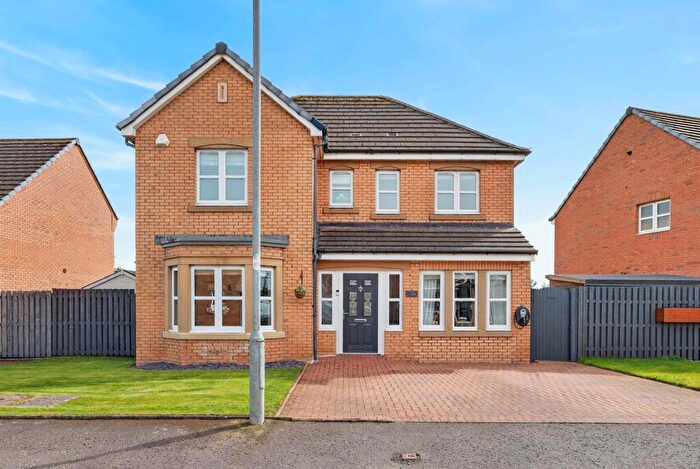
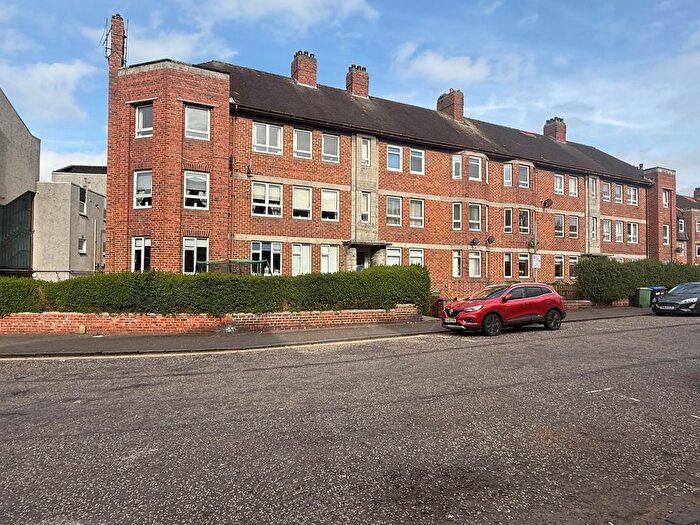
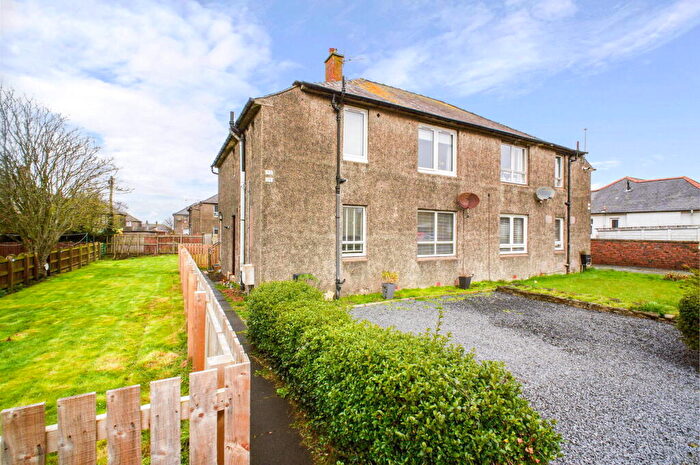
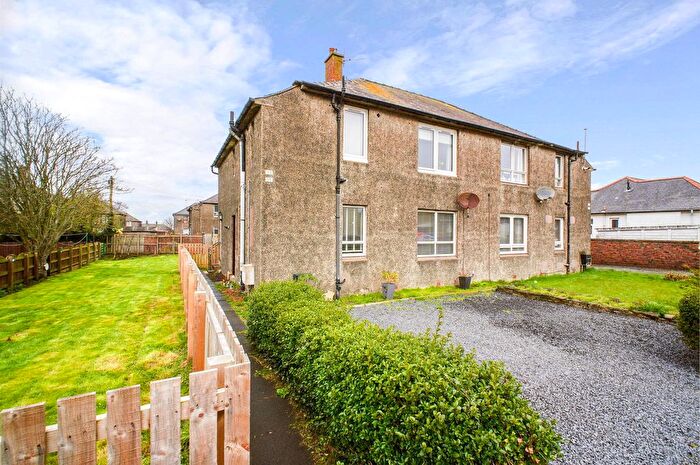
Properties for sale in Prestwick
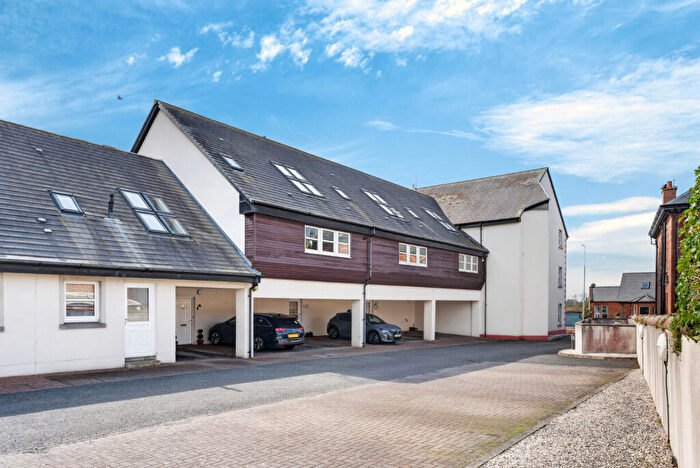
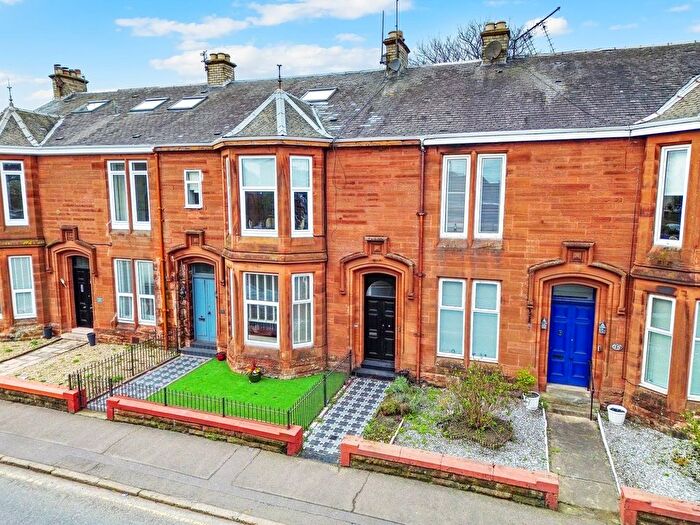
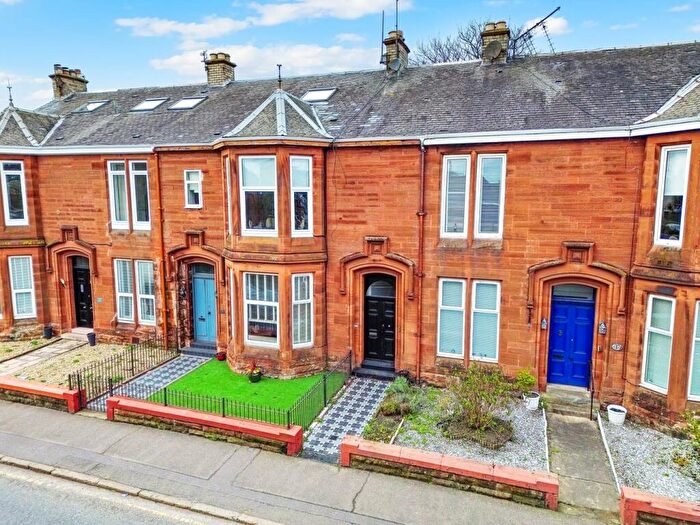
![]()
If you are looking to sell your house, let it out, or receive a property valuation, an expert can help you.
Click the button below to get started.
Neighbourhoods in Prestwick
Navigate through our locations to find the location of your next house in Prestwick, South Ayrshire for sale or to rent.
Transport in Prestwick
Please see below transportation links in this area:

- FAQ
- Price Paid By Year
Frequently asked questions about Prestwick
What is the average price for a property for sale in Prestwick?
The average price for a property for sale in Prestwick is £213,069. This amount is 15% higher than the average price in South Ayrshire. There are 1,834 property listings for sale in Prestwick.
What locations have the most expensive properties for sale in Prestwick?
The locations with the most expensive properties for sale in Prestwick are Troon at an average of £450,703 and Kyle at an average of £222,196.
What locations have the most affordable properties for sale in Prestwick?
The location with the most affordable properties for sale in Prestwick is Prestwick at an average of £210,675.
Which train stations are available in or near Prestwick?
Some of the train stations available in or near Prestwick are Prestwick, Prestwick Internat'nl Airport and Newton-On-Ayr.
Property Price Paid in Prestwick by Year
The average sold property price by year was:
| Year | Average Sold Price | Price Change |
Sold Properties
|
|---|---|---|---|
| 2025 | £219,647 | 5% |
198 Properties |
| 2024 | £208,452 | -1% |
164 Properties |
| 2023 | £210,567 | 2% |
218 Properties |
| 2022 | £206,553 | 9% |
347 Properties |
| 2021 | £187,043 | 7% |
335 Properties |
| 2020 | £173,551 | 5% |
276 Properties |
| 2019 | £165,375 | -4% |
334 Properties |
| 2018 | £171,910 | 9% |
334 Properties |
| 2017 | £156,871 | -0,3% |
333 Properties |
| 2016 | £157,418 | 2% |
356 Properties |
| 2015 | £153,995 | 1% |
361 Properties |
| 2014 | £152,899 | -2% |
304 Properties |
| 2013 | £155,247 | 5% |
319 Properties |
| 2012 | £148,007 | -4% |
302 Properties |
| 2011 | £153,267 | 2% |
260 Properties |
| 2010 | £150,709 | -6% |
257 Properties |
| 2009 | £159,013 | -9% |
247 Properties |
| 2008 | £173,371 | 4% |
300 Properties |
| 2007 | £165,813 | 10% |
506 Properties |
| 2006 | £149,836 | 11% |
434 Properties |
| 2005 | £132,943 | 17% |
459 Properties |
| 2004 | £110,987 | -499% |
504 Properties |
| 2003 | £665,118 | 89% |
480 Properties |
| 2002 | £76,294 | -134% |
411 Properties |
| 2001 | £178,694 | - |
47 Properties |