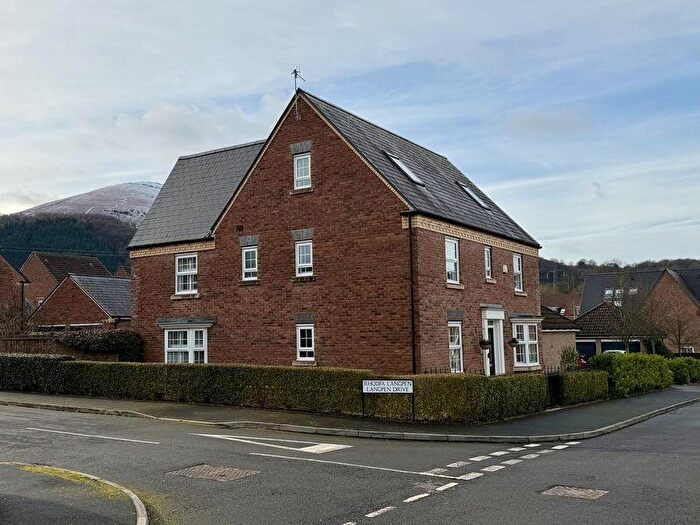
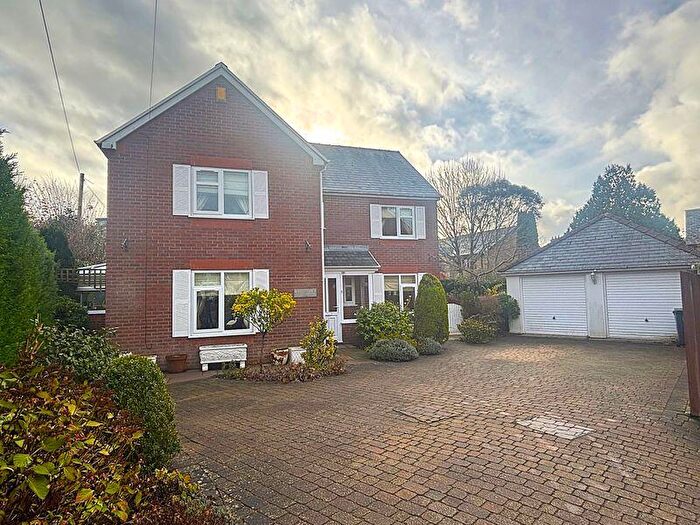
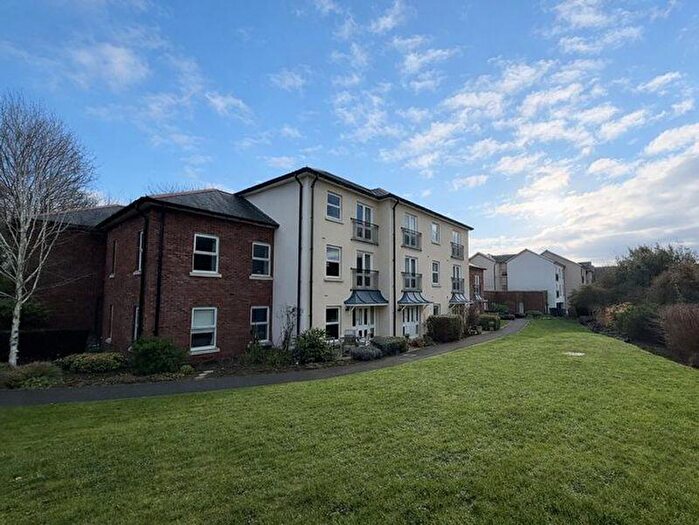
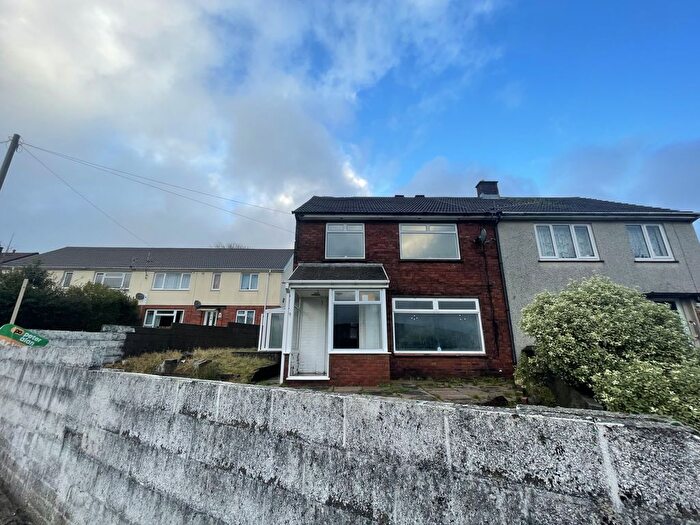
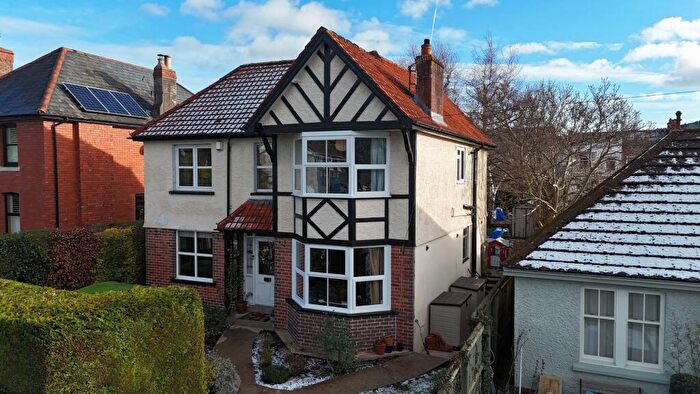
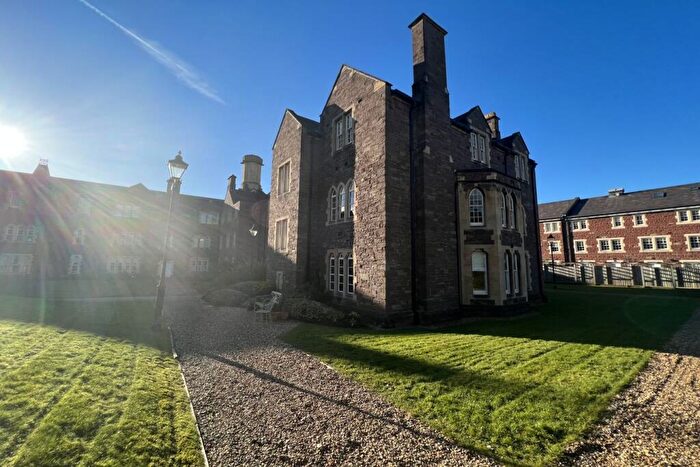
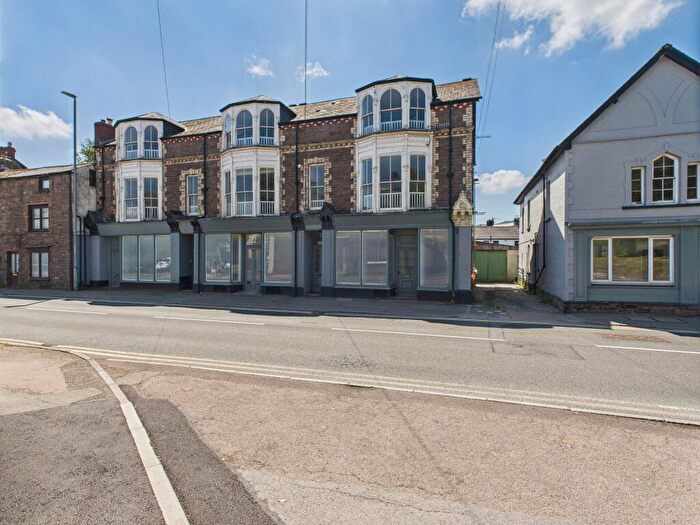
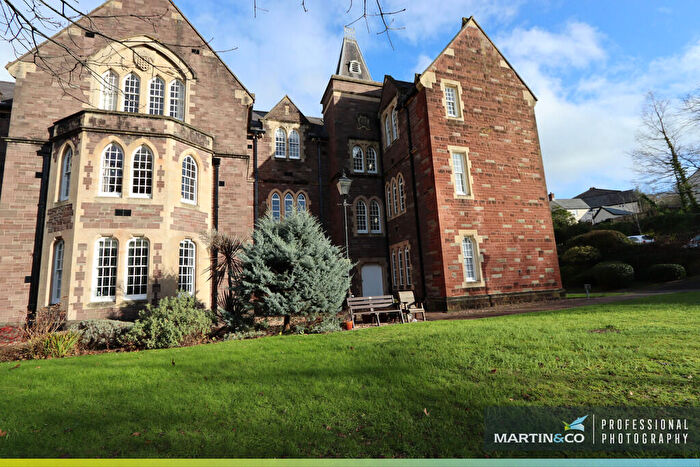
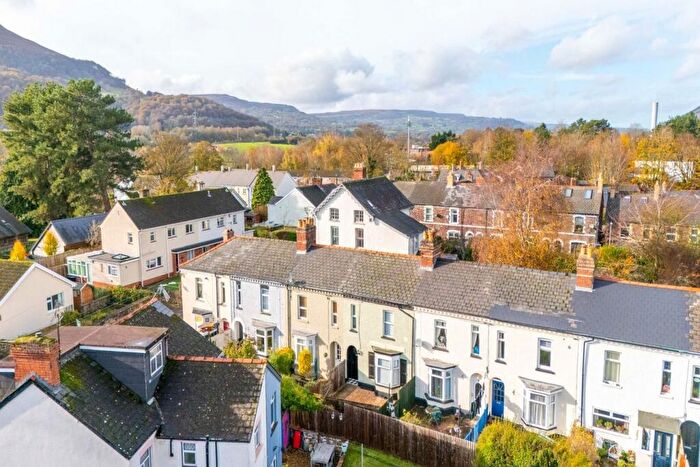
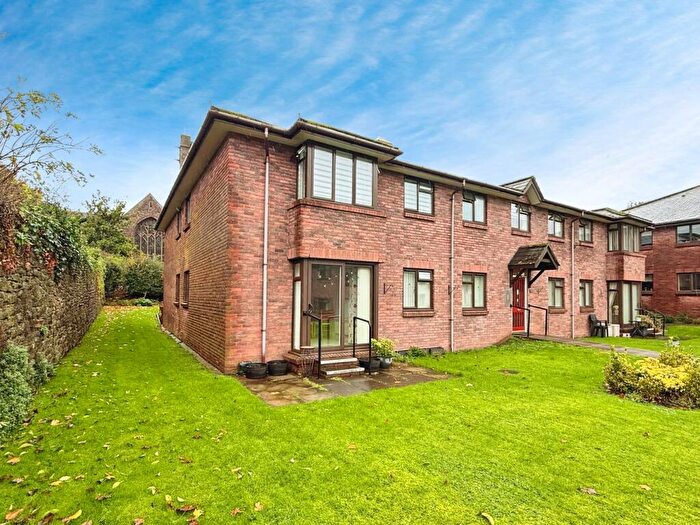
Houses for sale & to rent in Llanfoist Fawr, Abergavenny
House Prices in Llanfoist Fawr
Properties in Llanfoist Fawr have an average house price of £369,894.00 and had 119 Property Transactions within the last 3 years¹.
Llanfoist Fawr is an area in Abergavenny, Sir Fynwy - Monmouthshire with 828 households², where the most expensive property was sold for £960,000.00.
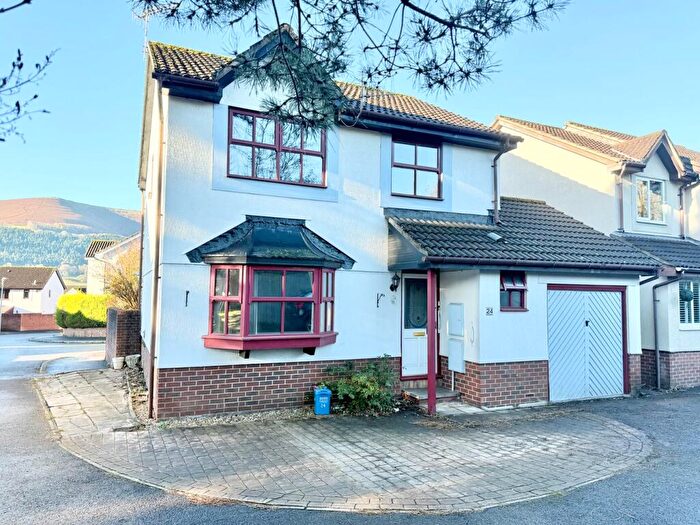
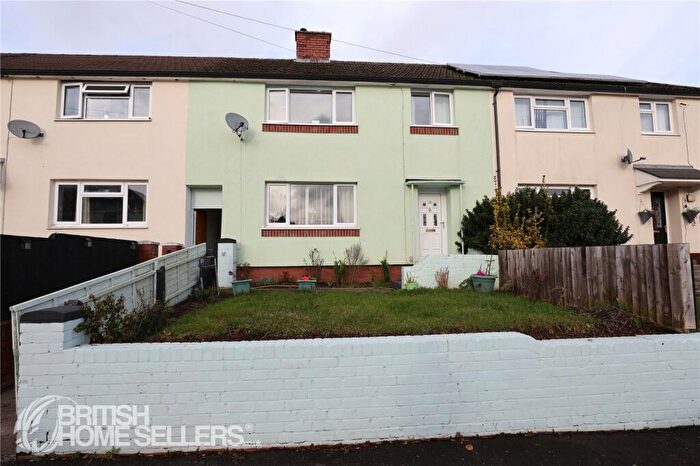
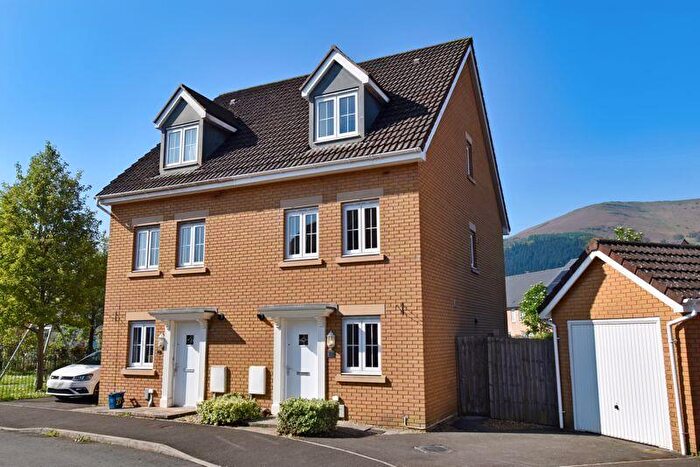
Properties for sale in Llanfoist Fawr
Roads and Postcodes in Llanfoist Fawr
Navigate through our locations to find the location of your next house in Llanfoist Fawr, Abergavenny for sale or to rent.
| Streets | Postcodes |
|---|---|
| Ashgrove | NP7 9HP |
| Beech Grove | NP7 9ND |
| Blorenge Terrace | NP7 9NP |
| Blorenge View | NP7 9YB |
| Briardene | NP7 9LJ |
| Casaba Terrace | NP7 9NR |
| Charles Edwards Close | NP7 9NQ |
| Church Lane | NP7 9NG |
| Clos Hengaer Ysgol | NP7 9JZ |
| Company Farm Drive | NP7 9QA |
| Coopers Way | NP7 9LZ |
| Cordell Close | NP7 9FE |
| Crawshay Close | NP7 9FF |
| Dan Y Bryn | NP7 9HH |
| Dumfries Close | NP7 9LU |
| Elm Drive | NP7 9HW |
| Ffordd Sain Ffwyst | NP7 9QF |
| Gladys Place | NP7 9NH |
| Grove Avenue | NP7 9NB |
| Gypsy Crescent | NP7 9LT |
| Gypsy Lane | NP7 9LS |
| Iberis Road | NP7 9LQ |
| James Jones Close | NP7 9PZ |
| Jasper Tudor Crescent | NP7 9AZ |
| Kiln Road | NP7 9NE |
| Langpen Drive | NP7 9AX |
| Llanellen Road | NP7 9NF |
| Merthyr Road | NP7 9LL NP7 9LN NP7 9LP NP7 9LR NP7 9BQ |
| Mountain View | NP7 9YA |
| New Villas | NP7 9NS |
| Penyrhiw | NP7 7ES |
| Punchbowl View | NP7 9FL |
| Riverside Drive | NP7 9PX |
| Ross Cottages | NP7 9NW |
| Samuel Salter Close | NP7 9NZ |
| Sanders Heights | NP7 9QB |
| School Way | NP7 9FD |
| Sheep Cot Road | NP7 9BX |
| St Faiths Close | NP7 9NJ |
| St Helens Close | NP7 9HR |
| St Helens Crescent | NP7 9HN |
| Steele Crescent | NP7 9QD |
| Sugar Loaf Drive | NP7 9BR |
| The Cedars | NP7 9LX |
| The Cutting | NP7 9NL NP7 9NX |
| The Paddocks | NP7 9HJ |
| Thomas Hill Close | NP7 9FJ |
| Woodland Crescent | NP7 9LY |
| NP7 7EP NP7 7ET NP7 7EU NP7 7EY NP7 7LA NP7 9HF NP7 9HG NP7 9HT NP7 9LB NP7 9LD NP7 9LE NP7 9LH NP7 7ER NP7 9AQ NP7 9BU NP7 9EB NP7 9HE NP7 9HS NP7 9HU NP7 9LF NP7 9NA NP7 9NN NP7 9PB NP7 9PE |
Transport near Llanfoist Fawr
-
Abergavenny Station
-
Ebbw Vale Town Station
-
Pontypool and New Inn Station
-
Ebbw Vale Parkway Station
-
Llanhilleth Station
- FAQ
- Price Paid By Year
- Property Type Price
Frequently asked questions about Llanfoist Fawr
What is the average price for a property for sale in Llanfoist Fawr?
The average price for a property for sale in Llanfoist Fawr is £369,894. This amount is 9% higher than the average price in Abergavenny. There are 431 property listings for sale in Llanfoist Fawr.
What streets have the most expensive properties for sale in Llanfoist Fawr?
The streets with the most expensive properties for sale in Llanfoist Fawr are The Paddocks at an average of £606,250, Steele Crescent at an average of £585,000 and The Cedars at an average of £550,000.
What streets have the most affordable properties for sale in Llanfoist Fawr?
The streets with the most affordable properties for sale in Llanfoist Fawr are Woodland Crescent at an average of £210,125, Blorenge Terrace at an average of £213,500 and Briardene at an average of £228,625.
Which train stations are available in or near Llanfoist Fawr?
Some of the train stations available in or near Llanfoist Fawr are Abergavenny, Ebbw Vale Town and Pontypool and New Inn.
Property Price Paid in Llanfoist Fawr by Year
The average sold property price by year was:
| Year | Average Sold Price | Price Change |
Sold Properties
|
|---|---|---|---|
| 2025 | £358,560 | -11% |
25 Properties |
| 2024 | £398,061 | 15% |
30 Properties |
| 2023 | £337,797 | -11% |
24 Properties |
| 2022 | £375,111 | 8% |
40 Properties |
| 2021 | £344,900 | 9% |
47 Properties |
| 2020 | £312,864 | 17% |
37 Properties |
| 2019 | £260,352 | -6% |
35 Properties |
| 2018 | £275,995 | 2% |
46 Properties |
| 2017 | £270,596 | 15% |
66 Properties |
| 2016 | £231,180 | -18% |
102 Properties |
| 2015 | £272,779 | 13% |
67 Properties |
| 2014 | £237,160 | -3% |
28 Properties |
| 2013 | £245,268 | -6% |
40 Properties |
| 2012 | £261,183 | 18% |
68 Properties |
| 2011 | £214,765 | 2% |
41 Properties |
| 2010 | £211,001 | 7% |
51 Properties |
| 2009 | £195,498 | -40% |
33 Properties |
| 2008 | £273,489 | 9% |
29 Properties |
| 2007 | £248,022 | 13% |
22 Properties |
| 2006 | £215,111 | -23% |
9 Properties |
| 2005 | £263,983 | 21% |
16 Properties |
| 2004 | £209,144 | 19% |
19 Properties |
| 2003 | £170,296 | 11% |
16 Properties |
| 2002 | £152,080 | 35% |
28 Properties |
| 2001 | £98,777 | 4% |
18 Properties |
| 2000 | £95,131 | 4% |
19 Properties |
| 1999 | £91,265 | 3% |
30 Properties |
| 1998 | £88,441 | 21% |
30 Properties |
| 1997 | £70,219 | -8% |
26 Properties |
| 1996 | £75,632 | 14% |
17 Properties |
| 1995 | £65,383 | - |
15 Properties |
Property Price per Property Type in Llanfoist Fawr
Here you can find historic sold price data in order to help with your property search.
The average Property Paid Price for specific property types in the last three years are:
| Property Type | Average Sold Price | Sold Properties |
|---|---|---|
| Semi Detached House | £269,327.00 | 27 Semi Detached Houses |
| Detached House | £450,209.00 | 70 Detached Houses |
| Terraced House | £242,947.00 | 20 Terraced Houses |
| Flat | £186,000.00 | 2 Flats |

