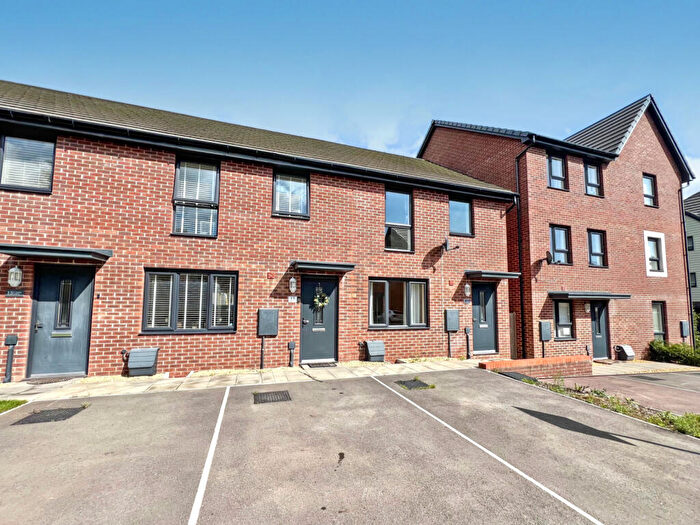
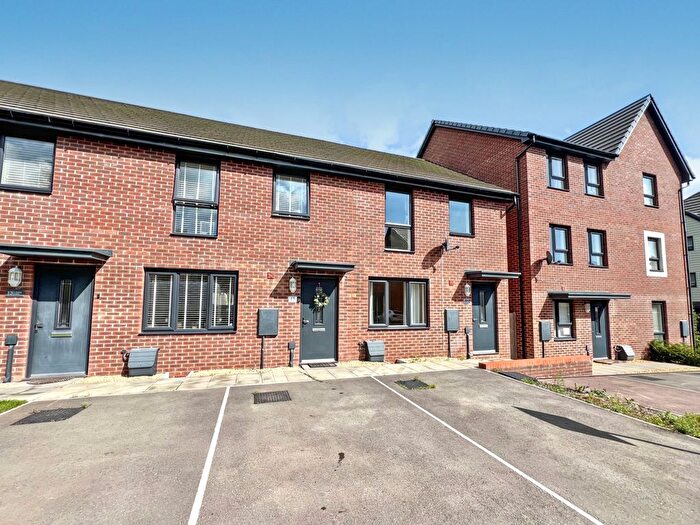
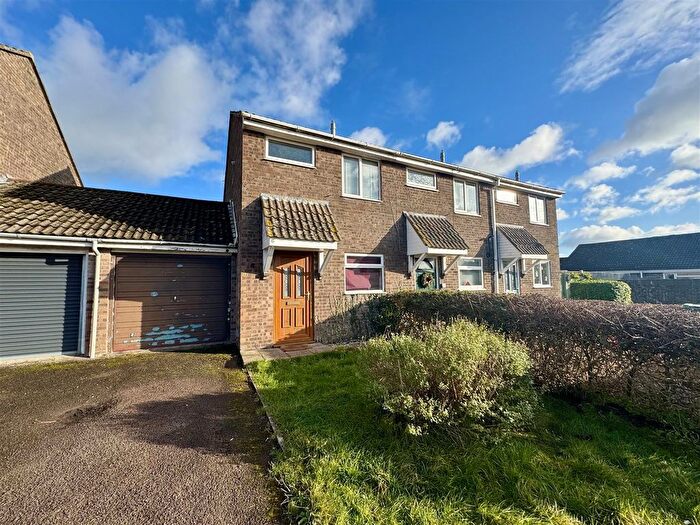
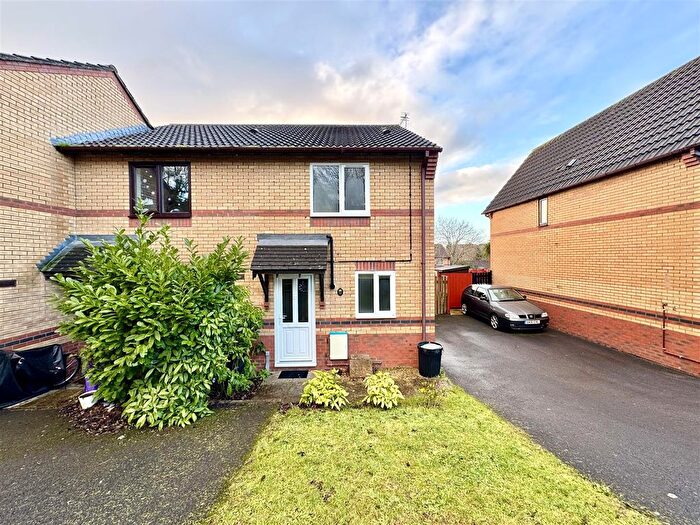
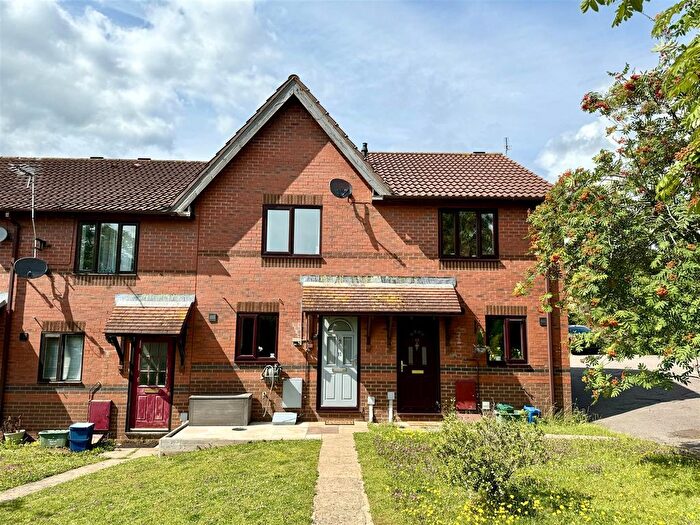
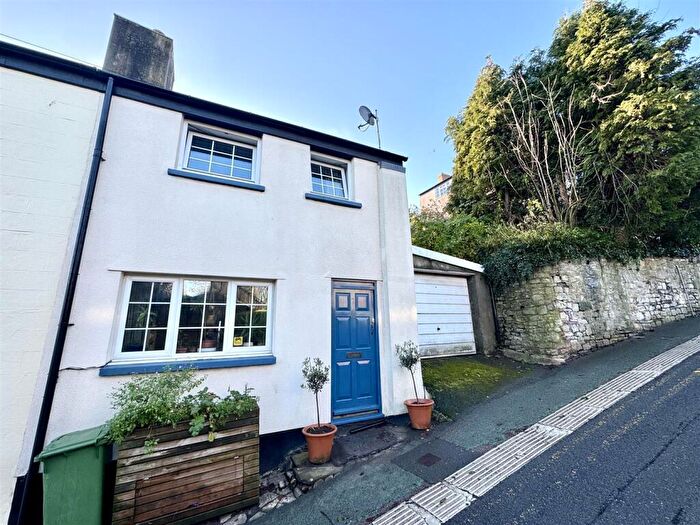
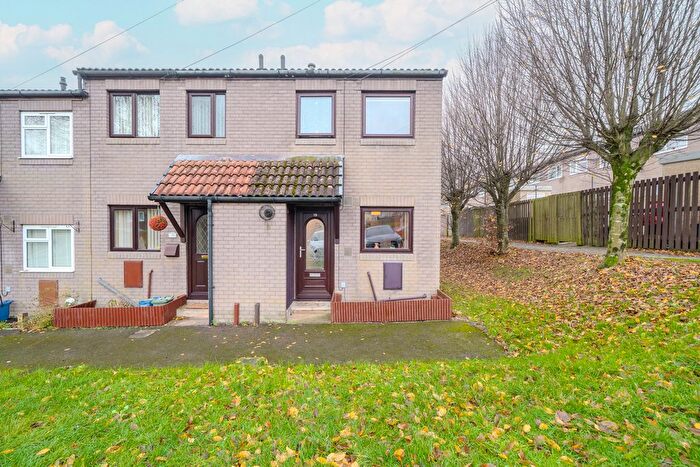
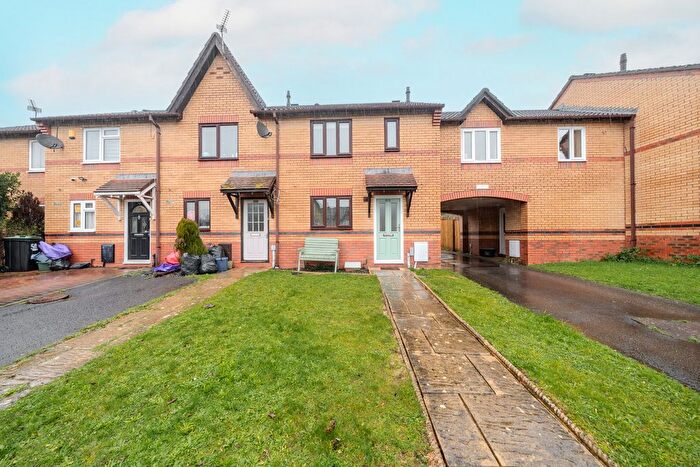
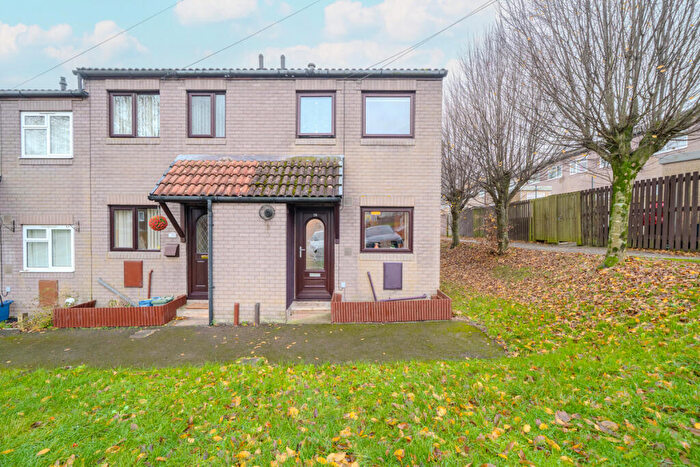
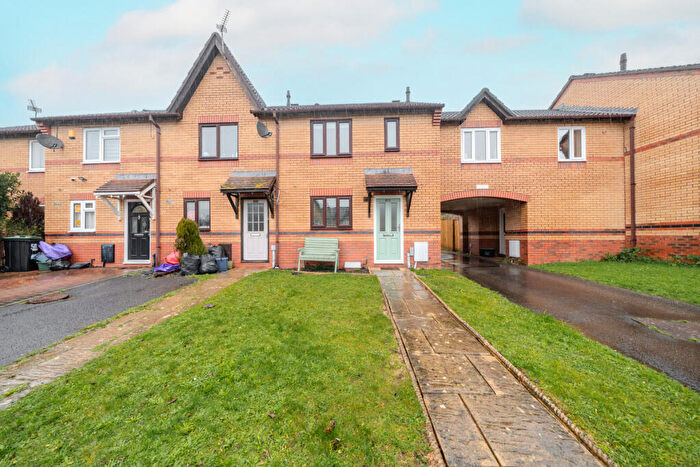
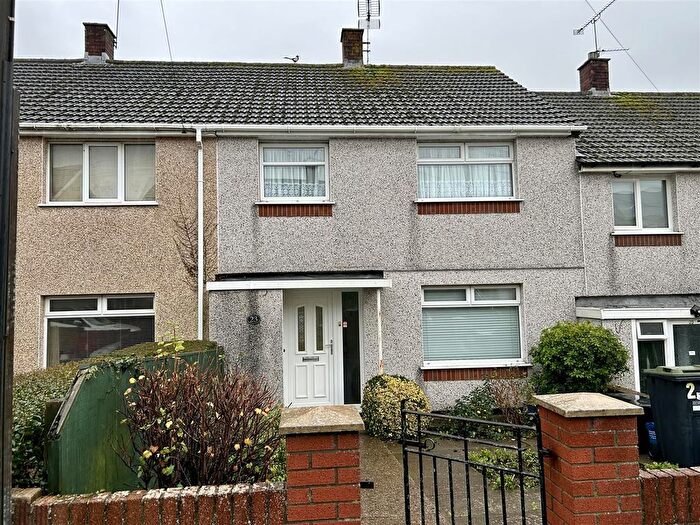
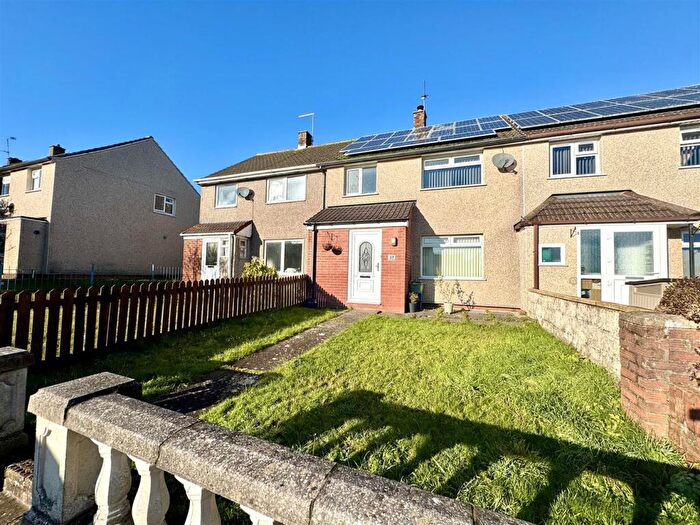
Houses for sale & to rent in St. Christophers, Chepstow
House Prices in St. Christophers
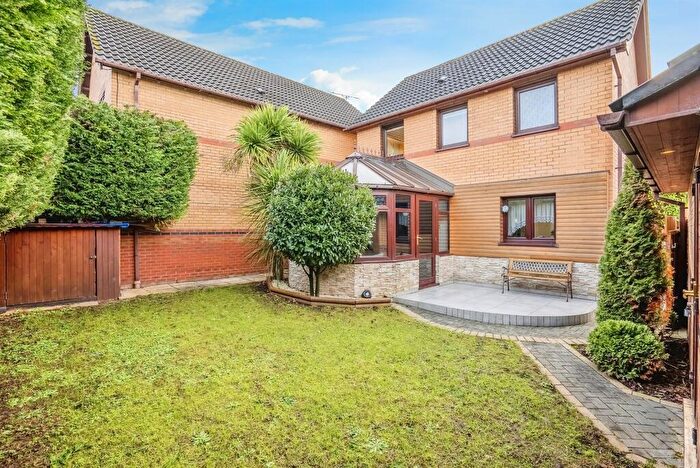
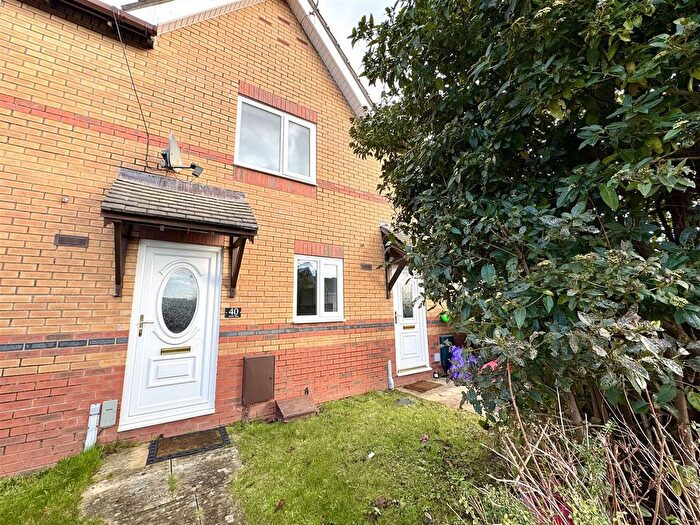
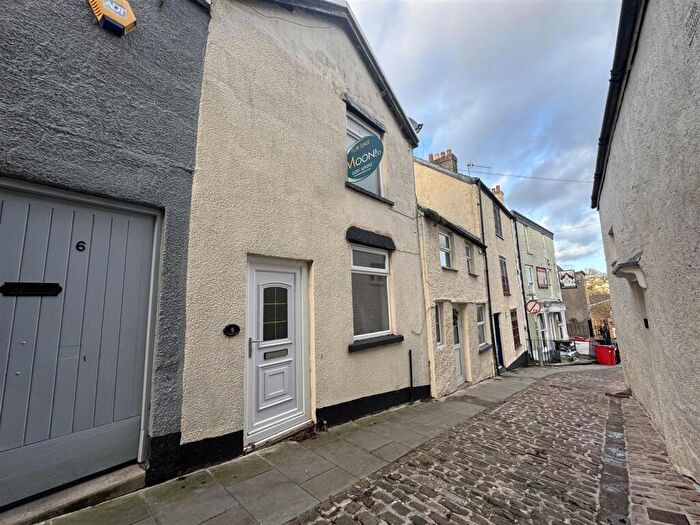
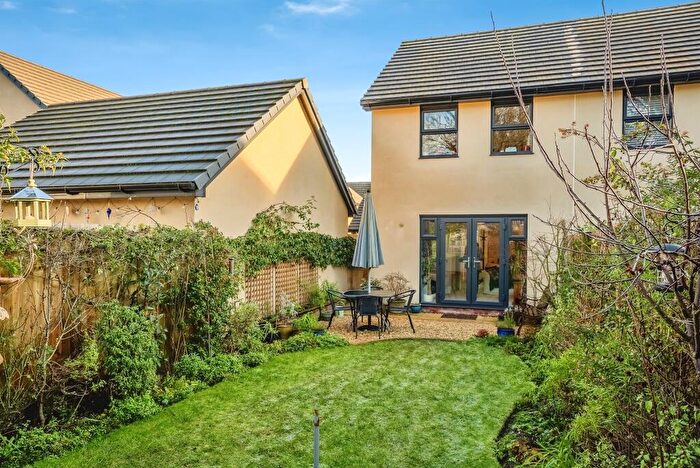
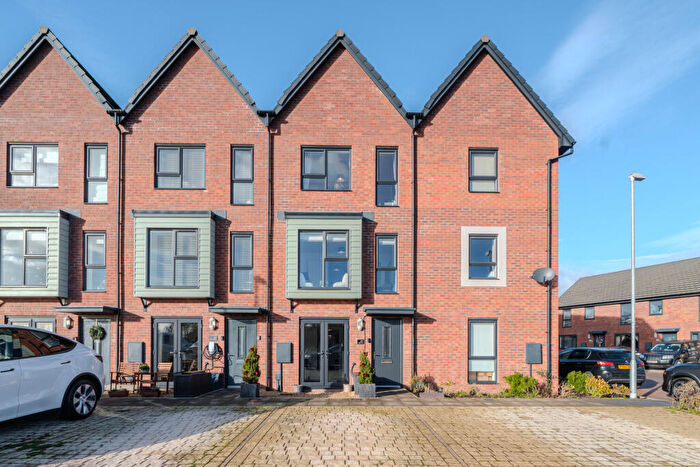
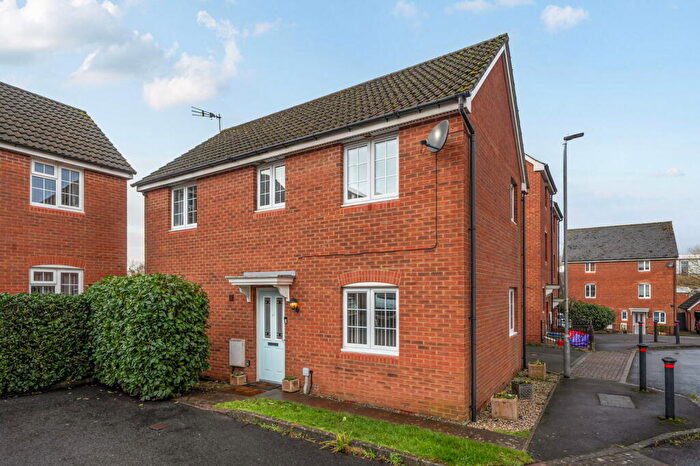
Properties in St. Christophers have an average house price of £249,479.68 and had 125 Property Transactions within the last 3 years¹.
St. Christophers is an area in Chepstow, Sir Fynwy - Monmouthshire with 1,054 households², where the most expensive property was sold for £470,000.00.
Properties for sale in St. Christophers
Roads and Postcodes in St. Christophers
Navigate through our locations to find the location of your next house in St. Christophers, Chepstow for sale or to rent.
| Streets | Postcodes |
|---|---|
| Alexandra Road | NP16 5QU |
| Alpha Road | NP16 5QX |
| Ash Close | NP16 5RB |
| Bluebell Drive | NP16 5TP |
| Brunel Road | NP16 5AP |
| Bulwark Avenue | NP16 5QG NP16 5QQ |
| Bulwark Industrial Estate | NP16 5QZ |
| Bulwark Road | NP16 5JN NP16 5JW |
| Camp Road | NP16 5QT |
| Cedar Close | NP16 5RE |
| Celandine Court | NP16 5TU |
| Channel View | NP16 5AG NP16 5AH NP16 5AJ |
| Cromwell Road | NP16 5AD |
| Heather Close | NP16 5TT |
| Laburnum Way | NP16 5RF |
| Linden Close | NP16 5RN |
| Maple Avenue | NP16 5RG |
| Marsh Road | NP16 5QH |
| Mathern Way | NP16 5AB |
| Meads Court | NP16 5QE |
| Middle Way | NP16 5QR NP16 5QS |
| Oak Close | NP16 5RL |
| Orchard Avenue | NP16 5RD |
| Pembroke Road | NP16 5AF |
| Queens Road | NP16 5AL NP16 5AN |
| Raglan Way | NP16 5QL NP16 5QP |
| Redwood Close | NP16 5RJ |
| Rowan Drive | NP16 5RR |
| St Ewens Road | NP16 5AE |
| Striguil Road | NP16 5AQ |
| Sycamore Avenue | NP16 5RH |
| The Octagon | NP16 5QJ |
| Thornwell Road | NP16 5AA NP16 5NS |
| Victoria Road | NP16 5QN NP16 5QW |
| Willow Close | NP16 5RA |
Transport near St. Christophers
- FAQ
- Price Paid By Year
- Property Type Price
Frequently asked questions about St. Christophers
What is the average price for a property for sale in St. Christophers?
The average price for a property for sale in St. Christophers is £249,480. This amount is 33% lower than the average price in Chepstow. There are 1,061 property listings for sale in St. Christophers.
What streets have the most expensive properties for sale in St. Christophers?
The streets with the most expensive properties for sale in St. Christophers are Cromwell Road at an average of £313,490, Mathern Way at an average of £312,790 and Victoria Road at an average of £293,632.
What streets have the most affordable properties for sale in St. Christophers?
The streets with the most affordable properties for sale in St. Christophers are Meads Court at an average of £135,408, Cedar Close at an average of £209,000 and Linden Close at an average of £217,500.
Which train stations are available in or near St. Christophers?
Some of the train stations available in or near St. Christophers are Chepstow, Severn Beach and Caldicot.
Property Price Paid in St. Christophers by Year
The average sold property price by year was:
| Year | Average Sold Price | Price Change |
Sold Properties
|
|---|---|---|---|
| 2025 | £268,324 | 11% |
23 Properties |
| 2024 | £238,841 | -9% |
35 Properties |
| 2023 | £259,190 | 8% |
31 Properties |
| 2022 | £239,420 | 11% |
36 Properties |
| 2021 | £212,552 | 7% |
53 Properties |
| 2020 | £197,908 | 3% |
17 Properties |
| 2019 | £191,537 | 1% |
27 Properties |
| 2018 | £189,610 | 7% |
34 Properties |
| 2017 | £176,021 | 14% |
39 Properties |
| 2016 | £151,227 | 0,4% |
41 Properties |
| 2015 | £150,655 | 11% |
27 Properties |
| 2014 | £134,262 | 5% |
33 Properties |
| 2013 | £127,320 | 2% |
36 Properties |
| 2012 | £125,001 | -15% |
31 Properties |
| 2011 | £144,205 | 5% |
29 Properties |
| 2010 | £137,233 | 4% |
27 Properties |
| 2009 | £131,571 | -10% |
14 Properties |
| 2008 | £144,567 | 0,3% |
14 Properties |
| 2007 | £144,197 | 4% |
46 Properties |
| 2006 | £138,622 | 2% |
52 Properties |
| 2005 | £136,057 | 11% |
35 Properties |
| 2004 | £121,129 | 19% |
59 Properties |
| 2003 | £97,621 | 21% |
50 Properties |
| 2002 | £76,894 | 14% |
52 Properties |
| 2001 | £66,287.39 | 12% |
46 Properties |
| 2000 | £58,482 | 10% |
49 Properties |
| 1999 | £52,768 | 3% |
49 Properties |
| 1998 | £51,112 | 13% |
41 Properties |
| 1997 | £44,518 | 1% |
55 Properties |
| 1996 | £44,103 | 3% |
42 Properties |
| 1995 | £42,792 | - |
41 Properties |
Property Price per Property Type in St. Christophers
Here you can find historic sold price data in order to help with your property search.
The average Property Paid Price for specific property types in the last three years are:
| Property Type | Average Sold Price | Sold Properties |
|---|---|---|
| Semi Detached House | £270,595.00 | 35 Semi Detached Houses |
| Detached House | £346,800.00 | 5 Detached Houses |
| Terraced House | £242,628.00 | 79 Terraced Houses |
| Flat | £135,408.00 | 6 Flats |

