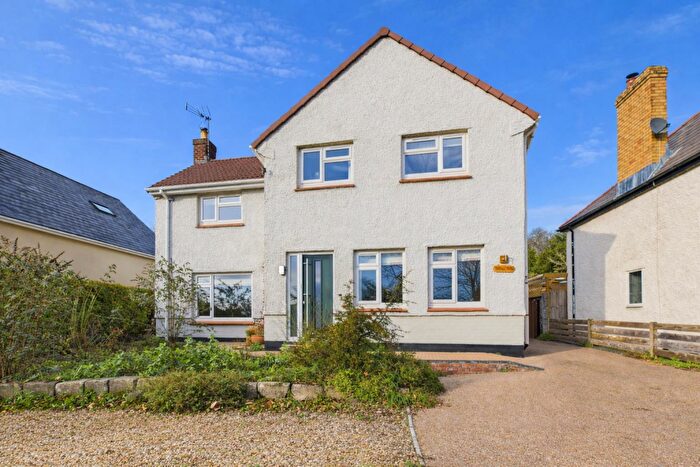
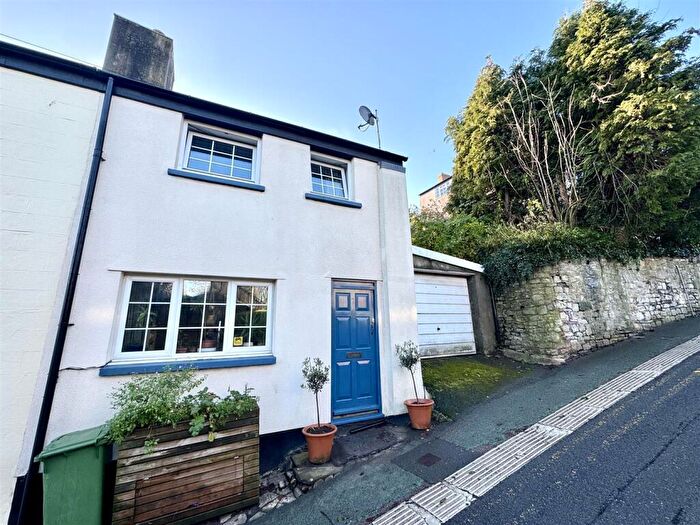
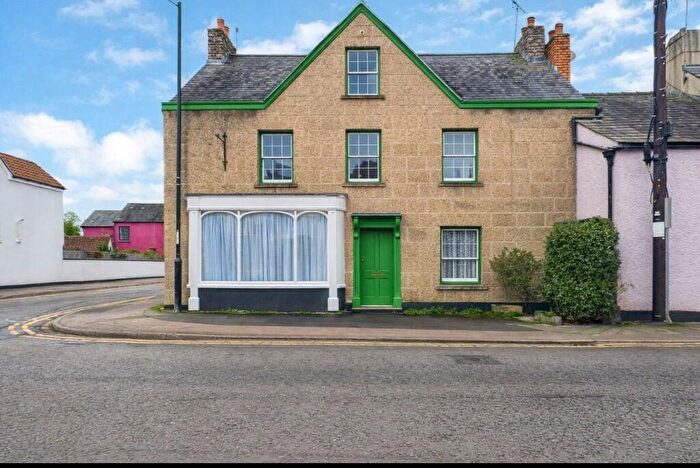
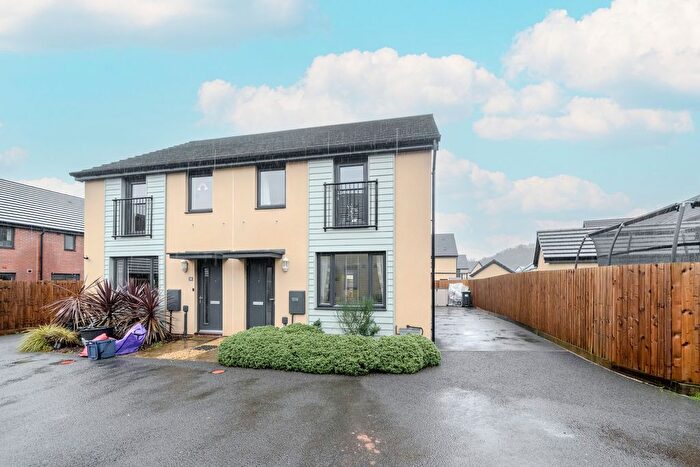
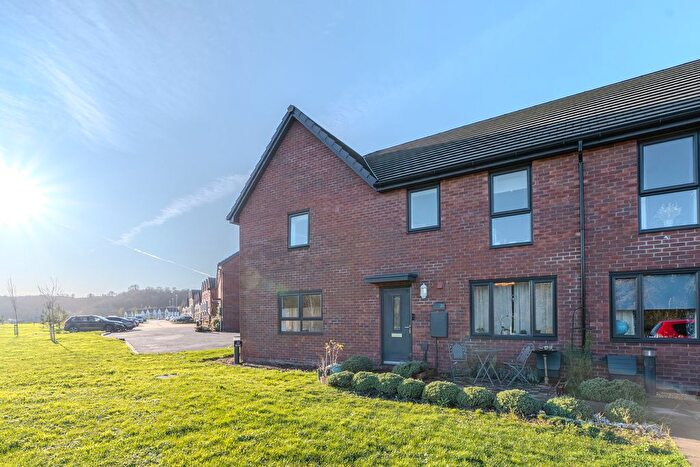
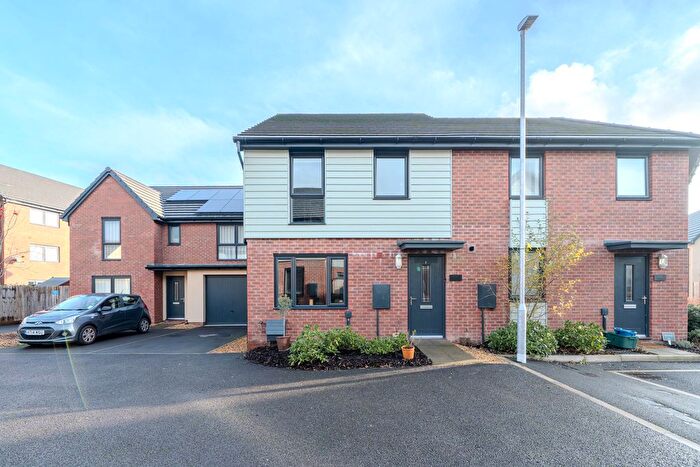
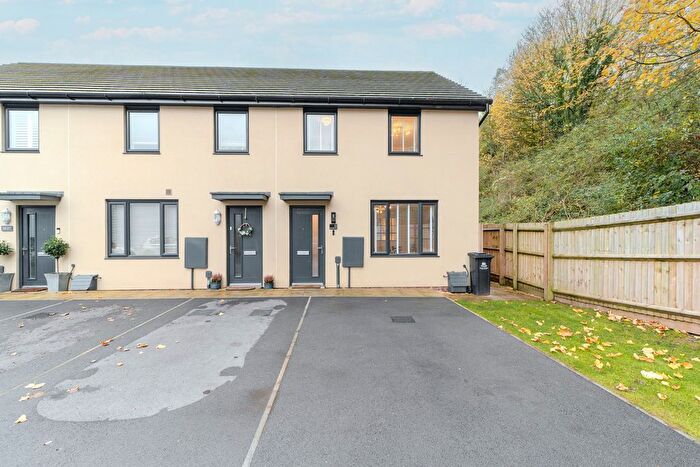
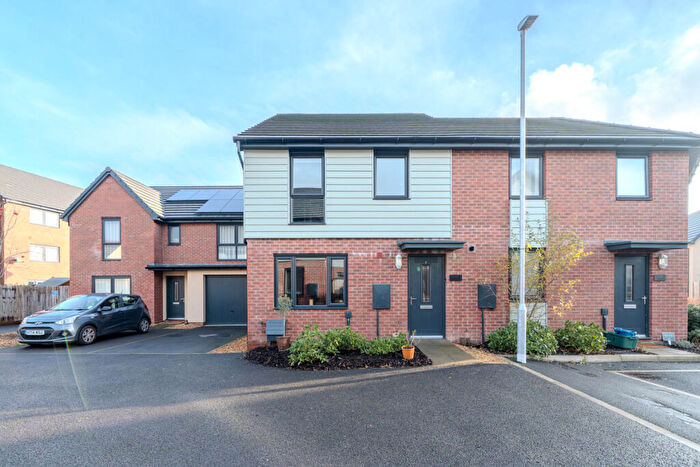
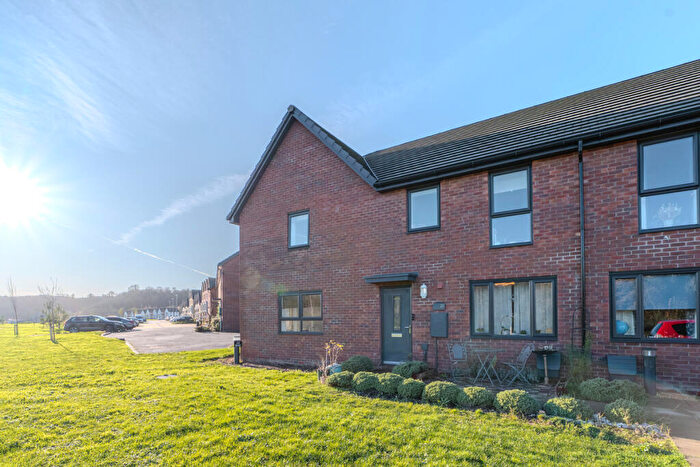
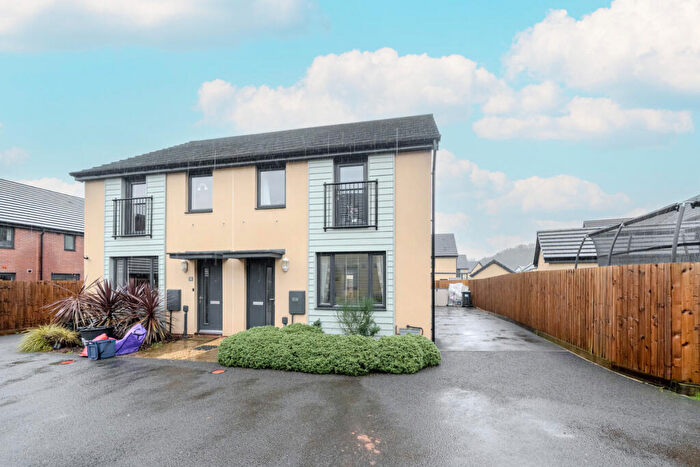
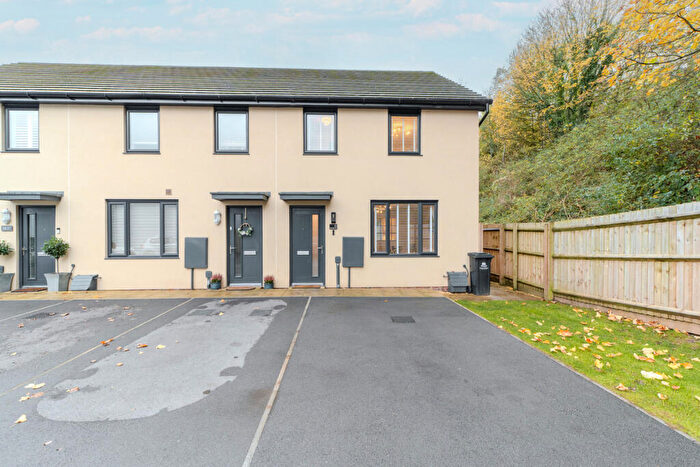
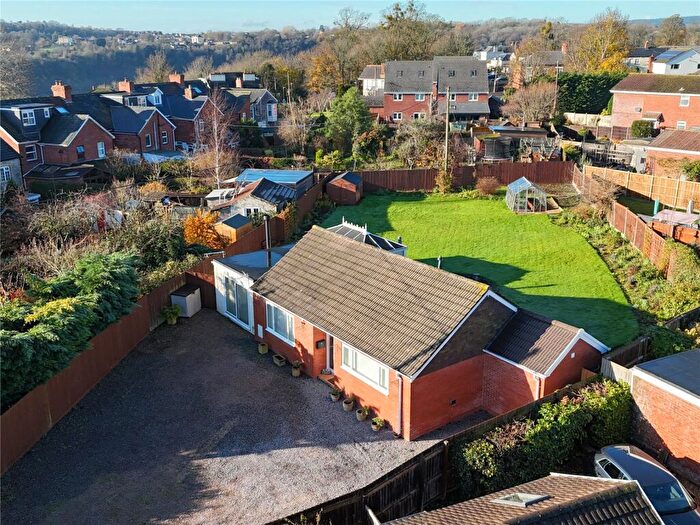
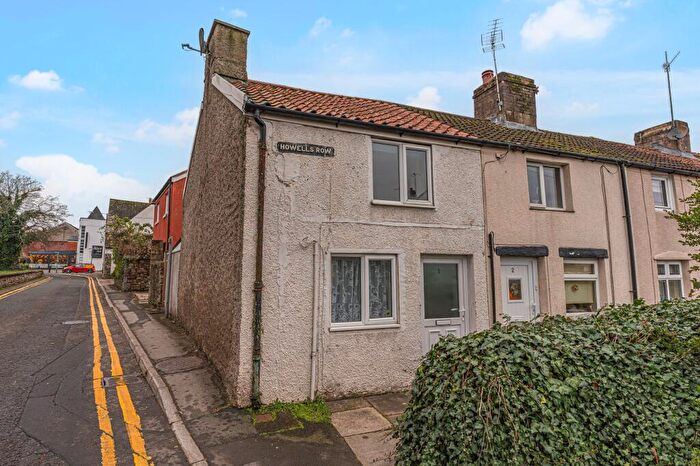
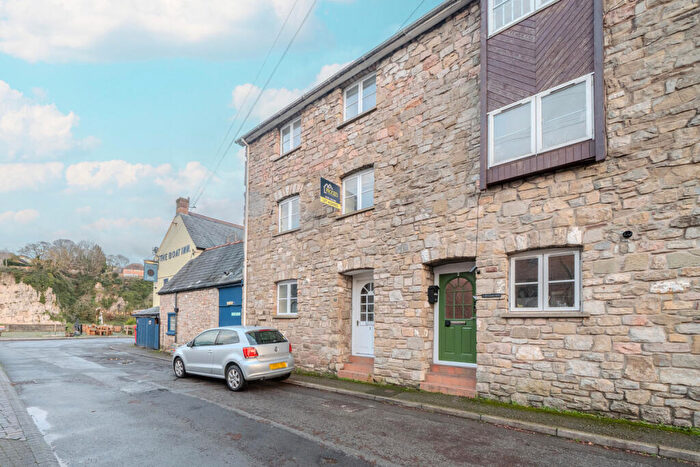
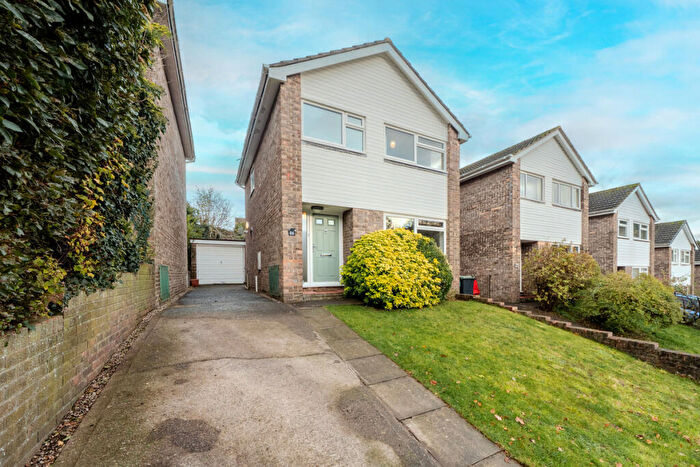
Houses for sale & to rent in St. Marys, Chepstow
House Prices in St. Marys
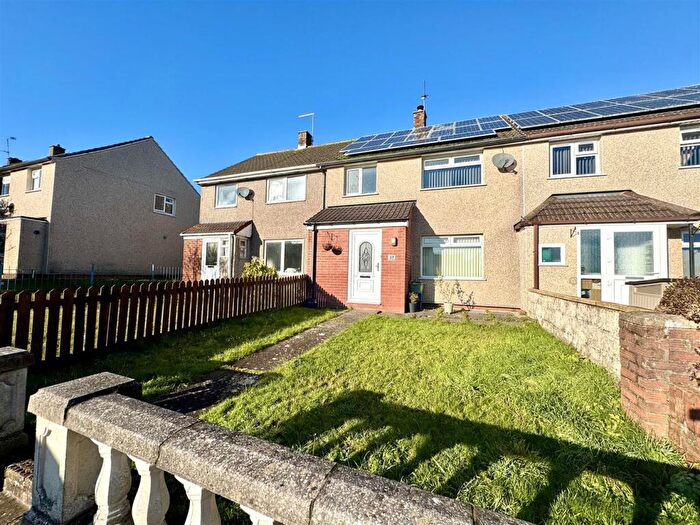
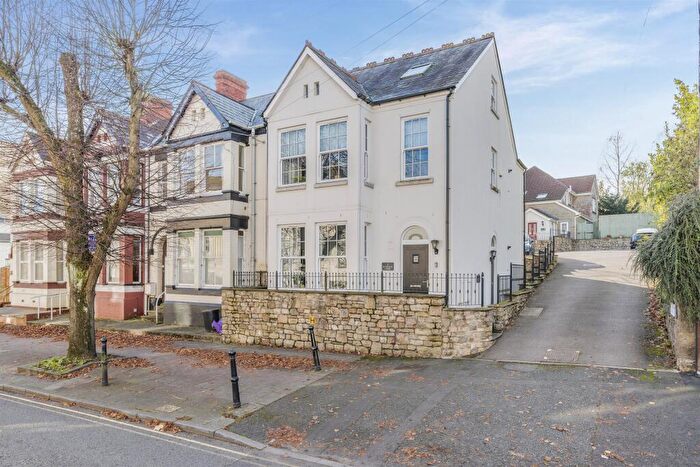
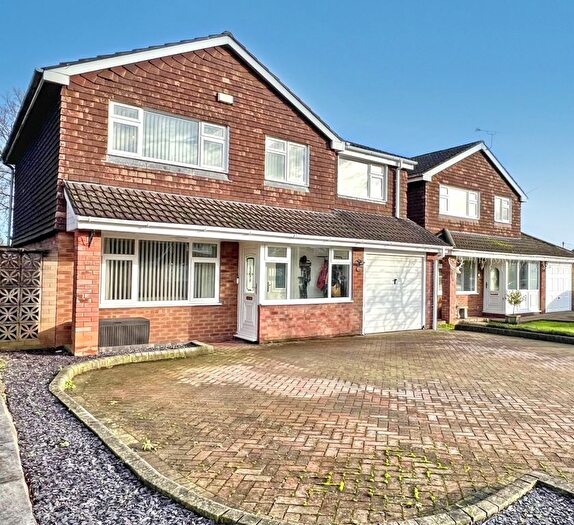
Properties in St. Marys have an average house price of £275,814.36 and had 149 Property Transactions within the last 3 years¹.
St. Marys is an area in Chepstow, Sir Fynwy - Monmouthshire with 1,034 households², where the most expensive property was sold for £700,000.00.
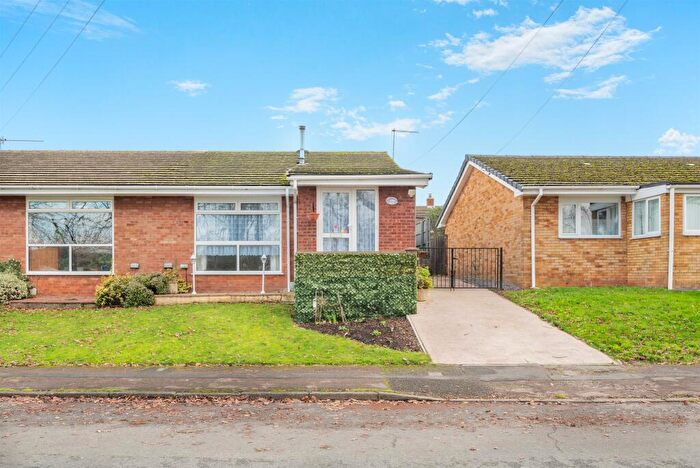
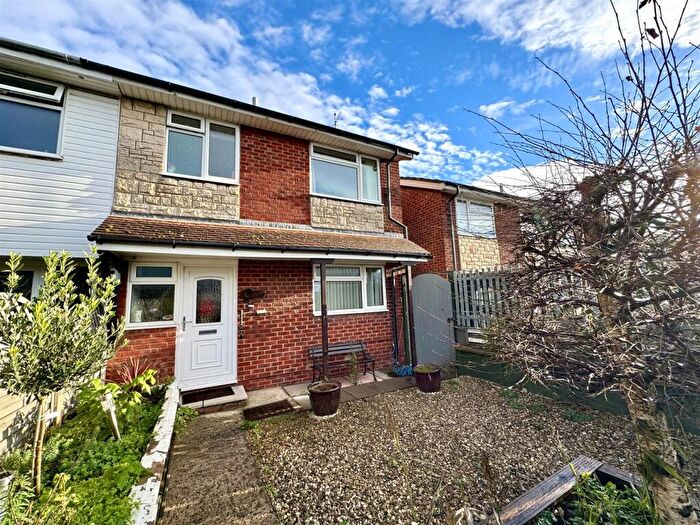
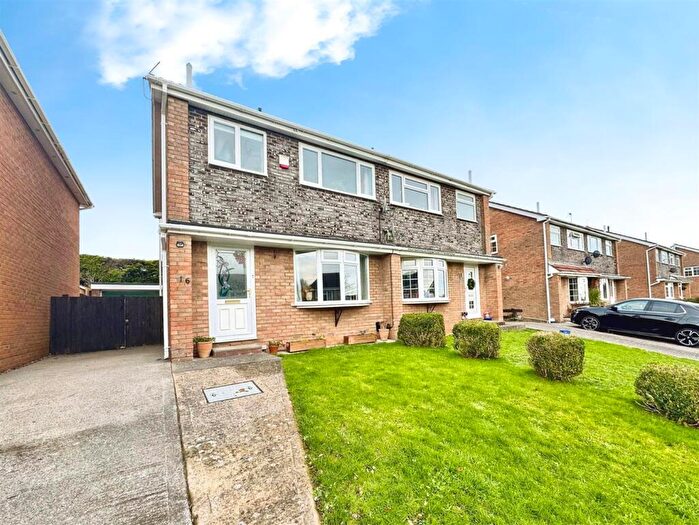
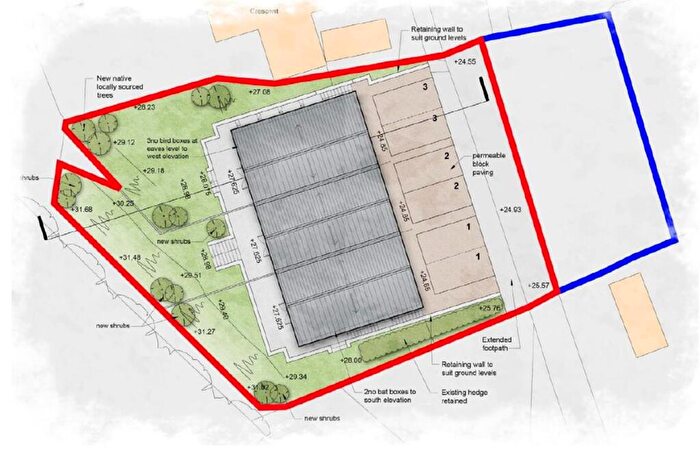
Properties for sale in St. Marys
Roads and Postcodes in St. Marys
Navigate through our locations to find the location of your next house in St. Marys, Chepstow for sale or to rent.
| Streets | Postcodes |
|---|---|
| Albion Square | NP16 5DA |
| Badminton Villas | NP16 5HB |
| Bank Street | NP16 5EL NP16 5EN |
| Beaufort Place | NP16 5PE |
| Beaufort Square | NP16 5EP NP16 5LG NP16 5XJ NP16 5XL |
| Belle Vue Place | NP16 5PL |
| Bridge Street | NP16 5EY NP16 5EZ NP16 5HQ NP16 5ES NP16 5GA |
| Caird Street | NP16 5DX |
| Church Road | NP16 5HP |
| Church Row | NP16 5HN |
| Davis Court | NP16 5EQ |
| Dell View | NP16 5JA |
| Exmouth Place | NP16 5PA |
| Garden City Way | NP16 5EF NP16 5ED |
| Green Street | NP16 5DN NP16 5DP |
| Hardwick Avenue | NP16 5DJ NP16 5DS NP16 5EB |
| Hardwick Terrace | NP16 5DG |
| High Street | NP16 5LH NP16 5LJ NP16 5LQ NP16 5XQ NP16 5XX NP16 5XY |
| High View | NP16 5QB |
| Hocker Hill Street | NP16 5ER |
| Hollins Close | NP16 5HY |
| Howells Row | NP16 5HR |
| Hughes Crescent | NP16 5DY |
| Huntfield Cottages | NP16 5LP |
| Kendall Square | NP16 5HL |
| Lower Church Street | NP16 5HJ NP16 5HX |
| Manor Way | NP16 5HZ |
| Middle Street | NP16 5ET |
| Mill Lane Industrial Estate | NP16 5QD |
| Moor Street | NP16 5DB NP16 5DD NP16 5DF NP16 5DE NP16 5XW |
| Mount Pleasant | NP16 5PS NP16 5PT NP16 5PU |
| Mount Way | NP16 5NF |
| Mounton Road | NP16 5BS |
| Myrtle Place | NP16 5HW |
| Nelson Street | NP16 5HT |
| Oxford Street | NP16 5PQ |
| Portwall Road | NP16 5DL |
| Riflemans Way | NP16 5EJ |
| River View | NP16 5AX |
| Rockwood Road | NP16 5DT |
| School Hill | NP16 5BZ |
| School Hill Trading Estate | NP16 5PH |
| Severn Crescent | NP16 5EA NP16 5DZ |
| Severn Quay | NP16 5FG NP16 5FH |
| Somerset Cottages | NP16 5HF |
| St Ann Street | NP16 5HE |
| St Mary Street | NP16 5EU NP16 5EW |
| Station Road | NP16 5PB NP16 5PD NP16 5UL NP16 5XA |
| Station Yard Industrial Estate | NP16 5PF |
| Steep Street | NP16 5PJ |
| The Back | NP16 5HH NP16 5HS NP16 5FY |
| The Gables | NP16 5HD |
| The Mount | NP16 5UJ |
| Thomas Street | NP16 5DH |
| Town Gate Mews | NP16 5FE |
| Upper Church Street | NP16 5EX NP16 5HU NP16 5HA |
| Upper Nelson Street | NP16 5PG |
| Waters Road | NP16 5EE |
| Welsh Street | NP16 5LN NP16 5LR NP16 5LL NP16 5UQ NP16 5UW NP16 5XG |
| Wye Crescent | NP16 5DW NP16 5DQ |
| NP16 5DR NP16 5UZ NP16 5WD NP16 5XH NP16 5YE NP16 6ZD NP16 7WP NP16 7WZ NP16 9AQ NP16 9AX NP16 9BL NP16 9BQ NP16 9BZ |
Transport near St. Marys
-
Chepstow Station
-
Caldicot Station
-
Severn Beach Station
-
Severn Tunnel Junction Station
-
Pilning Station
-
Lydney Station
-
St.Andrew's Road Station
-
Patchway Station
-
Avonmouth Station
- FAQ
- Price Paid By Year
- Property Type Price
Frequently asked questions about St. Marys
What is the average price for a property for sale in St. Marys?
The average price for a property for sale in St. Marys is £275,814. This amount is 26% lower than the average price in Chepstow. There are 1,295 property listings for sale in St. Marys.
What streets have the most expensive properties for sale in St. Marys?
The streets with the most expensive properties for sale in St. Marys are Mount Way at an average of £559,500, Mounton Road at an average of £451,900 and Portwall Road at an average of £352,500.
What streets have the most affordable properties for sale in St. Marys?
The streets with the most affordable properties for sale in St. Marys are Kendall Square at an average of £180,000, Garden City Way at an average of £180,658 and School Hill at an average of £189,790.
Which train stations are available in or near St. Marys?
Some of the train stations available in or near St. Marys are Chepstow, Caldicot and Severn Beach.
Property Price Paid in St. Marys by Year
The average sold property price by year was:
| Year | Average Sold Price | Price Change |
Sold Properties
|
|---|---|---|---|
| 2025 | £275,514.29 | -5% |
28 Properties |
| 2024 | £288,675.64 | 10% |
39 Properties |
| 2023 | £258,512.86 | -11% |
35 Properties |
| 2022 | £286,855.18 | -1% |
56 Properties |
| 2021 | £290,208.93 | 11% |
56 Properties |
| 2020 | £259,481.48 | -0,3% |
27 Properties |
| 2019 | £260,168.62 | 14% |
55 Properties |
| 2018 | £224,931.73 | 12% |
52 Properties |
| 2017 | £197,627.2 | -5% |
45 Properties |
| 2016 | £208,213.21 | 9% |
53 Properties |
| 2015 | £190,285.56 | 1% |
45 Properties |
| 2014 | £188,236 | 17% |
60 Properties |
| 2013 | £156,072 | -6% |
32 Properties |
| 2012 | £164,806 | -9% |
31 Properties |
| 2011 | £179,097 | 10% |
42 Properties |
| 2010 | £161,167 | -17% |
47 Properties |
| 2009 | £188,117 | 10% |
24 Properties |
| 2008 | £170,158 | -9% |
29 Properties |
| 2007 | £184,981 | 16% |
66 Properties |
| 2006 | £154,786.88 | -11% |
67 Properties |
| 2005 | £171,133.64 | 12% |
55 Properties |
| 2004 | £150,805.47 | 19% |
64 Properties |
| 2003 | £122,449 | 20% |
66 Properties |
| 2002 | £98,393.47 | 21% |
102 Properties |
| 2001 | £77,343 | 5% |
69 Properties |
| 2000 | £73,643.58 | 5% |
67 Properties |
| 1999 | £69,740.43 | 8% |
70 Properties |
| 1998 | £64,337 | 11% |
62 Properties |
| 1997 | £57,338 | 8% |
50 Properties |
| 1996 | £52,971 | -12% |
57 Properties |
| 1995 | £59,066.22 | - |
37 Properties |
Property Price per Property Type in St. Marys
Here you can find historic sold price data in order to help with your property search.
The average Property Paid Price for specific property types in the last three years are:
| Property Type | Average Sold Price | Sold Properties |
|---|---|---|
| Semi Detached House | £302,555.00 | 17 Semi Detached Houses |
| Detached House | £468,555.00 | 18 Detached Houses |
| Terraced House | £276,092.00 | 66 Terraced Houses |
| Flat | £193,683.33 | 48 Flats |

