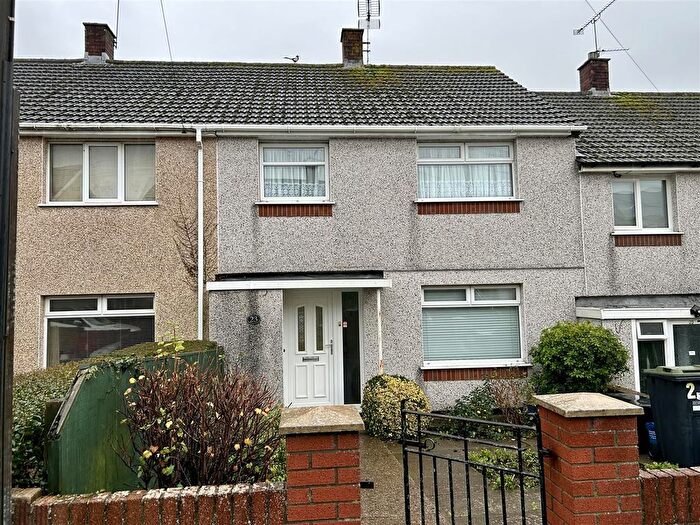
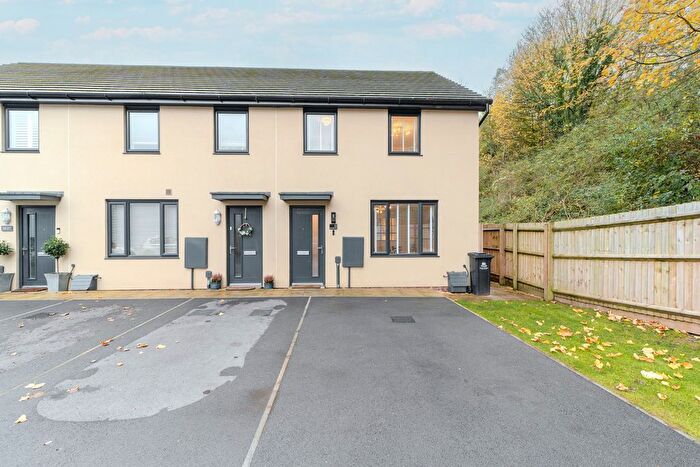
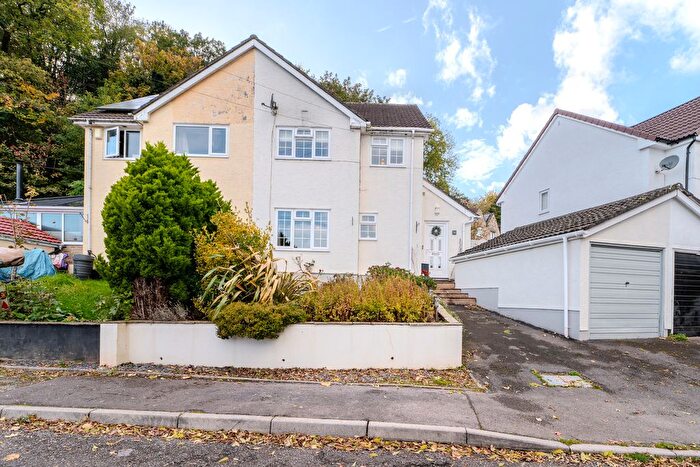
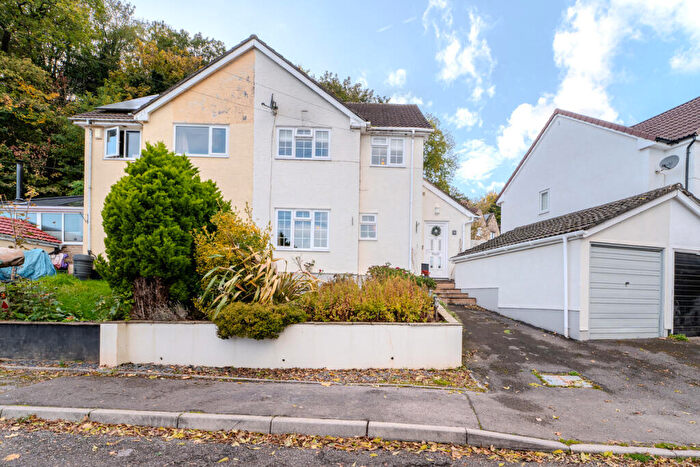
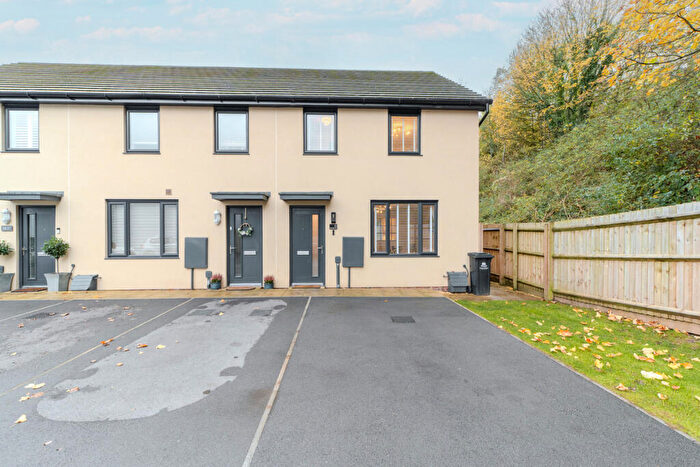
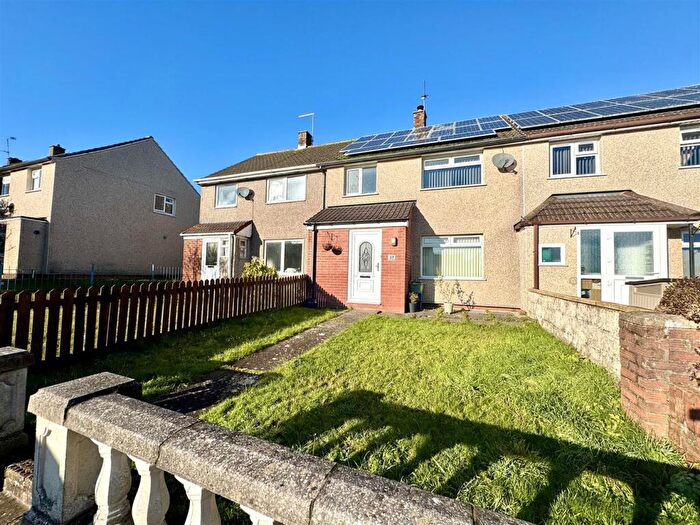
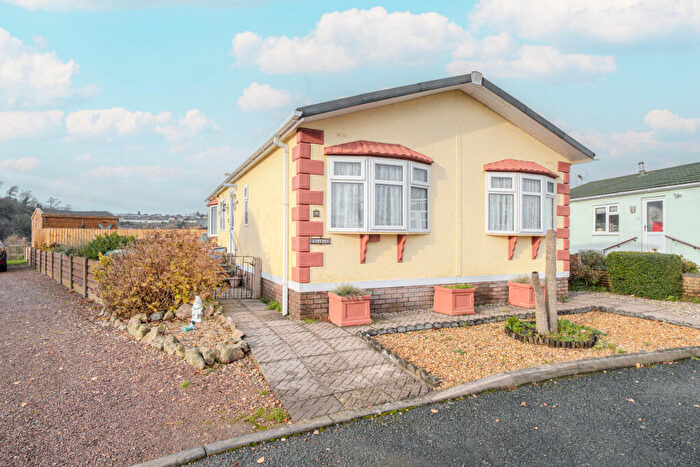
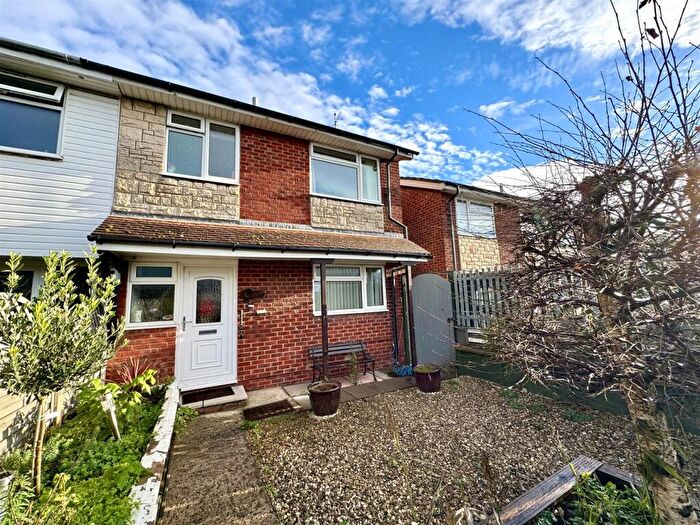
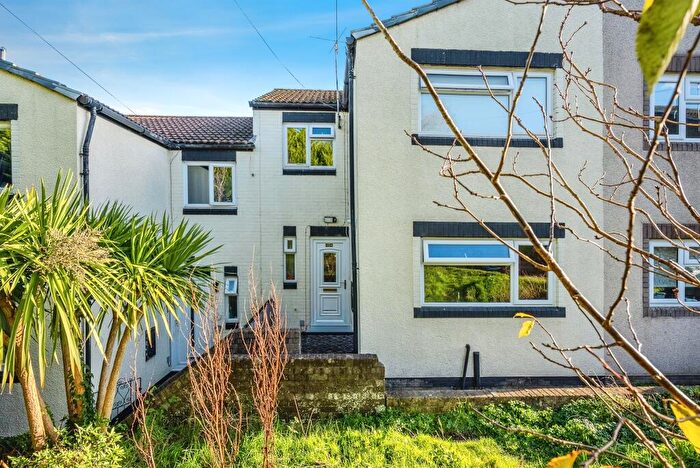
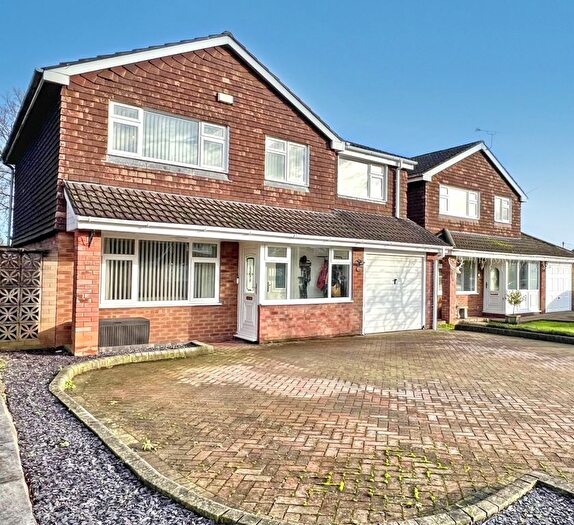
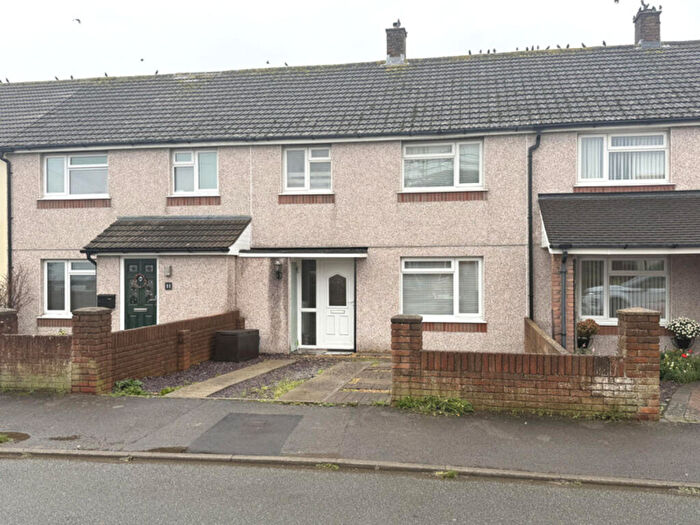
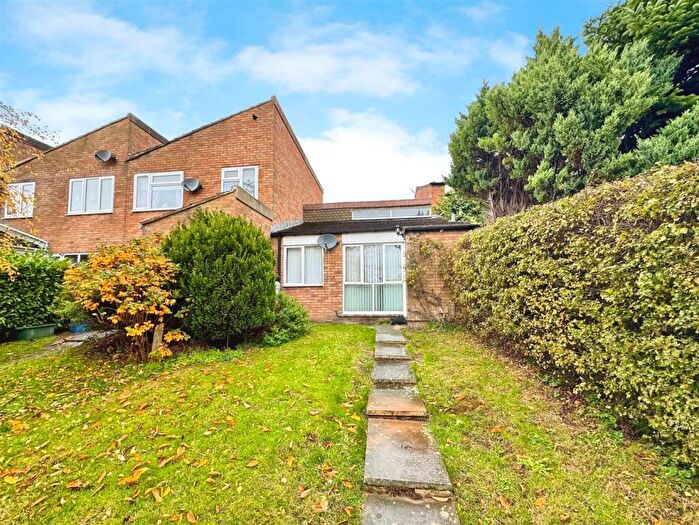
Houses for sale & to rent in Thornwell, Chepstow
House Prices in Thornwell
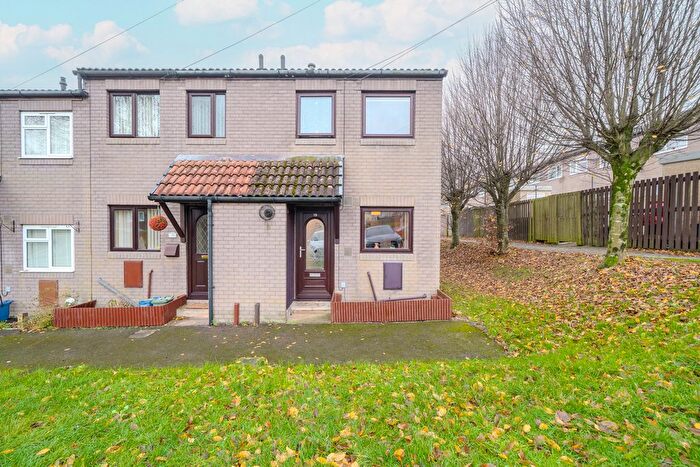
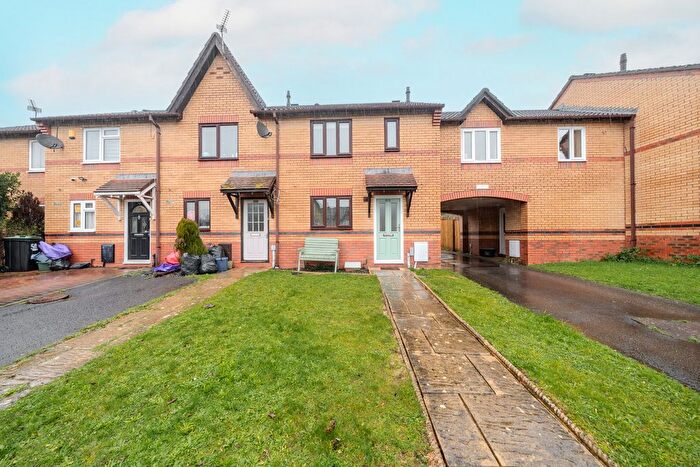
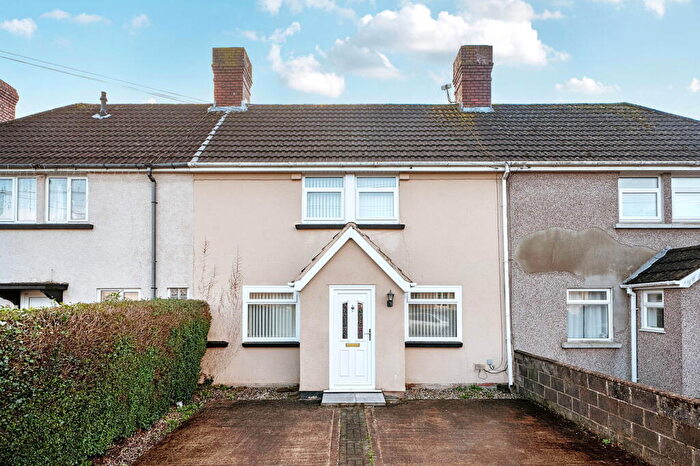
Properties in Thornwell have an average house price of £258,172.00 and had 145 Property Transactions within the last 3 years¹.
Thornwell is an area in Chepstow, Sir Fynwy - Monmouthshire with 1,137 households², where the most expensive property was sold for £430,000.00.
Properties for sale in Thornwell
Roads and Postcodes in Thornwell
Navigate through our locations to find the location of your next house in Thornwell, Chepstow for sale or to rent.
| Streets | Postcodes |
|---|---|
| Alice Crescent | NP16 5SW |
| Alma Drive | NP16 5SY |
| Aust Crescent | NP16 5NJ NP16 5NL |
| Beaufort Park Way | NP16 5UH |
| Bishops Close | NP16 5TE |
| Bowsher Court | NP16 5UD |
| Briton Close | NP16 5SX |
| Burnt Barn Road | NP16 5AR NP16 5NG NP16 5UP |
| Caerwent Lane | NP16 5TQ |
| Chartist Way | NP16 5NQ |
| Cider Mill Close | NP16 5RY |
| Clarendon Close | NP16 5TL |
| Collingwood Close | NP16 5SU |
| Denbigh Drive | NP16 5TY |
| Fern Court | NP16 5TS |
| Fishermans Walk | NP16 5QF |
| Fountain Way | NP16 5SZ |
| Garvey Close | NP16 5TD |
| Grasmere Way | NP16 5SS |
| Hawthorn Close | NP16 5RS |
| Holly Close | NP16 5RP |
| Hopewell Close | NP16 5ST |
| James Stephens Way | NP16 5GE |
| John Rastrick Rise | NP16 5GF |
| Lady Margaret Court | NP16 5RW |
| Lewis Way | NP16 5TA |
| Lord Eldon Drive | NP16 5RU |
| Magnolia Close | NP16 5TR |
| Maple Avenue | NP16 5RT |
| Mariners Reach | NP16 5SR |
| New House Farm Industrial Estate | NP16 6UN |
| Newhouse Farm Industrial Estate | NP16 6UD |
| Old Oak Close | NP16 5TF |
| Phoenix Drive | NP16 5TJ |
| Preston Close | NP16 5TB |
| Rougemont Grove | NP16 5SQ |
| Rowan Drive | NP16 5RQ |
| Samuel Rodgers Crescent | NP16 5GB |
| Severn Cross Distribution Park | NP16 6UP |
| Sharpes Way | NP16 5TG |
| Somerset Way | NP16 5NP NP16 5NR |
| Summerhouse Lane | NP16 5SP |
| Tenby Lane | NP16 5GH |
| The Headland | NP16 5FA |
| The Hop Garden | NP16 5RX |
| The Reddings | NP16 5NY |
| Thorn Tree Drive | NP16 5SH |
| Thornwell Road | NP16 5NT |
| Valentine Lane | NP16 5TH |
| Warren Slade | NP16 5NX |
| Well Close | NP16 5RZ |
| Western Avenue | NP16 5NH NP16 5NN NP16 5NW |
| NP16 5AS |
Transport near Thornwell
- FAQ
- Price Paid By Year
- Property Type Price
Frequently asked questions about Thornwell
What is the average price for a property for sale in Thornwell?
The average price for a property for sale in Thornwell is £258,172. This amount is 31% lower than the average price in Chepstow. There are 660 property listings for sale in Thornwell.
What streets have the most expensive properties for sale in Thornwell?
The streets with the most expensive properties for sale in Thornwell are Hopewell Close at an average of £405,000, Mariners Reach at an average of £372,000 and Old Oak Close at an average of £362,000.
What streets have the most affordable properties for sale in Thornwell?
The streets with the most affordable properties for sale in Thornwell are Holly Close at an average of £213,583, Rowan Drive at an average of £219,500 and Preston Close at an average of £227,750.
Which train stations are available in or near Thornwell?
Some of the train stations available in or near Thornwell are Chepstow, Severn Beach and Caldicot.
Property Price Paid in Thornwell by Year
The average sold property price by year was:
| Year | Average Sold Price | Price Change |
Sold Properties
|
|---|---|---|---|
| 2025 | £253,291 | -1% |
29 Properties |
| 2024 | £256,345 | 1% |
35 Properties |
| 2023 | £254,835 | -5% |
44 Properties |
| 2022 | £267,694 | 14% |
37 Properties |
| 2021 | £229,535 | -0,5% |
71 Properties |
| 2020 | £230,609 | 3% |
25 Properties |
| 2019 | £223,200 | 13% |
40 Properties |
| 2018 | £194,616 | -1% |
37 Properties |
| 2017 | £196,810 | 19% |
47 Properties |
| 2016 | £158,732 | -3% |
65 Properties |
| 2015 | £163,441 | 9% |
64 Properties |
| 2014 | £148,801 | 3% |
44 Properties |
| 2013 | £144,043 | 3% |
50 Properties |
| 2012 | £139,078 | 3% |
25 Properties |
| 2011 | £134,224 | -1% |
38 Properties |
| 2010 | £135,508 | 5% |
29 Properties |
| 2009 | £129,406 | -31% |
32 Properties |
| 2008 | £169,633 | 0,3% |
55 Properties |
| 2007 | £169,153 | 12% |
72 Properties |
| 2006 | £148,440 | 10% |
59 Properties |
| 2005 | £133,507 | 0,4% |
58 Properties |
| 2004 | £132,910 | 16% |
64 Properties |
| 2003 | £111,629 | 19% |
55 Properties |
| 2002 | £90,525 | 18% |
85 Properties |
| 2001 | £74,624 | 14% |
76 Properties |
| 2000 | £64,396 | 12% |
69 Properties |
| 1999 | £56,364 | 4% |
85 Properties |
| 1998 | £53,830 | 4% |
54 Properties |
| 1997 | £51,671 | 9% |
85 Properties |
| 1996 | £47,210 | -8% |
78 Properties |
| 1995 | £50,856 | - |
81 Properties |
Property Price per Property Type in Thornwell
Here you can find historic sold price data in order to help with your property search.
The average Property Paid Price for specific property types in the last three years are:
| Property Type | Average Sold Price | Sold Properties |
|---|---|---|
| Semi Detached House | £252,270.00 | 38 Semi Detached Houses |
| Detached House | £346,321.00 | 26 Detached Houses |
| Terraced House | £233,580.00 | 80 Terraced Houses |
| Flat | £158,000.00 | 1 Flat |

