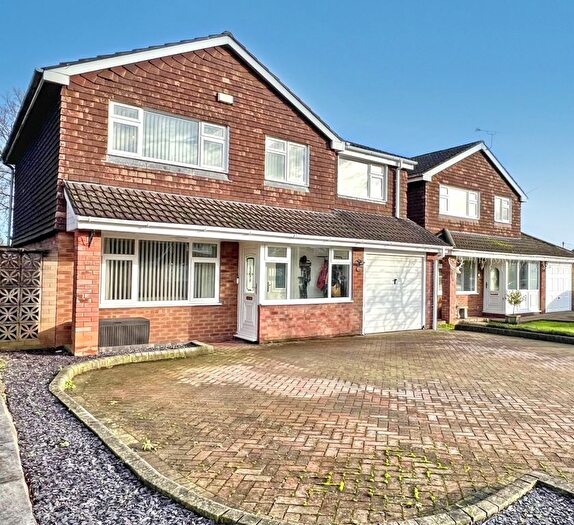
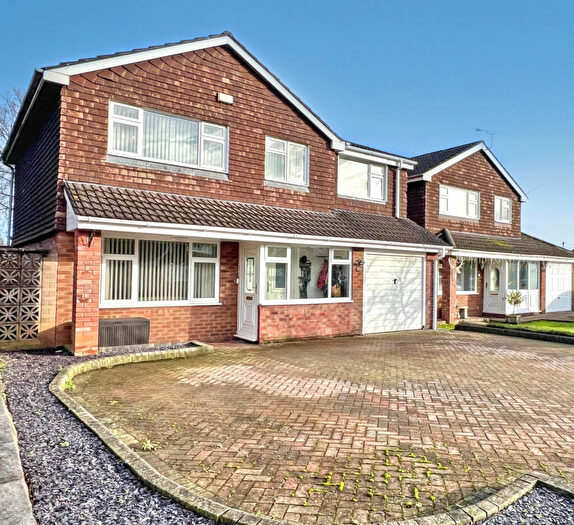
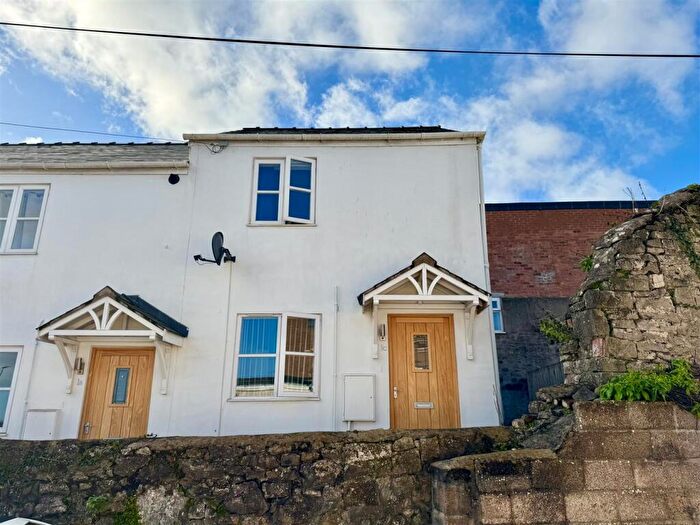
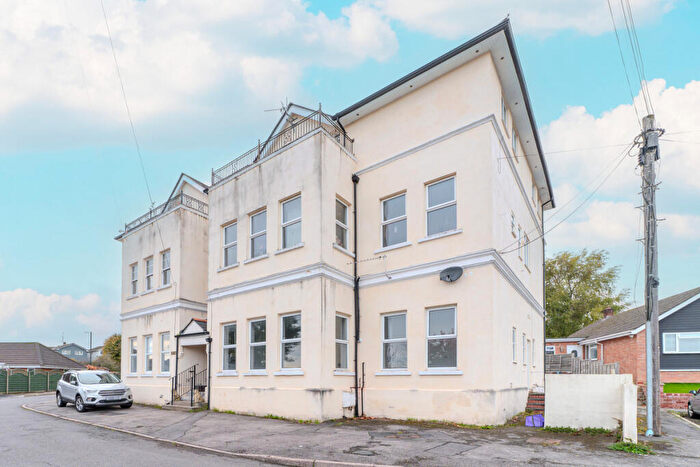
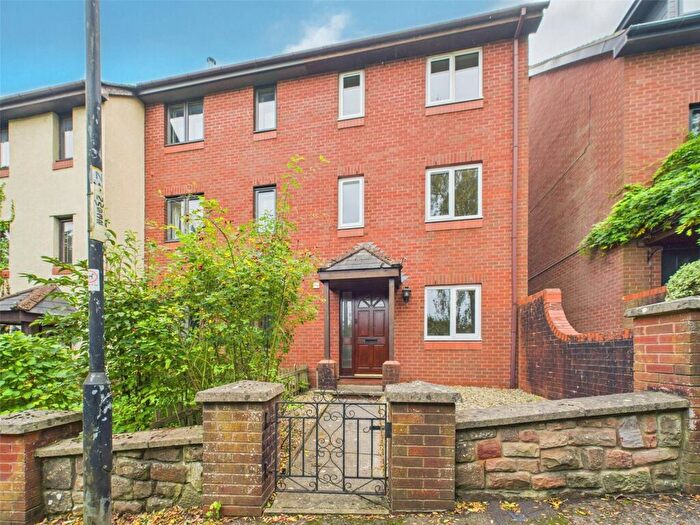
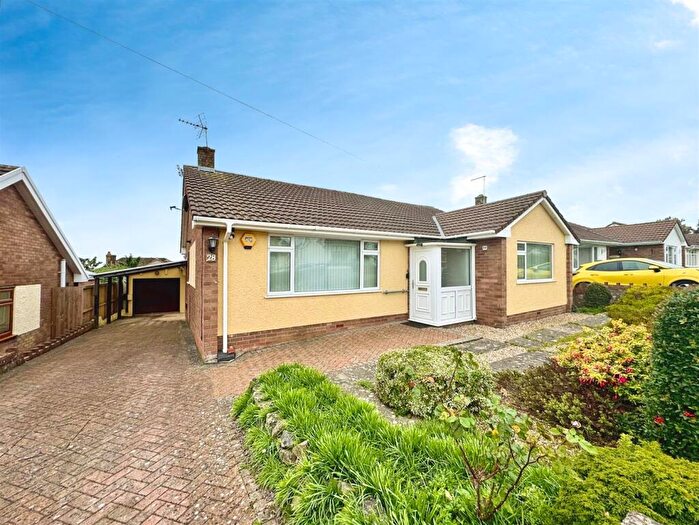
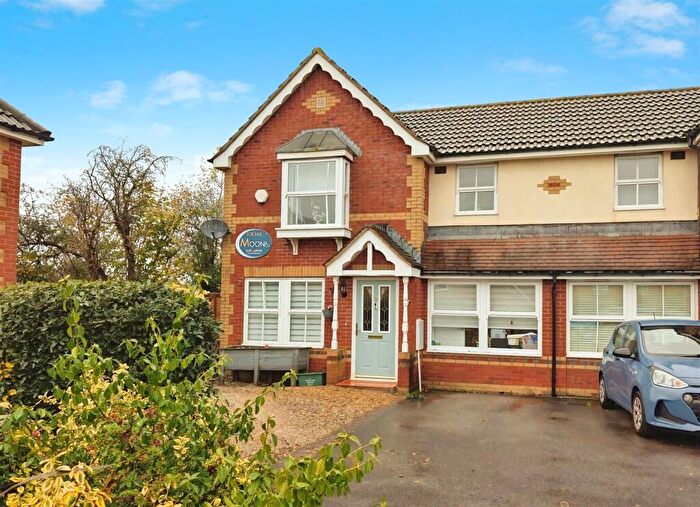
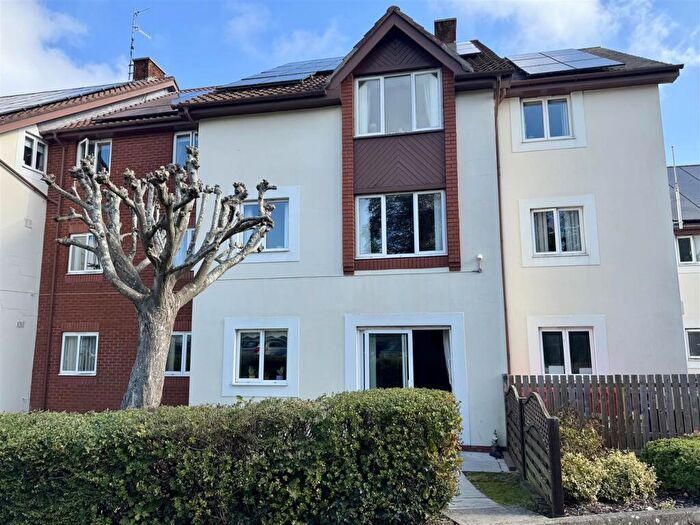
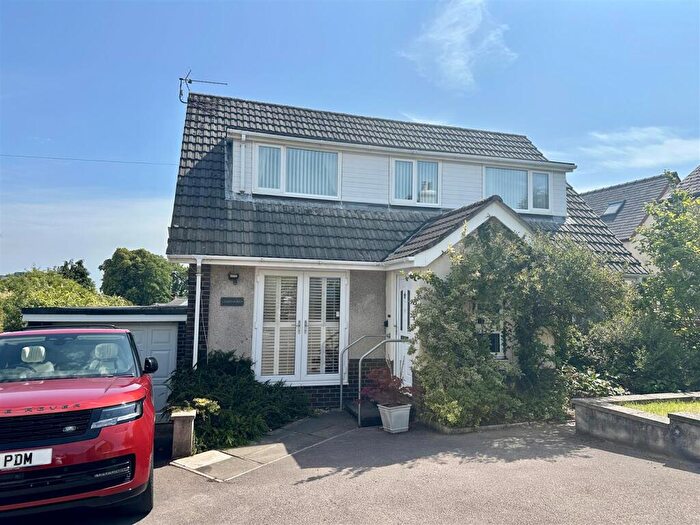
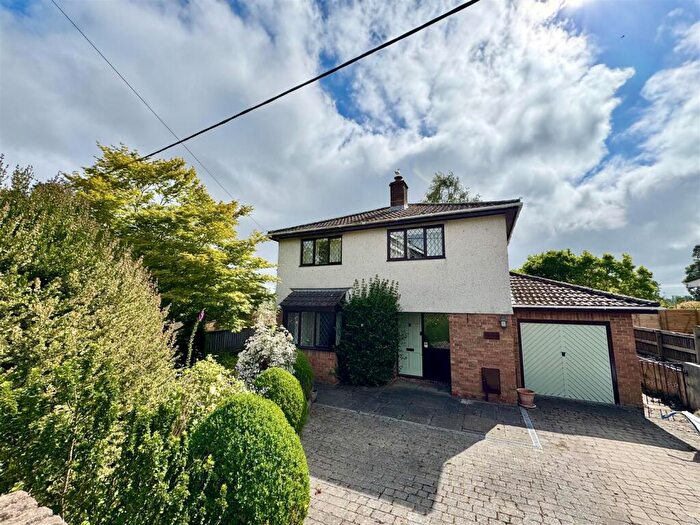
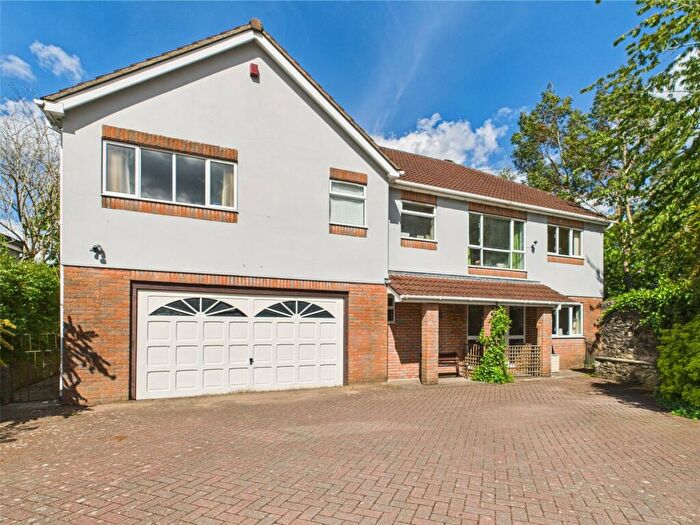
Houses for sale & to rent in St. Kingsmark, Chepstow
House Prices in St. Kingsmark
Properties in St. Kingsmark have an average house price of £402,999.00 and had 177 Property Transactions within the last 3 years¹.
St. Kingsmark is an area in Chepstow, Sir Fynwy - Monmouthshire with 1,156 households², where the most expensive property was sold for £815,000.00.
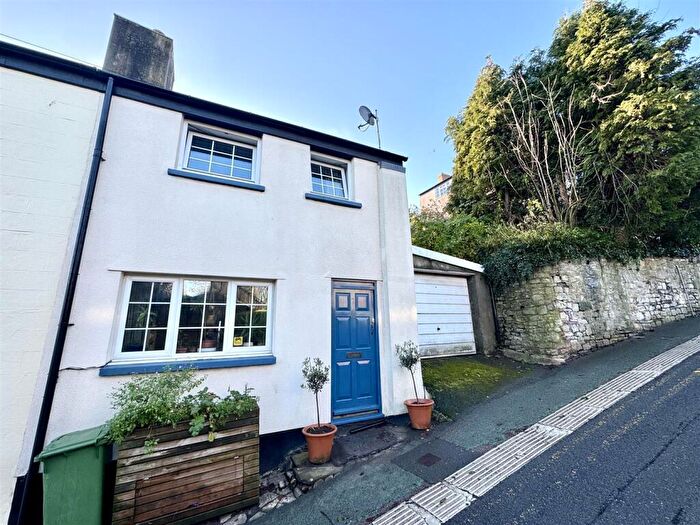
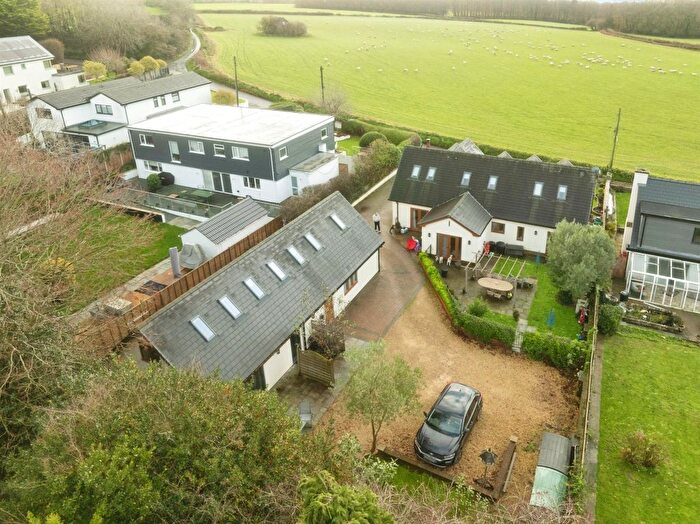
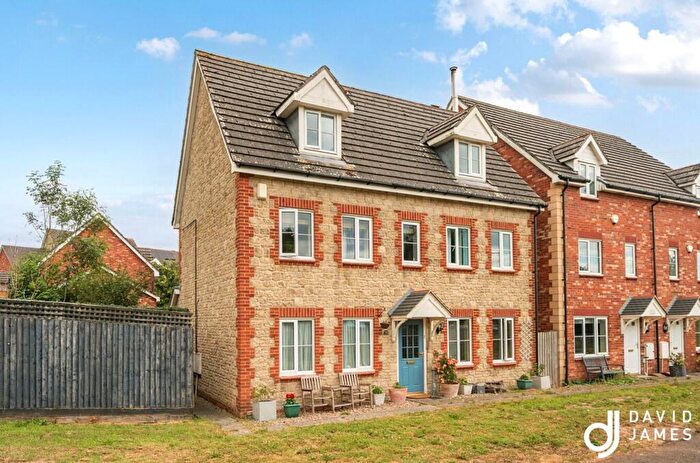
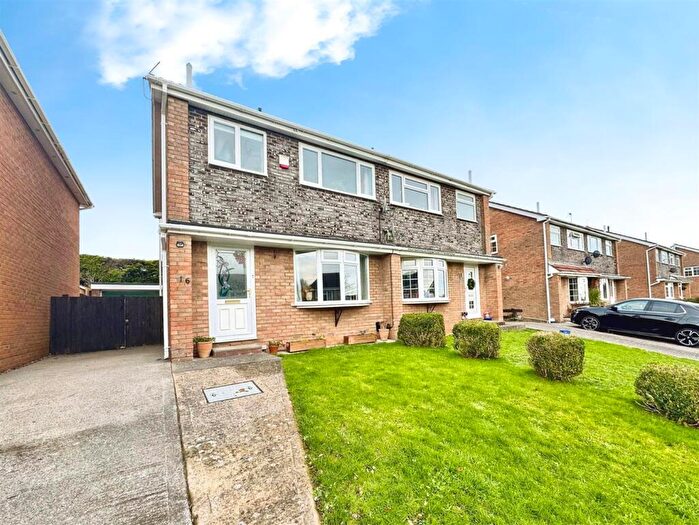
Properties for sale in St. Kingsmark
Roads and Postcodes in St. Kingsmark
Navigate through our locations to find the location of your next house in St. Kingsmark, Chepstow for sale or to rent.
| Streets | Postcodes |
|---|---|
| Alcove Wood | NP16 6DT |
| Barnets Wood | NP16 5TN |
| Bayfield Wood Close | NP16 6FB |
| Buckle Wood | NP16 6DX |
| Castle Gardens | NP16 5LF |
| Castle Wood | NP16 5TZ |
| Danes Close | NP16 5SL |
| Deans Gardens | NP16 5SG |
| Deans Hill | NP16 5AT |
| Edmond Locard Court | NP16 6FA |
| Fedw Wood | NP16 5TW |
| Fryth Wood | NP16 6DU |
| Hanover Close | NP16 5QA |
| Hazelton Villas | NP16 6AE |
| Huntfield Road | NP16 5SA NP16 5SB |
| Kingsmark Lane | NP16 5LZ |
| Lancaster Way | NP16 5SJ |
| Manor Wood | NP16 6DS |
| Meadow Lane | NP16 5AW |
| Meadow Walk | NP16 5AU |
| Mounton Road | NP16 6AA NP16 6AB NP16 5BR |
| Newport Road | NP16 5BB |
| Normandy Way | NP16 5NB |
| Oakfield Avenue | NP16 5NE |
| Park View | NP16 5NA |
| Penterry Park | NP16 5AZ |
| Piercefield Avenue | NP16 5JB |
| Priory Close | NP16 5ND |
| Regent Way | NP16 5BY |
| Ruffetts Close | NP16 5BP |
| St Johns Gardens | NP16 5SE |
| St Kingsmark Avenue | NP16 5LY NP16 5SN |
| St Lawrence Park | NP16 6DP NP16 6DQ |
| St Lawrence Road | NP16 6BE |
| St Maur Gardens | NP16 5LT NP16 5NZ |
| Stuart Avenue | NP16 5NU |
| Tempest Drive | NP16 5AY |
| Tempest Way | NP16 5XP NP16 5XR NP16 5YX |
| The Cloisters | NP16 5UA |
| The Rosary | NP16 5UE |
| Tudor Drive | NP16 5SF |
| Turnpike Close | NP16 5SD |
| Wallwern Wood | NP16 5TX |
| Welsh Street | NP16 5LU NP16 5LX NP16 5LS |
| Wintour Close | NP16 5LE |
| Woolpitch Wood | NP16 6DR NP16 6DW |
| Yew Tree Wood | NP16 6AZ |
| NP16 6AD NP16 5UG NP16 6BB |
Transport near St. Kingsmark
-
Chepstow Station
-
Caldicot Station
-
Severn Tunnel Junction Station
-
Severn Beach Station
-
Pilning Station
-
Lydney Station
-
St.Andrew's Road Station
-
Patchway Station
-
Avonmouth Station
- FAQ
- Price Paid By Year
- Property Type Price
Frequently asked questions about St. Kingsmark
What is the average price for a property for sale in St. Kingsmark?
The average price for a property for sale in St. Kingsmark is £402,999. This amount is 8% higher than the average price in Chepstow. There are 804 property listings for sale in St. Kingsmark.
What streets have the most expensive properties for sale in St. Kingsmark?
The streets with the most expensive properties for sale in St. Kingsmark are Alcove Wood at an average of £705,000, Welsh Street at an average of £704,166 and The Cloisters at an average of £685,000.
What streets have the most affordable properties for sale in St. Kingsmark?
The streets with the most affordable properties for sale in St. Kingsmark are St Maur Gardens at an average of £210,071, Normandy Way at an average of £294,875 and Castle Gardens at an average of £297,500.
Which train stations are available in or near St. Kingsmark?
Some of the train stations available in or near St. Kingsmark are Chepstow, Caldicot and Severn Tunnel Junction.
Property Price Paid in St. Kingsmark by Year
The average sold property price by year was:
| Year | Average Sold Price | Price Change |
Sold Properties
|
|---|---|---|---|
| 2025 | £408,981 | 0,2% |
29 Properties |
| 2024 | £408,140 | -0,5% |
51 Properties |
| 2023 | £410,008 | 6% |
49 Properties |
| 2022 | £386,769 | 8% |
48 Properties |
| 2021 | £356,951 | -2% |
78 Properties |
| 2020 | £363,272 | 12% |
32 Properties |
| 2019 | £318,463 | 3% |
39 Properties |
| 2018 | £310,482 | -3% |
43 Properties |
| 2017 | £319,470 | 6% |
60 Properties |
| 2016 | £300,435 | 6% |
75 Properties |
| 2015 | £283,071 | 8% |
83 Properties |
| 2014 | £259,328 | -3% |
66 Properties |
| 2013 | £265,898 | 7% |
50 Properties |
| 2012 | £247,648 | -7% |
43 Properties |
| 2011 | £264,676 | -3% |
51 Properties |
| 2010 | £273,686 | 15% |
48 Properties |
| 2009 | £231,696 | -10% |
54 Properties |
| 2008 | £255,331 | -6% |
39 Properties |
| 2007 | £270,567 | 10% |
89 Properties |
| 2006 | £243,253 | 4% |
77 Properties |
| 2005 | £232,411 | -0,3% |
70 Properties |
| 2004 | £233,216 | 14% |
125 Properties |
| 2003 | £200,598 | 3% |
153 Properties |
| 2002 | £195,131 | 23% |
198 Properties |
| 2001 | £150,371 | 21% |
99 Properties |
| 2000 | £119,036 | -4% |
64 Properties |
| 1999 | £123,837 | 30% |
95 Properties |
| 1998 | £86,265 | 10% |
23 Properties |
| 1997 | £77,563 | 7% |
43 Properties |
| 1996 | £71,839 | 7% |
38 Properties |
| 1995 | £66,678 | - |
25 Properties |
Property Price per Property Type in St. Kingsmark
Here you can find historic sold price data in order to help with your property search.
The average Property Paid Price for specific property types in the last three years are:
| Property Type | Average Sold Price | Sold Properties |
|---|---|---|
| Semi Detached House | £318,455.00 | 35 Semi Detached Houses |
| Detached House | £448,270.00 | 122 Detached Houses |
| Terraced House | £318,964.00 | 14 Terraced Houses |
| Flat | £171,750.00 | 6 Flats |

