
Houses for sale & to rent in NP16 5HD, The Gables, St. Marys, Chepstow
House Prices in NP16 5HD, The Gables, St. Marys
Properties in NP16 5HD have no sales history available within the last 3 years. NP16 5HD is a postcode in The Gables located in St. Marys, an area in Chepstow, Sir Fynwy - Monmouthshire, with 3 households².
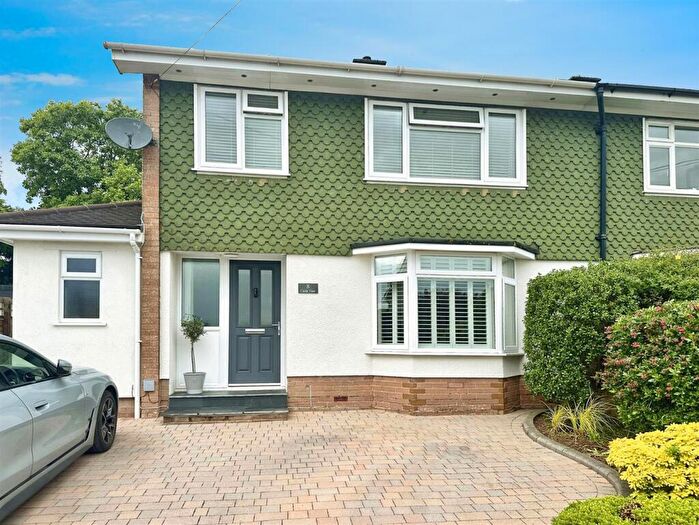
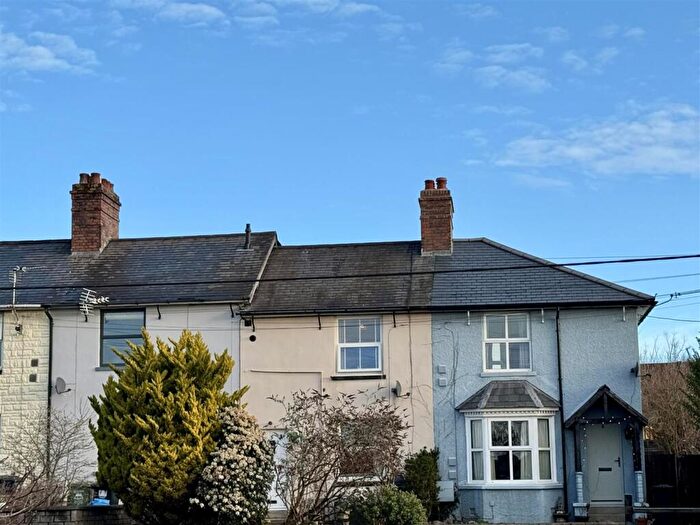
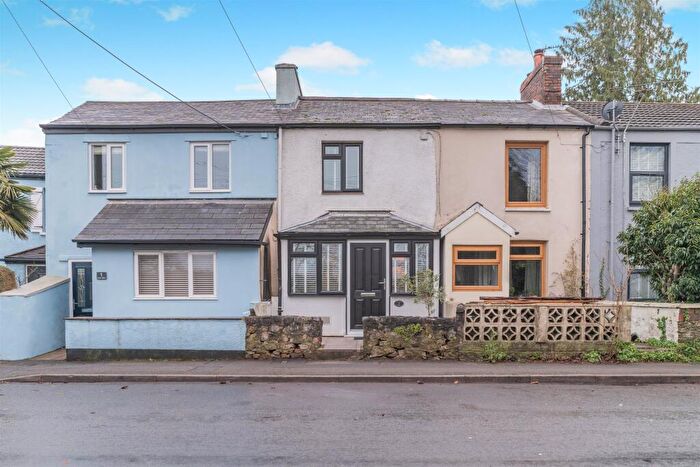
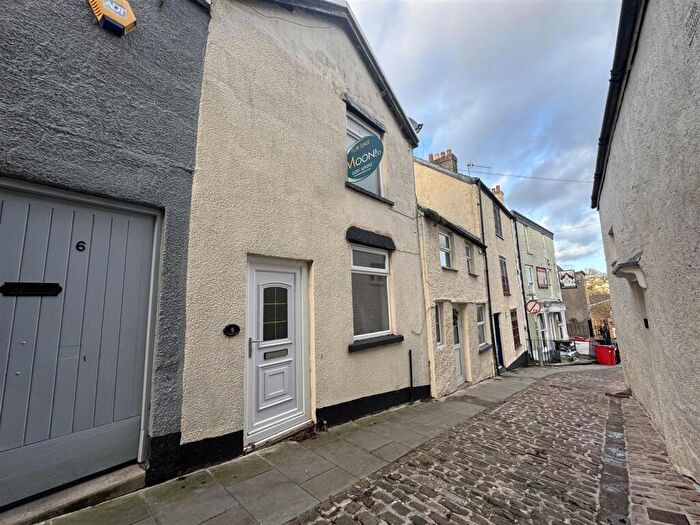
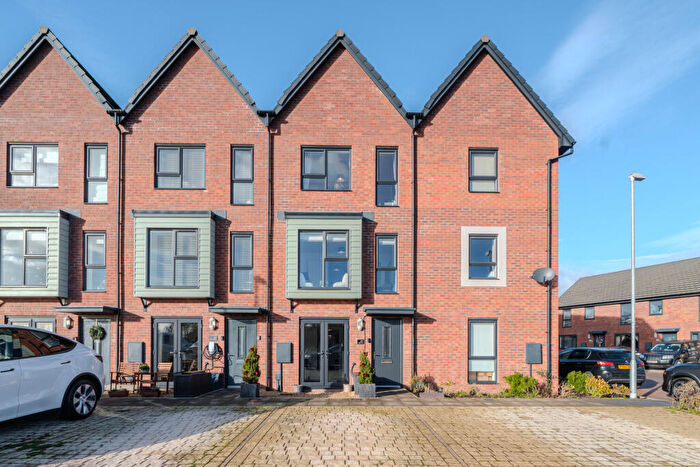
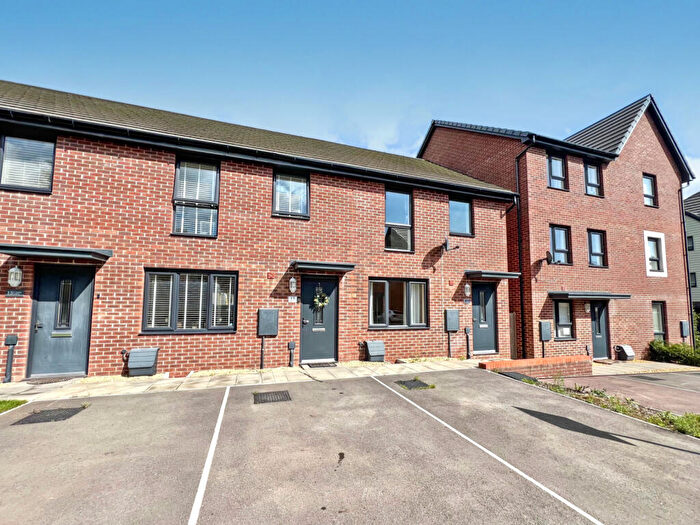
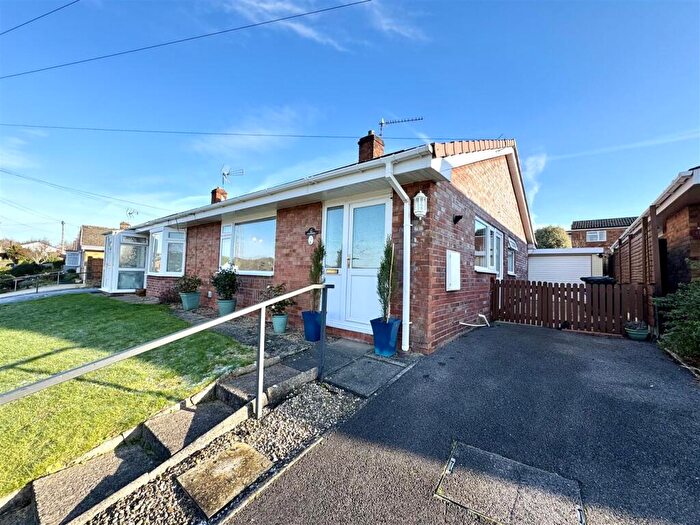
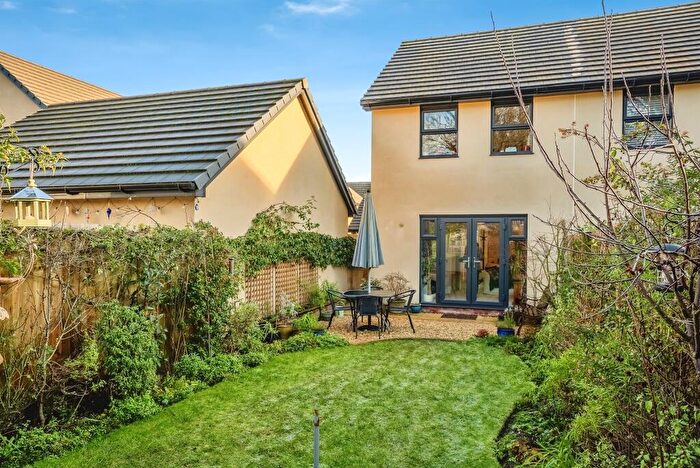
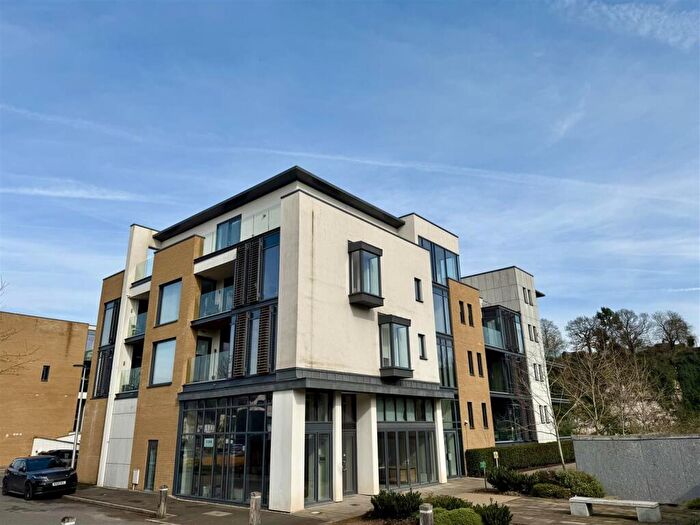
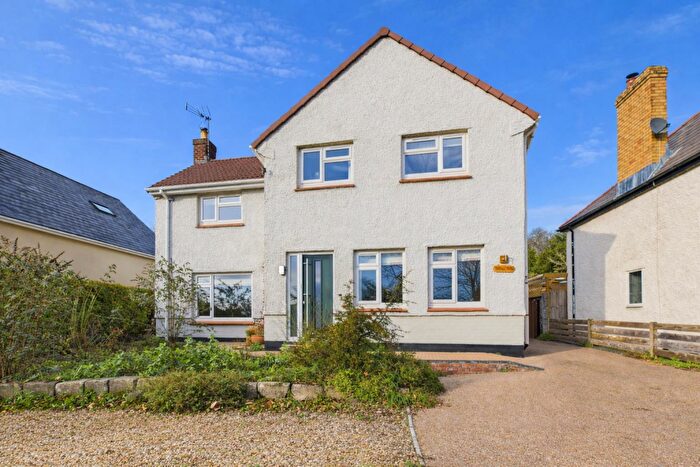
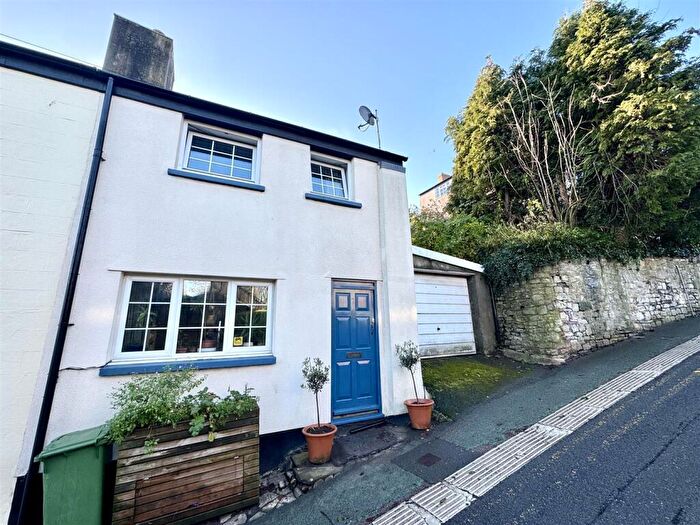
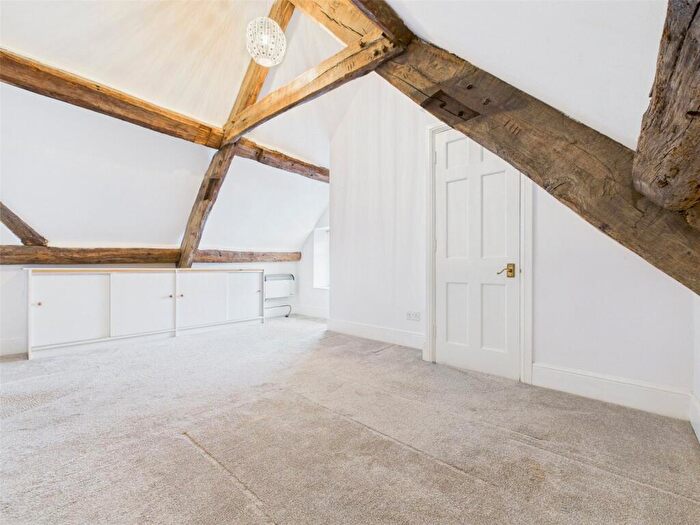
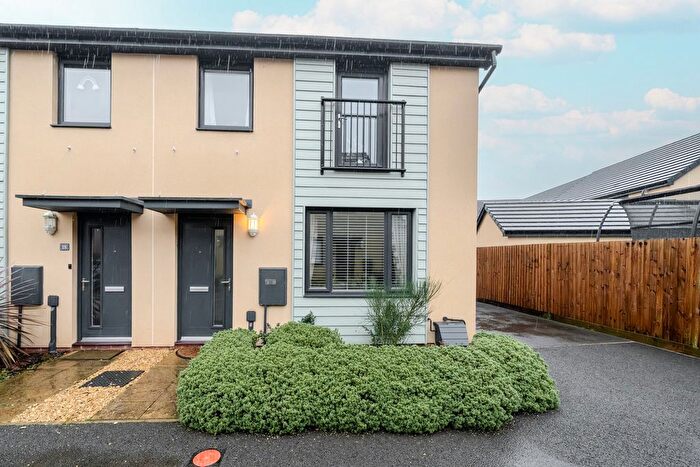
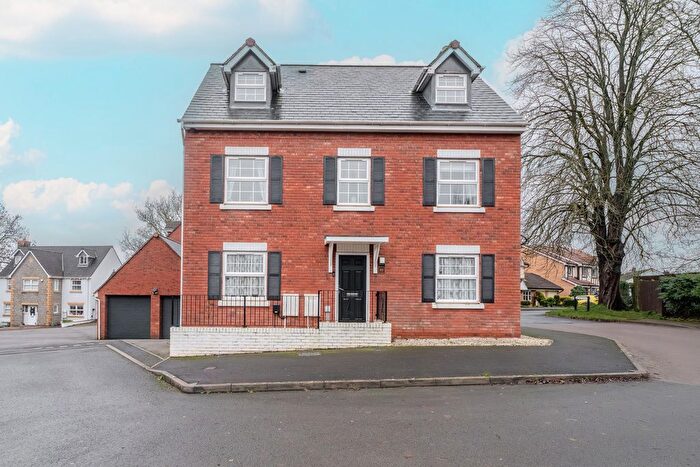
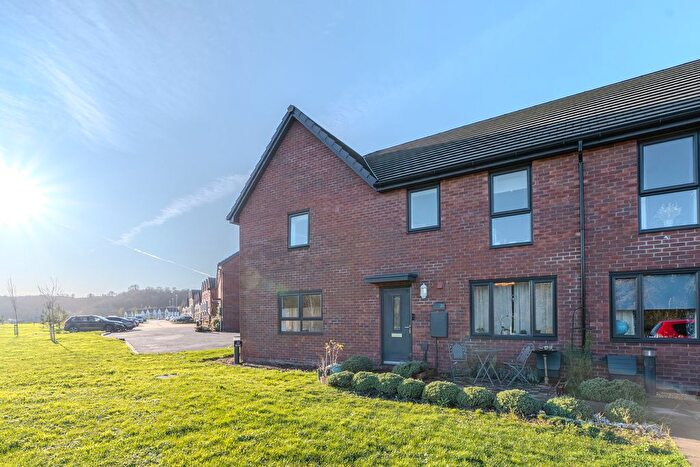
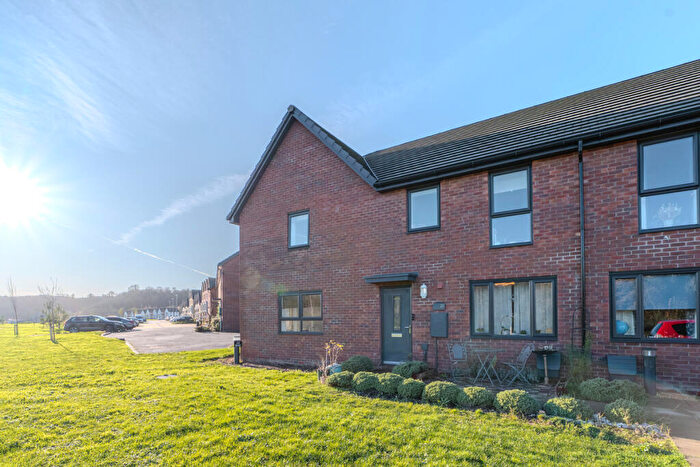
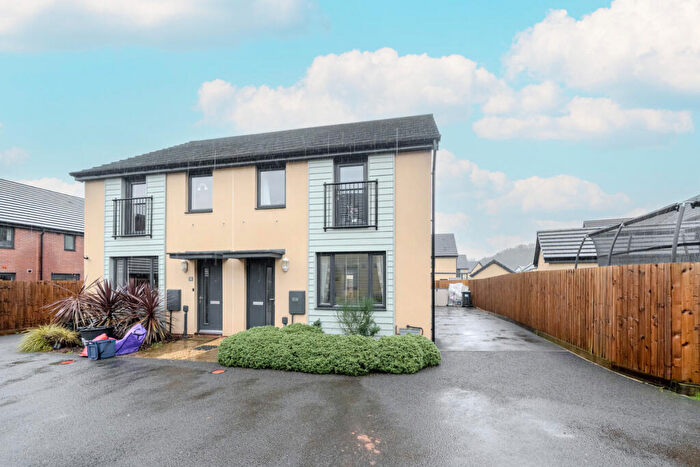
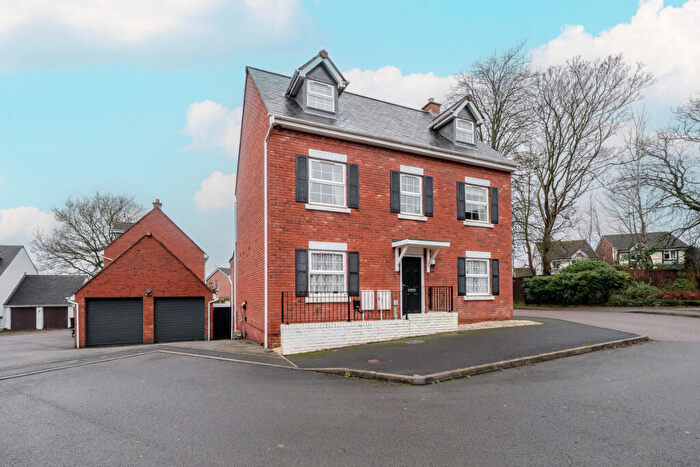
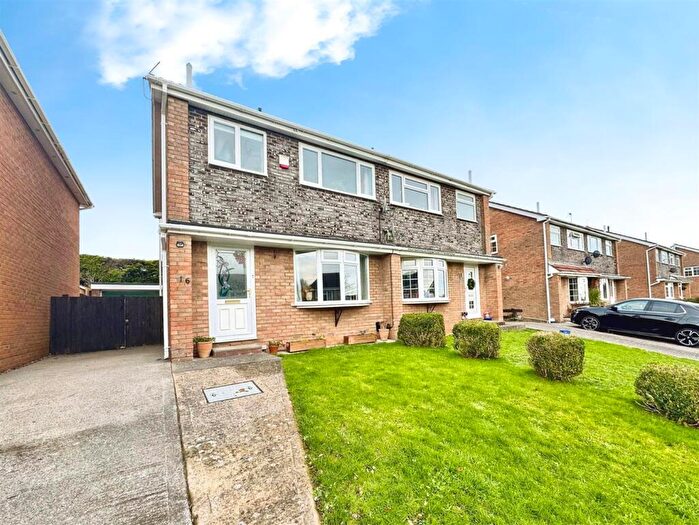
Properties for sale near NP16 5HD, The Gables
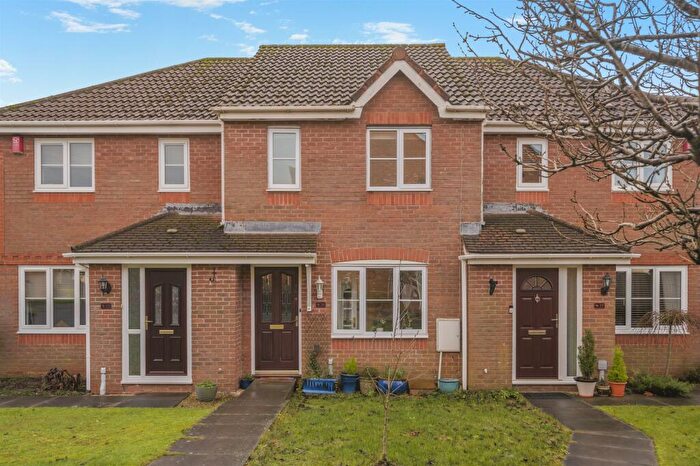
![]()
If you are looking to sell your house, let it out, or receive a property valuation, an expert can help you.
Click the button below to get started.


Price Paid in The Gables, NP16 5HD, St. Marys
1 The Gables, NP16 5HD, St. Marys Chepstow
Property 1 has been sold 3 times. The last time it was sold was in 29/09/2016 and the sold price was £292,500.00.
This other property, sold as a freehold on 29/09/2016, is a 110 sqm end-terrace house with an EPC rating of D.
| Date | Price | Property Type | Tenure | Classification |
|---|---|---|---|---|
| 29/09/2016 | £292,500.00 | Other Property | freehold | Established Building |
| 30/11/2012 | £270,000.00 | Terraced House | freehold | Established Building |
| 09/07/2010 | £150,000.00 | Semi Detached House | freehold | Established Building |
3 The Gables, NP16 5HD, St. Marys Chepstow
Property 3 has been sold 3 times. The last time it was sold was in 30/04/2010 and the sold price was £189,000.00.
This terraced house, sold as a freehold on 30/04/2010, is a 113 sqm end-terrace house with an EPC rating of F.
| Date | Price | Property Type | Tenure | Classification |
|---|---|---|---|---|
| 30/04/2010 | £189,000.00 | Terraced House | freehold | Established Building |
| 28/09/2001 | £117,500.00 | Terraced House | freehold | Established Building |
| 26/06/1996 | £70,000.00 | Terraced House | freehold | Established Building |
Transport near NP16 5HD, The Gables
-
 Chepstow Station
 -
Caldicot Station
-
Severn Beach Station
-
Severn Tunnel Junction Station
-
Pilning Station
-
Lydney Station
-
St.Andrew's Road Station
-
Patchway Station
House price paid reports for NP16 5HD, The Gables
Click on the buttons below to see price paid reports by year or property price:
- Price Paid By Year
Property Price Paid in NP16 5HD, The Gables by Year
The average sold property price by year was:
| Year | Average Sold Price | Price Change |
Sold Properties
|
|---|---|---|---|
| 2012 | £270,000 | 37% |
1 Property |
| 2010 | £169,500 | 31% |
2 Properties |
| 2001 | £117,500 | 40% |
1 Property |
| 1996 | £70,000 | - |
1 Property |