Houses for sale & to rent in Dixton With Osbaston, Monmouth
House Prices in Dixton With Osbaston
Properties in Dixton With Osbaston have an average house price of £454,426.00 and had 157 Property Transactions within the last 3 years¹.
Dixton With Osbaston is an area in Monmouth, Sir Fynwy - Monmouthshire with 975 households², where the most expensive property was sold for £1,100,000.00.
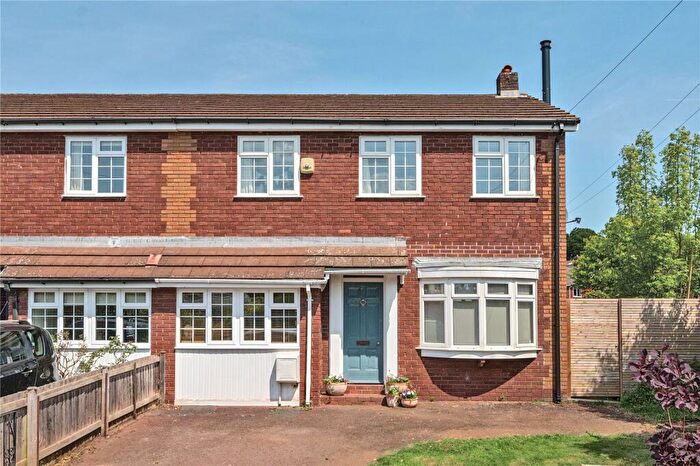
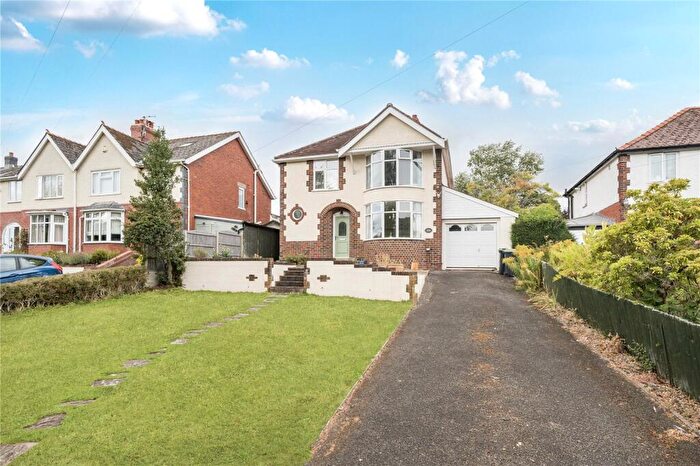
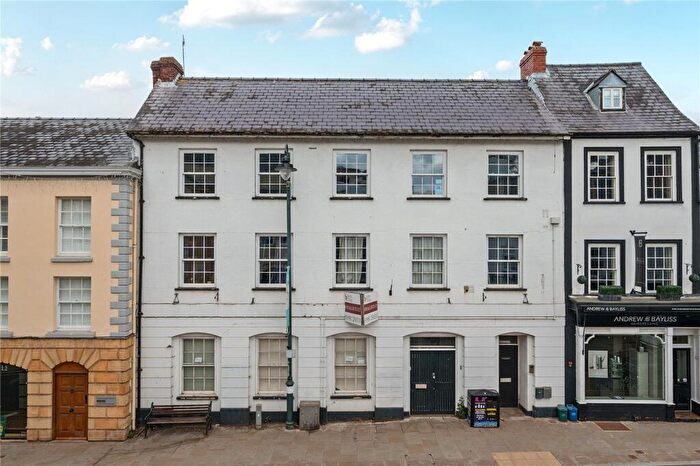
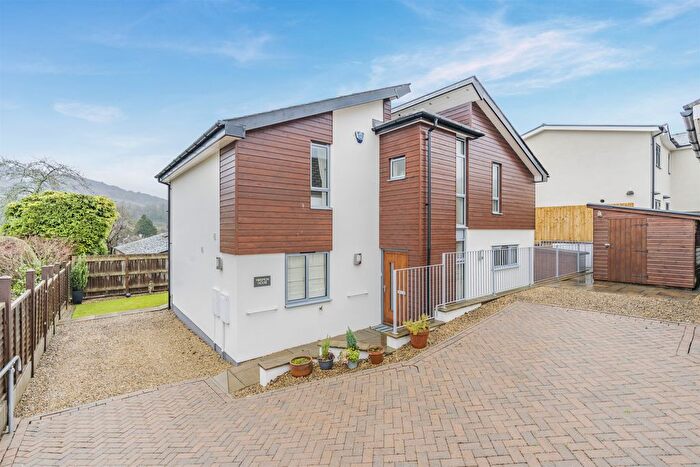
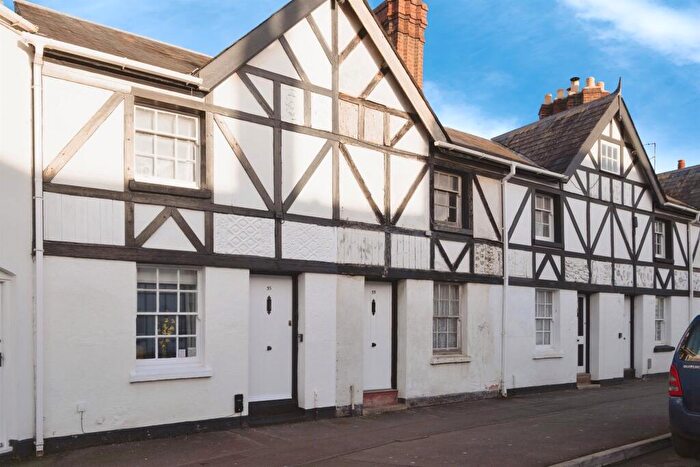
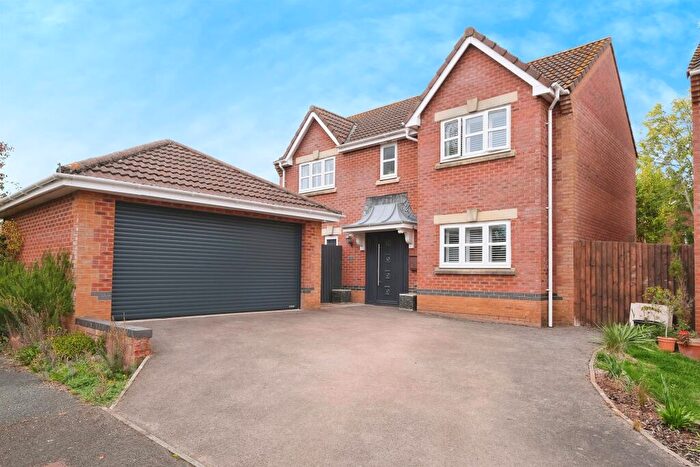
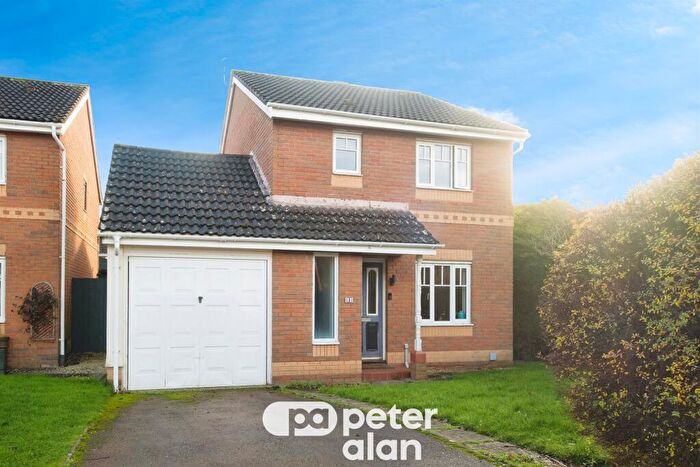
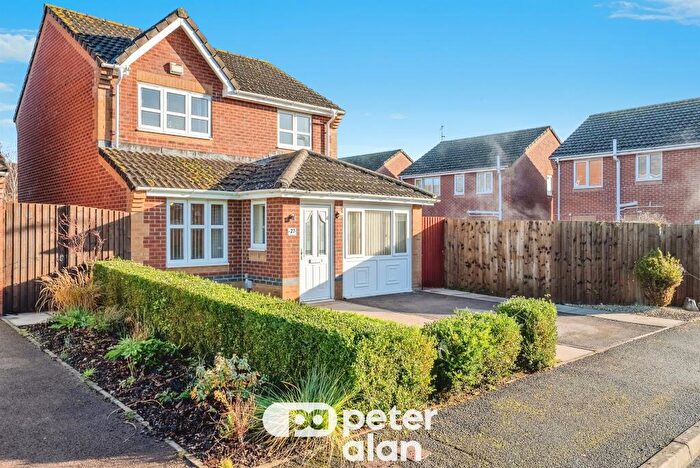
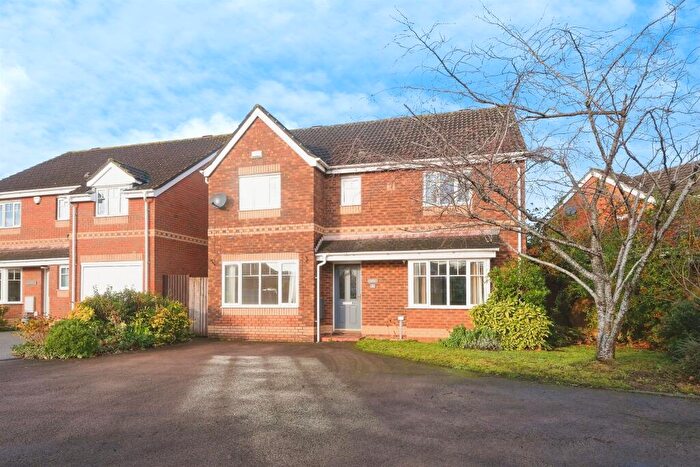
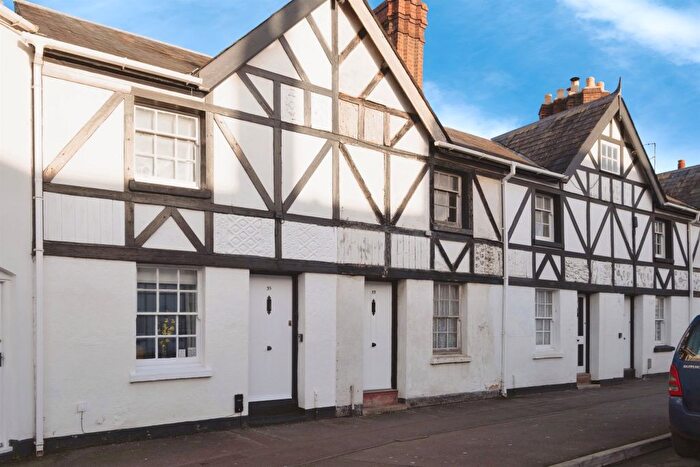
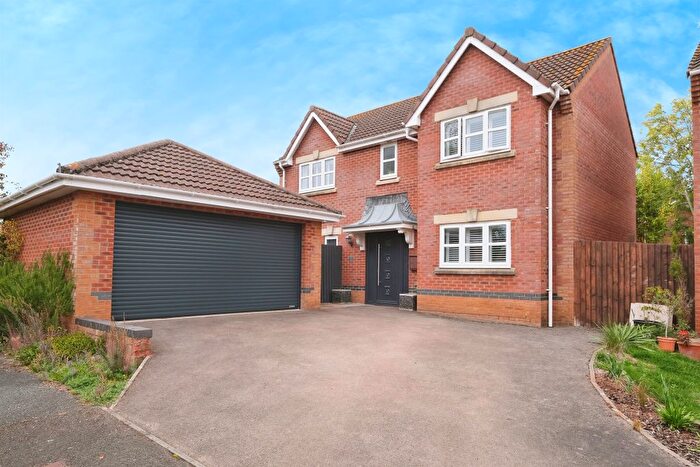
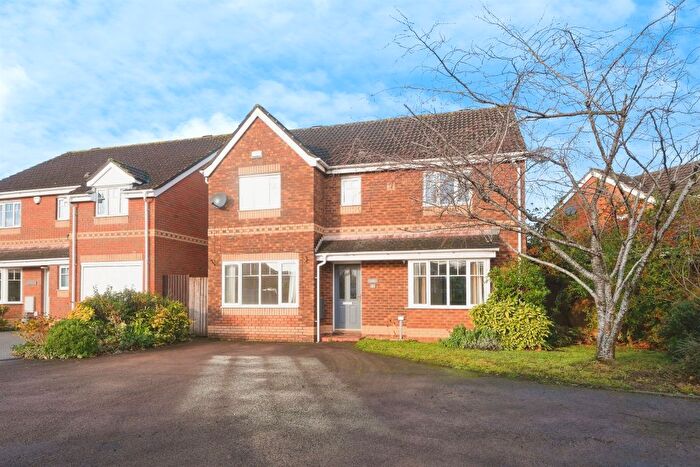
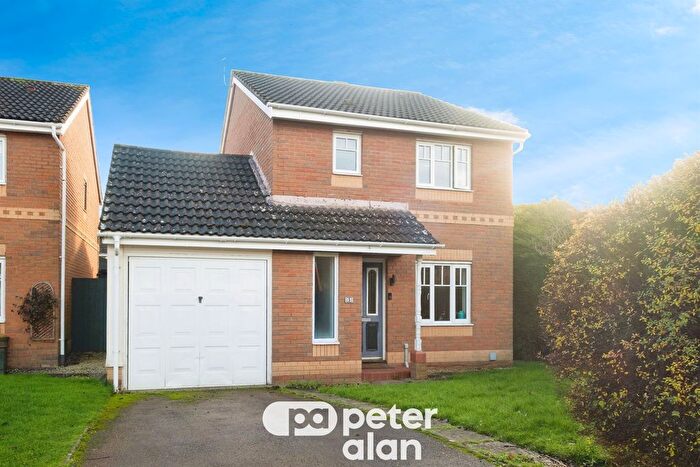
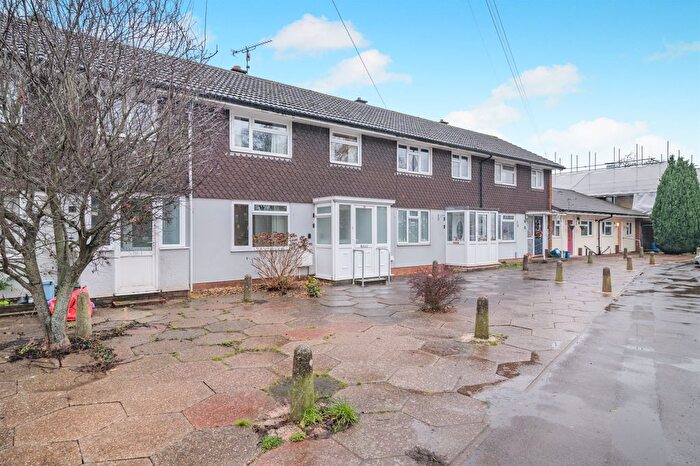
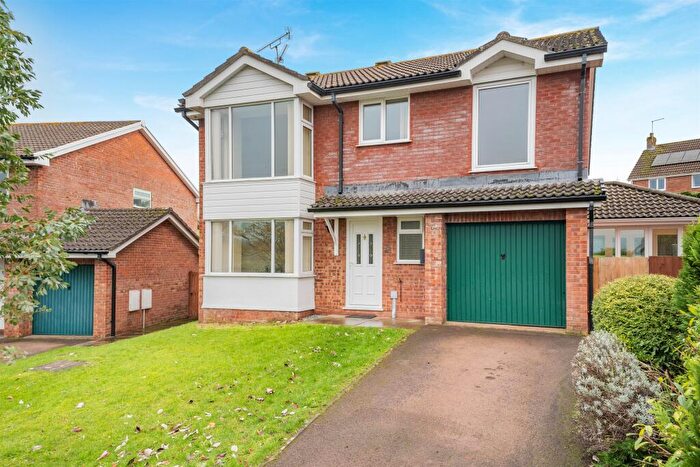
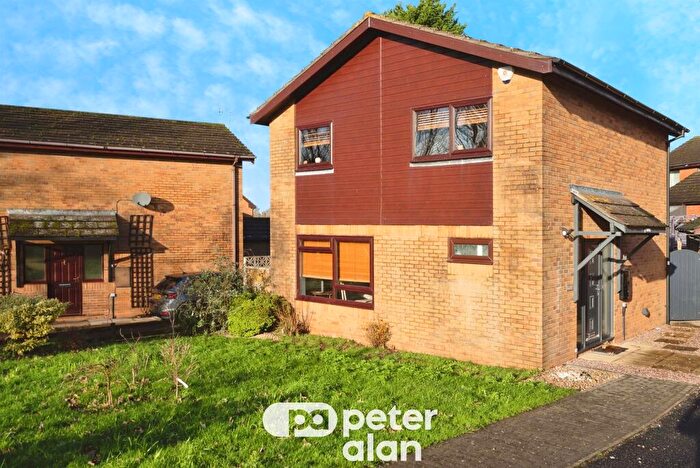
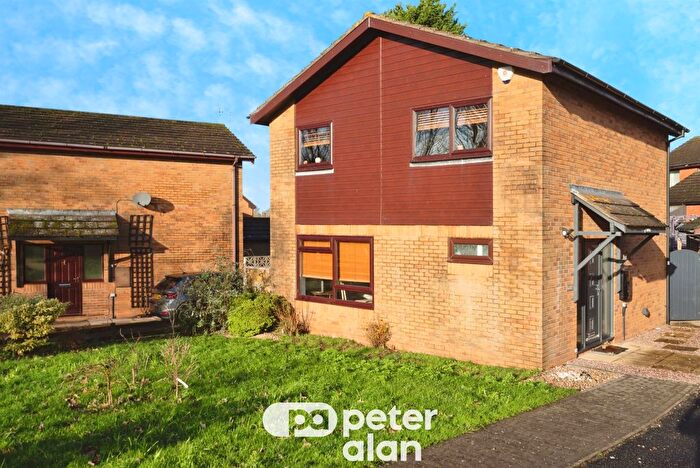
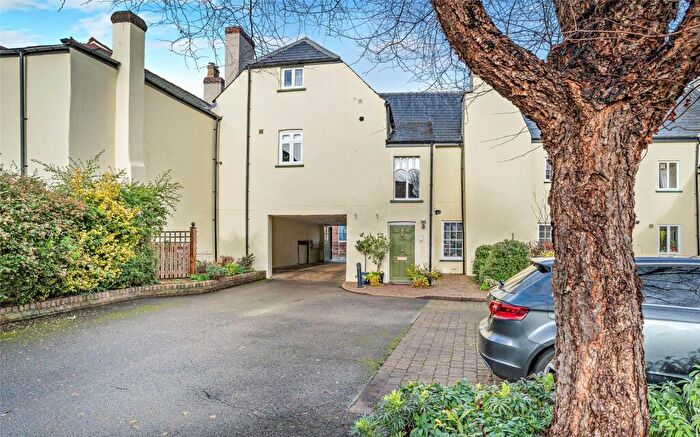
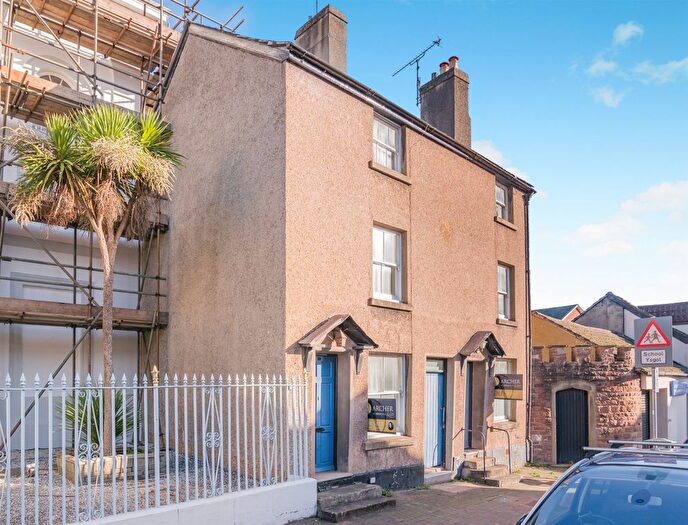
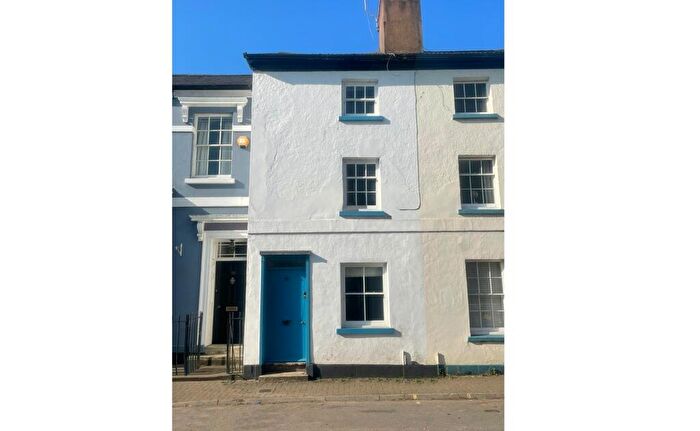
Properties for sale in Dixton With Osbaston
Roads and Postcodes in Dixton With Osbaston
Navigate through our locations to find the location of your next house in Dixton With Osbaston, Monmouth for sale or to rent.
| Streets | Postcodes |
|---|---|
| Agincourt Road | NP25 3HD |
| Auden Close | NP25 3NW |
| Beaufort Road | NP25 3HU |
| Berryfield Close | NP25 3JG |
| Berryfield Park | NP25 3DQ |
| Berryfield Rise | NP25 3DU |
| Buckholt View | NP25 3AS |
| Charles Close | NP25 3JD |
| Chaucer Way | NP25 3NR |
| Cornford Close | NP25 3NT |
| Cwrt William Jones | NP25 3AE |
| Dixton Close | NP25 3HE NP25 3PG NP25 3PJ NP25 3PQ |
| Dixton Lane | NP25 3SY |
| Dixton Road | NP25 3PX |
| Duchess Close | NP25 3JL |
| Duchess Road | NP25 3HT |
| Granville Street | NP25 3DR NP25 3DS |
| Hereford Road | NP25 3GA NP25 3GB NP25 3GD NP25 3GE NP25 3HB NP25 3HH NP25 3HJ NP25 3HQ NP25 3PB NP25 3PD NP25 3PE NP25 3HG NP25 3PY NP25 5XT |
| Highfield Close | NP25 3HP |
| Highfield Road | NP25 3HR |
| Hook Close | NP25 3BD |
| Howard Bowen Close | NP25 3AU |
| Lancaster Way | NP25 3BE |
| Leasbrook Lane | NP25 3SN |
| Lower Prospect Road | NP25 3HS |
| Maddox Close | NP25 3BG |
| Manson Heights | NP25 5QX |
| Mansons Cross | NP25 5LE NP25 5LD |
| Mansons Villas | NP25 5LB |
| Monk Street | NP25 3LR NP25 3LW |
| Monkswell Close | NP25 3PH |
| Monkswell Road | NP25 3PF |
| Monnow View | NP25 4BA |
| New Dixton Road | NP25 3PL NP25 3PP NP25 3PR NP25 3SJ |
| Oakfield Road | NP25 3JJ |
| Old Dixton Road | NP25 3DJ NP25 3DP NP25 3SG NP25 3SH NP25 3SQ NP25 3YT |
| Palmyra Villas | NP25 3HY |
| Priory Lane | NP25 3HN |
| Prospect Road | NP25 3SZ |
| St James Square | NP25 3DN |
| St James Street | NP25 3DL |
| St Marys Road | NP25 3HZ NP25 3JE |
| The Gardens | NP25 3HF |
| The Mount | NP25 3AB |
| The Parade | NP25 3PA |
| The Rickfield | NP25 3HL |
| The Vineyard | NP25 3PU |
| Toynbee Close | NP25 3NU |
| Tregate Close | NP25 3AT |
| Vauxhall Way | NP25 3AR |
| Vine Acre | NP25 3HW |
| Wallis Close | NP25 3NS |
| Westfield Road | NP25 3HX |
| Whitecross Street | NP25 3DT |
| Withy Lane | NP25 5LF |
| NP25 3SP NP25 3SW NP25 5DL NP25 5QZ NP25 5RB NP25 5RE NP25 5RZ NP25 5QY NP25 5RA NP25 5RF |
Transport near Dixton With Osbaston
- FAQ
- Price Paid By Year
- Property Type Price
Frequently asked questions about Dixton With Osbaston
What is the average price for a property for sale in Dixton With Osbaston?
The average price for a property for sale in Dixton With Osbaston is £454,426. This amount is 22% higher than the average price in Monmouth. There are 734 property listings for sale in Dixton With Osbaston.
What streets have the most expensive properties for sale in Dixton With Osbaston?
The streets with the most expensive properties for sale in Dixton With Osbaston are The Vineyard at an average of £790,000, The Rickfield at an average of £600,000 and Cornford Close at an average of £591,300.
What streets have the most affordable properties for sale in Dixton With Osbaston?
The streets with the most affordable properties for sale in Dixton With Osbaston are Monk Street at an average of £155,666, Dixton Road at an average of £230,625 and Old Dixton Road at an average of £298,000.
Which train stations are available in or near Dixton With Osbaston?
Some of the train stations available in or near Dixton With Osbaston are Lydney, Abergavenny and Chepstow.
Property Price Paid in Dixton With Osbaston by Year
The average sold property price by year was:
| Year | Average Sold Price | Price Change |
Sold Properties
|
|---|---|---|---|
| 2025 | £471,500 | 5% |
26 Properties |
| 2024 | £445,641 | 5% |
39 Properties |
| 2023 | £421,187 | -15% |
45 Properties |
| 2022 | £484,094 | 14% |
47 Properties |
| 2021 | £415,074 | 1% |
60 Properties |
| 2020 | £411,654 | 17% |
42 Properties |
| 2019 | £342,210 | 1% |
35 Properties |
| 2018 | £339,580 | 1% |
56 Properties |
| 2017 | £335,017 | 8% |
66 Properties |
| 2016 | £309,644 | 0,2% |
55 Properties |
| 2015 | £308,956 | -10% |
44 Properties |
| 2014 | £338,610 | 13% |
43 Properties |
| 2013 | £294,894 | 3% |
38 Properties |
| 2012 | £284,828 | -10% |
35 Properties |
| 2011 | £312,717 | 8% |
42 Properties |
| 2010 | £286,529 | 5% |
30 Properties |
| 2009 | £273,463 | -36% |
28 Properties |
| 2008 | £372,685 | 12% |
32 Properties |
| 2007 | £329,309 | 20% |
32 Properties |
| 2006 | £263,911 | -14% |
42 Properties |
| 2005 | £300,026 | 21% |
38 Properties |
| 2004 | £237,400 | -1% |
48 Properties |
| 2003 | £240,211 | 27% |
36 Properties |
| 2002 | £174,726 | 13% |
43 Properties |
| 2001 | £152,741 | 14% |
51 Properties |
| 2000 | £131,516 | 9% |
37 Properties |
| 1999 | £120,322 | 6% |
54 Properties |
| 1998 | £113,351 | 2% |
43 Properties |
| 1997 | £110,641 | 8% |
47 Properties |
| 1996 | £102,049 | 14% |
53 Properties |
| 1995 | £87,343 | - |
33 Properties |
Property Price per Property Type in Dixton With Osbaston
Here you can find historic sold price data in order to help with your property search.
The average Property Paid Price for specific property types in the last three years are:
| Property Type | Average Sold Price | Sold Properties |
|---|---|---|
| Semi Detached House | £372,170.00 | 29 Semi Detached Houses |
| Detached House | £509,934.00 | 107 Detached Houses |
| Terraced House | £419,285.00 | 7 Terraced Houses |
| Flat | £218,142.00 | 14 Flats |

