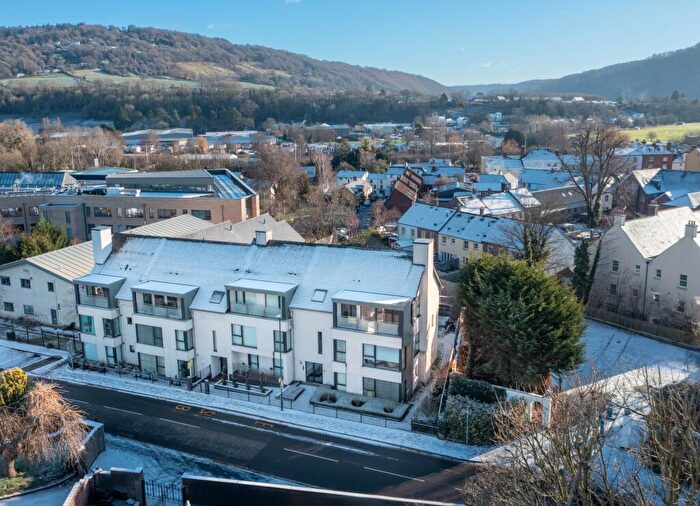
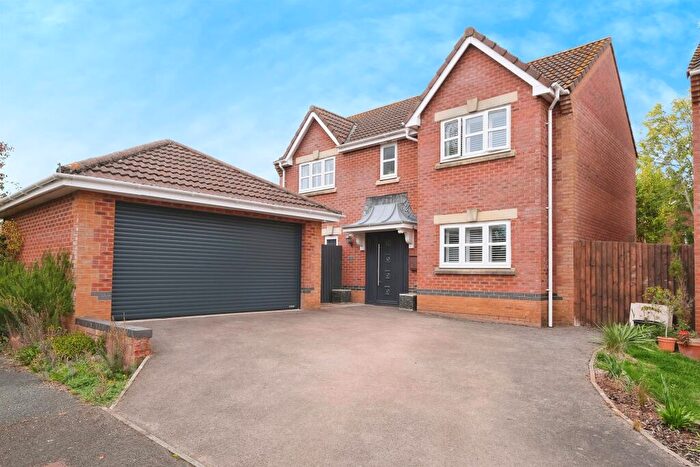
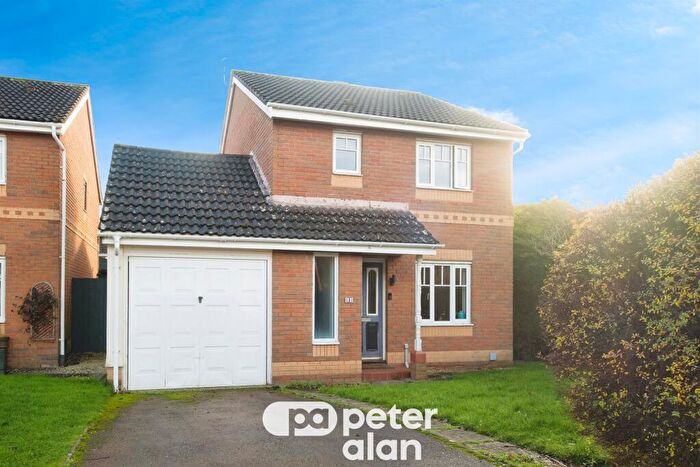
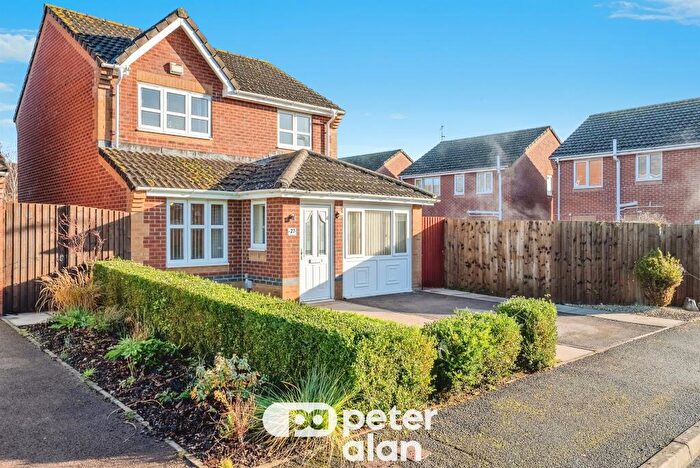
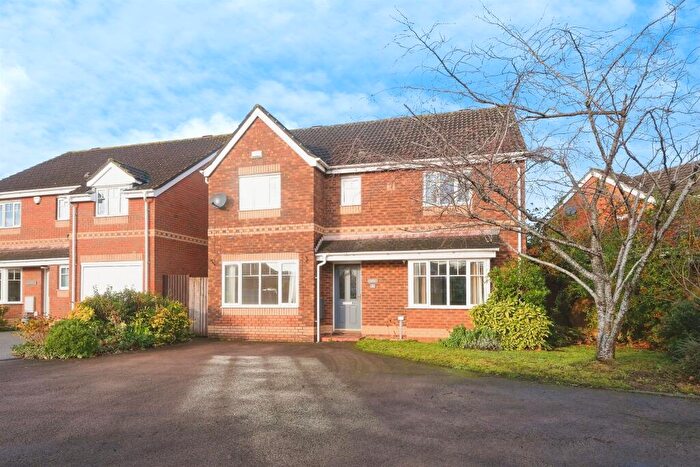
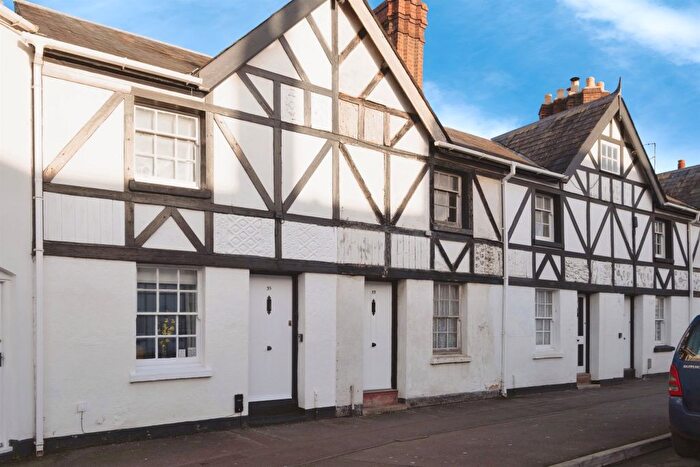
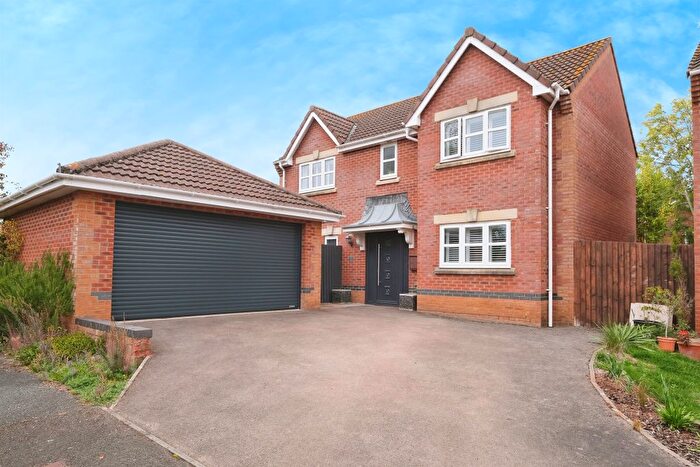
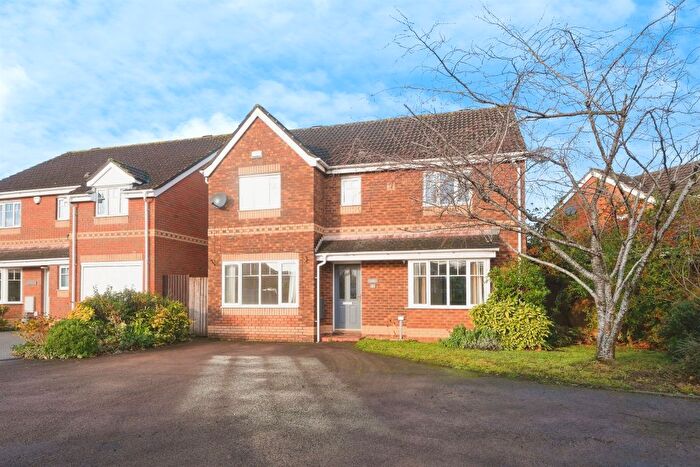
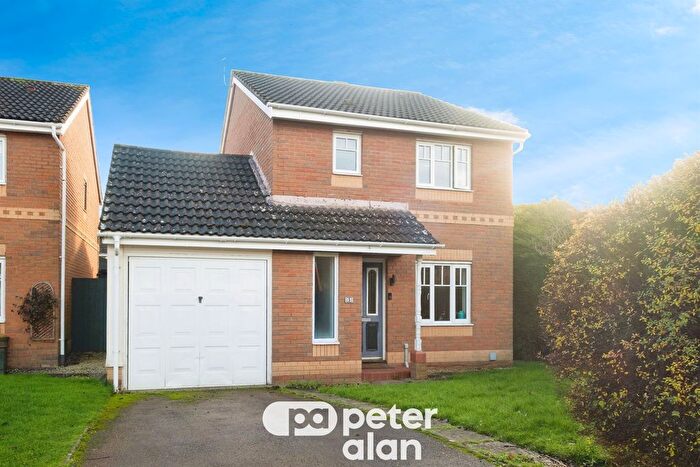
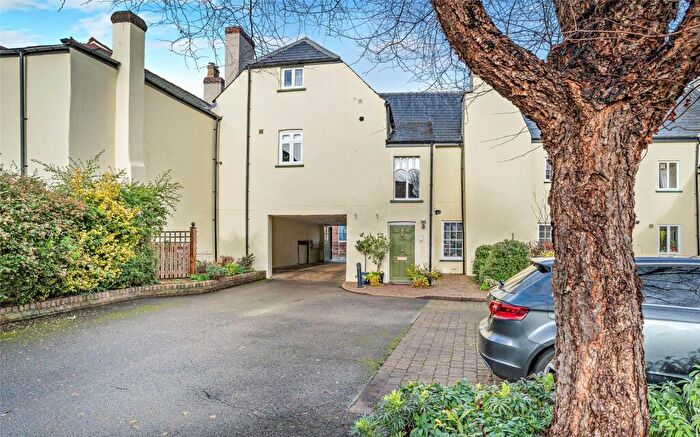
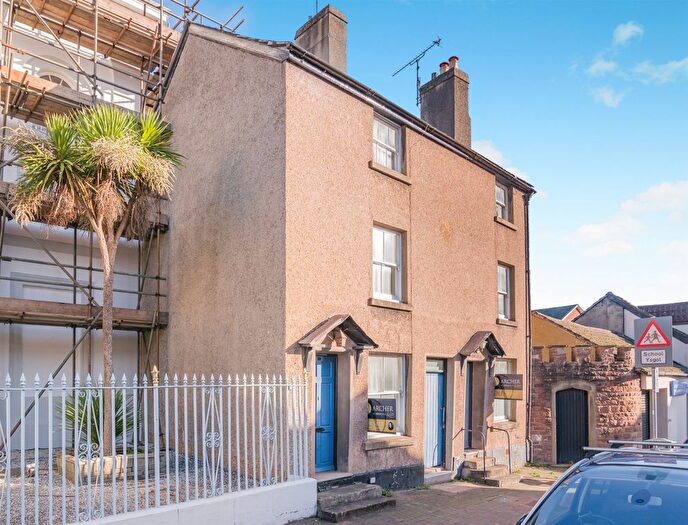
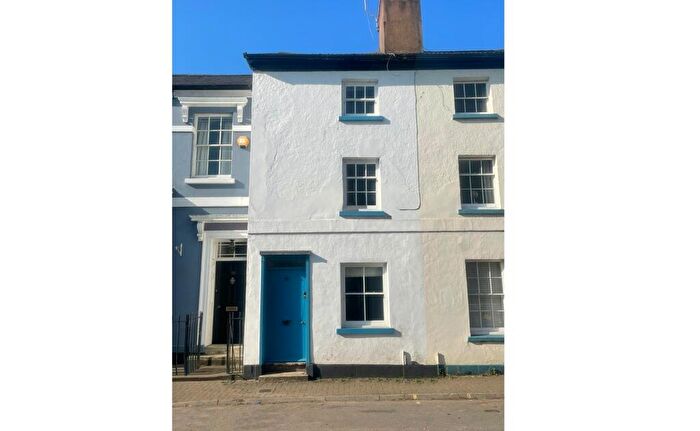
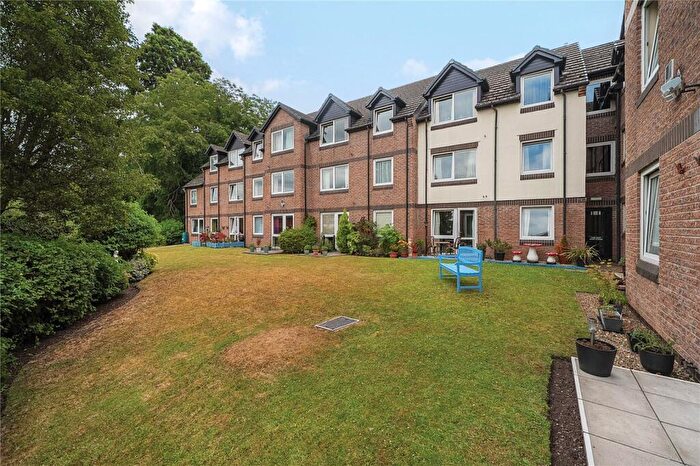
Houses for sale & to rent in Drybridge, Monmouth
House Prices in Drybridge
Properties in Drybridge have an average house price of £324,114.00 and had 256 Property Transactions within the last 3 years¹.
Drybridge is an area in Monmouth, Sir Fynwy - Monmouthshire with 1,461 households², where the most expensive property was sold for £960,000.00.
Properties for sale in Drybridge
Roads and Postcodes in Drybridge
Navigate through our locations to find the location of your next house in Drybridge, Monmouth for sale or to rent.
| Streets | Postcodes |
|---|---|
| Acer Way | NP25 5UP NP25 5UQ |
| Agincourt Square | NP25 3BQ NP25 3UA NP25 3BT NP25 3DY |
| Agincourt Street | NP25 3DZ |
| Almshouse Street | NP25 3DE NP25 3XP |
| Ancre Hill Lane | NP25 5HS NP25 5SS |
| Ash Lane | NP25 5FJ |
| Belle Etoile Drive | NP25 5UR |
| Bigham Close | NP25 5DP |
| Blestium Street | NP25 3ER |
| Brook Crescent | NP25 5AX |
| Brook Estate | NP25 5AN NP25 5AW |
| Castle Hill | NP25 3DX |
| Catherine Close | NP25 5GD |
| Caxton View | NP25 5DJ |
| Chartist Rise | NP25 5GA |
| Cherry Walk | NP25 5DE |
| Chippenham Court | NP25 3UZ |
| Chippenhamgate Street | NP25 3DH |
| Church Street | NP25 3BX NP25 3BU NP25 3XE |
| Cliffords Court | NP25 3EL |
| Cornpoppy Avenue | NP25 5SD |
| Cornwallis Way | NP25 5DN |
| Craig Y Dorth View | NP25 5FH |
| Drybridge Gardens | NP25 5BR |
| Drybridge Park | NP25 5AS NP25 5BL |
| Elm Drive | NP25 5FF |
| Forge Cottages | NP25 3AY |
| Forge Road | NP25 3AZ |
| Gibraltar Drive | NP25 5FE |
| Glendower Street | NP25 3DG NP25 3UY |
| Hamilton Way | NP25 5BY |
| Harfleur Court | NP25 5GF |
| Hendre Close | NP25 5BE |
| Holly Row | NP25 5EQ |
| Howells Place | NP25 3ED |
| Jordan Close | NP25 5EB |
| Jordan Gardens | NP25 5ED |
| Jordan Way | NP25 5EA |
| Kemble Road | NP25 5GB |
| Kingfisher Way | NP25 5US |
| Kingswood Gate | NP25 4EE |
| Kingswood Road | NP25 5BX |
| Levitsfield Close | NP25 5BZ |
| Lilac Drive | NP25 5DY |
| Maple Drive | NP25 5DZ |
| Mid Summer Way | NP25 5UT |
| Monk Street | NP25 3NZ |
| Monmouth Keep | NP25 3EN |
| Monnow Keep | NP25 3EX |
| Monnow Street | NP25 3EE NP25 3EF NP25 3EQ NP25 3EW NP25 3EG NP25 3XH NP25 3XJ |
| Nailors Lane | NP25 3EH |
| Oaklands Drive | NP25 5DT |
| Opulus Way | NP25 5UW |
| Osbaston Road | NP25 3AX |
| Patterson Way | NP25 5BS |
| Powells Court | NP25 3DA |
| Primrose Close | NP25 5EW |
| Priory Street | NP25 3BR NP25 3NY NP25 3NX NP25 3TY NP25 3XA |
| Rockfield Avenue | NP25 5BB |
| Rockfield Road | NP25 5AU NP25 5BA NP25 5SR NP25 5ST |
| Rolls Avenue | NP25 5AY |
| Rushey Meadow | NP25 5BT |
| Russell Place | NP25 3EB |
| Shelley Crescent | NP25 5AZ |
| Shrewsbury Avenue | NP25 5GE |
| St James Mews | NP25 3BW |
| St John Street | NP25 3EA |
| St Mary Street | NP25 3DB NP25 3DD |
| St Maughans Close | NP25 5BU |
| St Thomas Road | NP25 5SA NP25 5SB |
| St Vincents Drive | NP25 5DS |
| Ternata Drive | NP25 5UY NP25 5UZ NP25 5WA |
| The Oldway Centre | NP25 3PT NP25 3PS |
| Tower View | NP25 5FD |
| Trafalgar Close | NP25 5DR |
| Watery Lane | NP25 5AT |
| Wheatfield Close | NP25 5BD |
| Whitecross Street | NP25 3BY NP25 3BZ |
| Whitehill Close | NP25 5FG |
| Willow Drive | NP25 5DW |
| Worcester Street | NP25 3DF |
| NP25 3BS NP25 3EJ NP25 3YR NP25 4XJ NP25 5YZ NP25 5ZG NP25 9BD NP25 9BF NP25 9BH NP25 9BL NP25 9BN NP25 9BQ NP25 9BR |
Transport near Drybridge
- FAQ
- Price Paid By Year
- Property Type Price
Frequently asked questions about Drybridge
What is the average price for a property for sale in Drybridge?
The average price for a property for sale in Drybridge is £324,114. This amount is 13% lower than the average price in Monmouth. There are 527 property listings for sale in Drybridge.
What streets have the most expensive properties for sale in Drybridge?
The streets with the most expensive properties for sale in Drybridge are Monk Street at an average of £559,250, Levitsfield Close at an average of £501,000 and Glendower Street at an average of £497,000.
What streets have the most affordable properties for sale in Drybridge?
The streets with the most affordable properties for sale in Drybridge are The Oldway Centre at an average of £146,785, Hendre Close at an average of £150,000 and Chippenham Court at an average of £154,029.
Which train stations are available in or near Drybridge?
Some of the train stations available in or near Drybridge are Lydney, Chepstow and Abergavenny.
Property Price Paid in Drybridge by Year
The average sold property price by year was:
| Year | Average Sold Price | Price Change |
Sold Properties
|
|---|---|---|---|
| 2025 | £317,326 | -7% |
52 Properties |
| 2024 | £339,171 | 3% |
70 Properties |
| 2023 | £328,671 | 6% |
64 Properties |
| 2022 | £309,933 | -2% |
70 Properties |
| 2021 | £314,600 | 6% |
107 Properties |
| 2020 | £294,671 | 1% |
96 Properties |
| 2019 | £290,882 | 6% |
135 Properties |
| 2018 | £273,626 | 1% |
141 Properties |
| 2017 | £270,665 | 11% |
142 Properties |
| 2016 | £239,951 | 7% |
78 Properties |
| 2015 | £223,698 | -3% |
78 Properties |
| 2014 | £230,192 | 7% |
86 Properties |
| 2013 | £213,445 | -2% |
92 Properties |
| 2012 | £217,193 | 9% |
74 Properties |
| 2011 | £197,863 | -9% |
57 Properties |
| 2010 | £216,119 | 13% |
70 Properties |
| 2009 | £187,784 | -28% |
55 Properties |
| 2008 | £240,270 | 3% |
30 Properties |
| 2007 | £232,519 | 5% |
104 Properties |
| 2006 | £220,350 | 6% |
128 Properties |
| 2005 | £206,472 | 12% |
135 Properties |
| 2004 | £182,446 | 7% |
222 Properties |
| 2003 | £169,127 | 24% |
129 Properties |
| 2002 | £128,180 | 12% |
121 Properties |
| 2001 | £112,634 | -2% |
97 Properties |
| 2000 | £114,928 | 17% |
129 Properties |
| 1999 | £95,395 | 25% |
94 Properties |
| 1998 | £71,678 | 7% |
28 Properties |
| 1997 | £66,875 | 6% |
47 Properties |
| 1996 | £63,000 | -1% |
27 Properties |
| 1995 | £63,943 | - |
23 Properties |
Property Price per Property Type in Drybridge
Here you can find historic sold price data in order to help with your property search.
The average Property Paid Price for specific property types in the last three years are:
| Property Type | Average Sold Price | Sold Properties |
|---|---|---|
| Semi Detached House | £290,499.00 | 56 Semi Detached Houses |
| Detached House | £426,978.00 | 95 Detached Houses |
| Terraced House | £302,252.00 | 57 Terraced Houses |
| Flat | £185,708.00 | 48 Flats |

