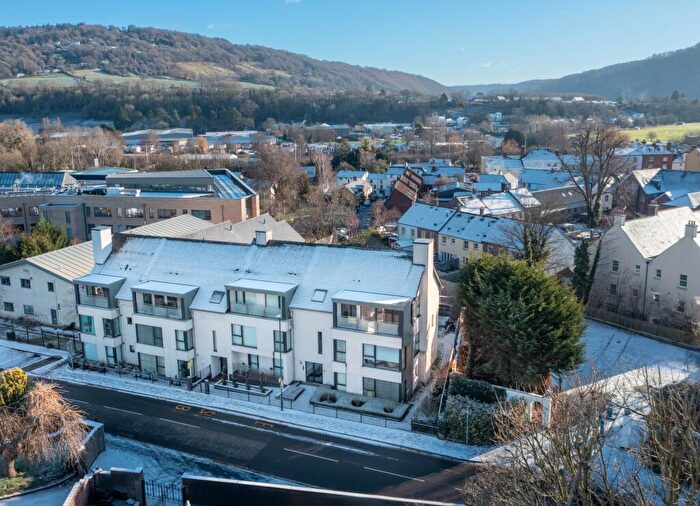
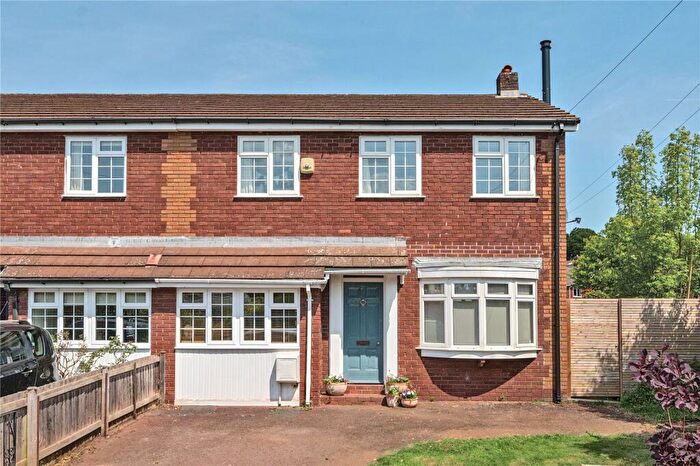
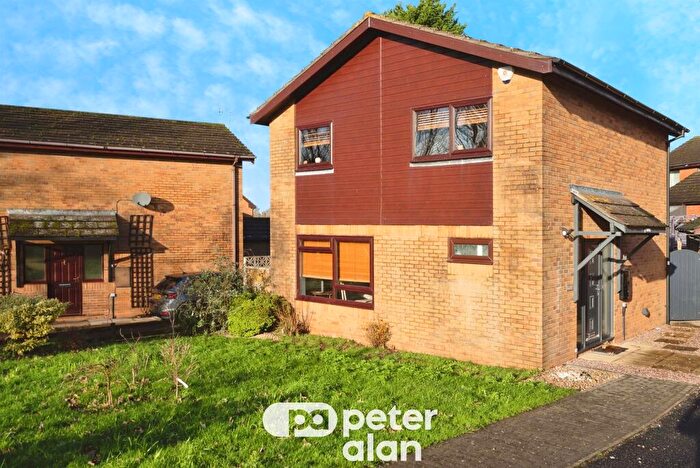
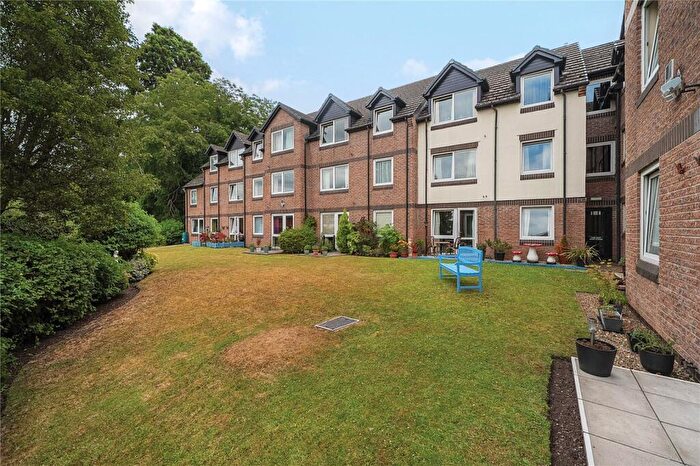
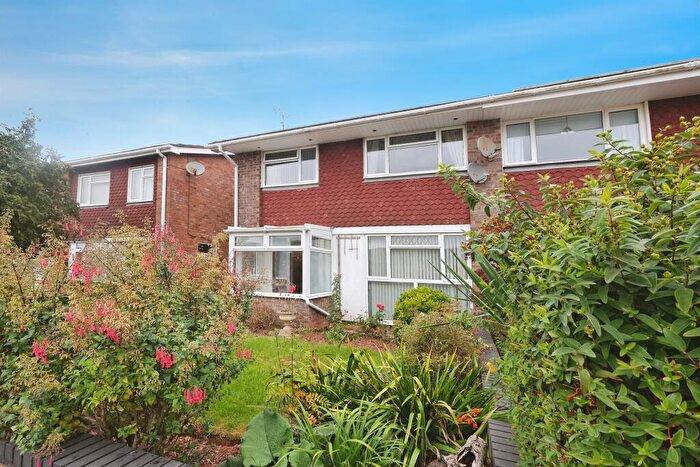
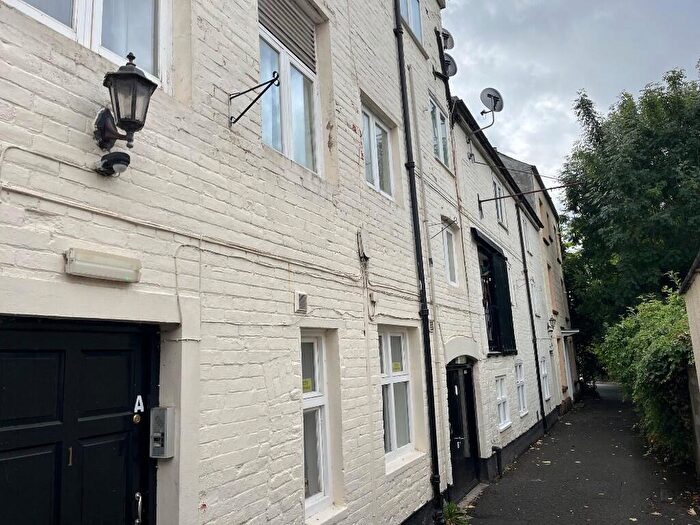
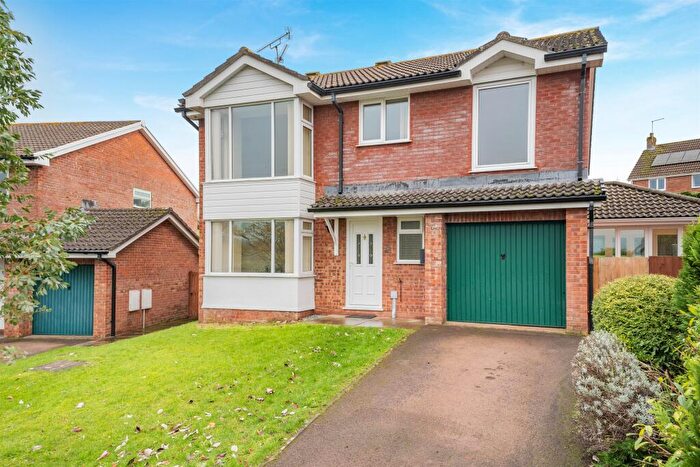
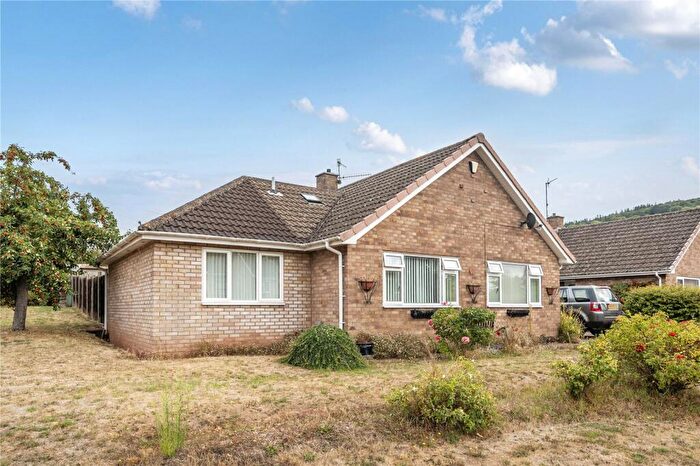
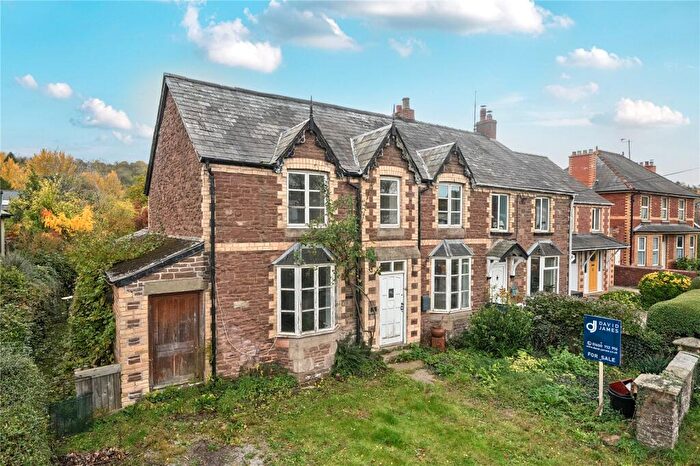
Houses for sale & to rent in Wyesham, Monmouth
House Prices in Wyesham
Properties in Wyesham have an average house price of £274,473.00 and had 103 Property Transactions within the last 3 years¹.
Wyesham is an area in Monmouth, Sir Fynwy - Monmouthshire with 959 households², where the most expensive property was sold for £820,000.00.
Properties for sale in Wyesham
Roads and Postcodes in Wyesham
Navigate through our locations to find the location of your next house in Wyesham, Monmouth for sale or to rent.
| Streets | Postcodes |
|---|---|
| Blake Street | NP25 3TH |
| Chapel Close | NP25 3NN |
| Chestnut Court | NP25 3TP |
| Chestnut Terrace | NP25 3JY |
| Church Farm | NP25 3GZ |
| Claypatch Road | NP25 3PN |
| Fairview Close | NP25 3LQ |
| Greenlands Close | NP25 3LP |
| Hadnock Road | NP25 3NG NP25 3NJ NP25 3NL NP25 3NQ NP25 3YD |
| Hadnock Road Industrial Estate | NP25 3QG |
| Heath Street | NP25 3TL |
| High Meadow | NP25 3TB |
| Hill Crest Close | NP25 3LN |
| Hill Farm Close | NP25 3TN |
| Hillcrest Road | NP25 3LH NP25 3LJ |
| Justins Hill | NP25 3TD |
| Kymin Lea | NP25 3TF |
| Limetree Avenue | NP25 3LA |
| Mayhill | NP25 3LX |
| Newland Way | NP25 3LL |
| Oak Crescent | NP25 3LB |
| Old School Lane | NP25 3PW |
| Orchard Court | NP25 3ND |
| Orchard End | NP25 3TG |
| Reade Street | NP25 3TJ |
| Redbrook Road | NP25 3LY NP25 3LZ NP25 3NB NP25 3NA NP25 4LE |
| Ridgeway | NP25 3JX |
| Riverside Park | NP25 3LT |
| Rose Cottages | NP25 4LW |
| Staunton Road | NP25 3SA NP25 3SB |
| The Downhams | NP25 3TE |
| The Kymin | NP25 3SD NP25 3SE NP25 3SF |
| The Old Road | NP25 3LS |
| The Paddocks | NP25 3NP |
| Tudor Cottages | NP25 3LU |
| Tudor Road | NP25 3LE NP25 3LF |
| Underhill | NP25 3LG |
| Woodland View | NP25 3JN NP25 3JW NP25 3LD |
| Wyebridge Street | NP25 3AD |
| Wyesham Avenue | NP25 3NE NP25 3NF |
| Wyesham Lane | NP25 3JU |
| Wyesham Road | NP25 3JH NP25 3JP NP25 3JR NP25 3JS NP25 3JQ |
| NP25 4LU NP25 3JZ NP25 3NH |
Transport near Wyesham
- FAQ
- Price Paid By Year
- Property Type Price
Frequently asked questions about Wyesham
What is the average price for a property for sale in Wyesham?
The average price for a property for sale in Wyesham is £274,473. This amount is 26% lower than the average price in Monmouth. There are 552 property listings for sale in Wyesham.
What streets have the most expensive properties for sale in Wyesham?
The streets with the most expensive properties for sale in Wyesham are Rose Cottages at an average of £593,000, Wyesham Lane at an average of £575,000 and The Kymin at an average of £428,333.
What streets have the most affordable properties for sale in Wyesham?
The streets with the most affordable properties for sale in Wyesham are Newland Way at an average of £152,000, Kymin Lea at an average of £188,800 and Blake Street at an average of £199,990.
Which train stations are available in or near Wyesham?
Some of the train stations available in or near Wyesham are Lydney, Chepstow and Abergavenny.
Property Price Paid in Wyesham by Year
The average sold property price by year was:
| Year | Average Sold Price | Price Change |
Sold Properties
|
|---|---|---|---|
| 2025 | £284,107 | 8% |
14 Properties |
| 2024 | £262,148 | -19% |
40 Properties |
| 2023 | £311,261 | 17% |
22 Properties |
| 2022 | £257,762 | 4% |
27 Properties |
| 2021 | £248,197 | 2% |
38 Properties |
| 2020 | £244,181 | 9% |
22 Properties |
| 2019 | £223,150 | 10% |
36 Properties |
| 2018 | £200,857 | 6% |
28 Properties |
| 2017 | £189,171 | -8% |
33 Properties |
| 2016 | £205,056 | 4% |
33 Properties |
| 2015 | £196,006 | 2% |
40 Properties |
| 2014 | £191,573 | 9% |
46 Properties |
| 2013 | £174,216 | -7% |
54 Properties |
| 2012 | £186,235 | -2% |
26 Properties |
| 2011 | £189,219 | -5% |
24 Properties |
| 2010 | £197,854 | 1% |
21 Properties |
| 2009 | £196,372 | 26% |
20 Properties |
| 2008 | £144,908 | -38% |
24 Properties |
| 2007 | £199,499 | 2% |
37 Properties |
| 2006 | £196,354 | 4% |
32 Properties |
| 2005 | £188,994 | 26% |
36 Properties |
| 2004 | £139,255 | 16% |
49 Properties |
| 2003 | £117,643 | 14% |
51 Properties |
| 2002 | £101,275 | 14% |
47 Properties |
| 2001 | £87,074 | 22% |
51 Properties |
| 2000 | £67,601 | -3% |
49 Properties |
| 1999 | £69,555 | 5% |
45 Properties |
| 1998 | £65,864 | 12% |
63 Properties |
| 1997 | £58,098 | 8% |
46 Properties |
| 1996 | £53,188 | -7% |
36 Properties |
| 1995 | £56,963 | - |
39 Properties |
Property Price per Property Type in Wyesham
Here you can find historic sold price data in order to help with your property search.
The average Property Paid Price for specific property types in the last three years are:
| Property Type | Average Sold Price | Sold Properties |
|---|---|---|
| Semi Detached House | £232,917.00 | 50 Semi Detached Houses |
| Detached House | £384,808.00 | 29 Detached Houses |
| Terraced House | £242,025.00 | 20 Terraced Houses |
| Flat | £156,250.00 | 4 Flats |

