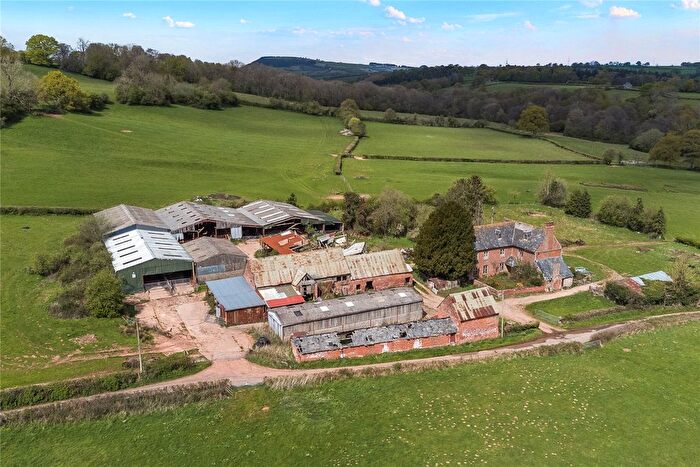
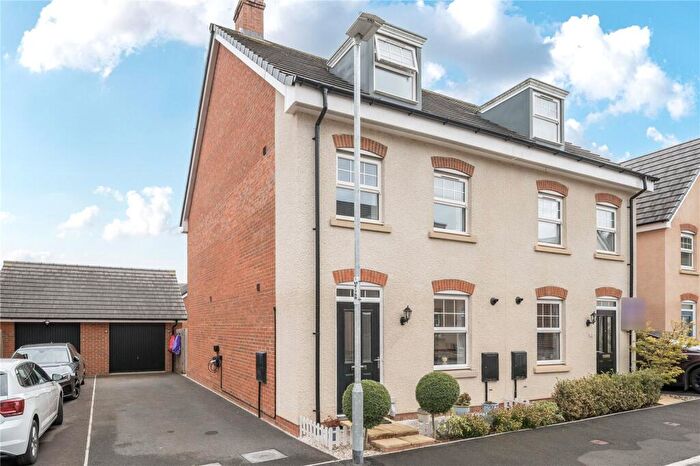
Houses for sale & to rent in Llantilio Crossenny, Monmouth
House Prices in Llantilio Crossenny
Properties in Llantilio Crossenny have an average house price of £720,062.00 and had 20 Property Transactions within the last 3 years¹.
Llantilio Crossenny is an area in Monmouth, Sir Fynwy - Monmouthshire with 321 households², where the most expensive property was sold for £1,875,000.00.
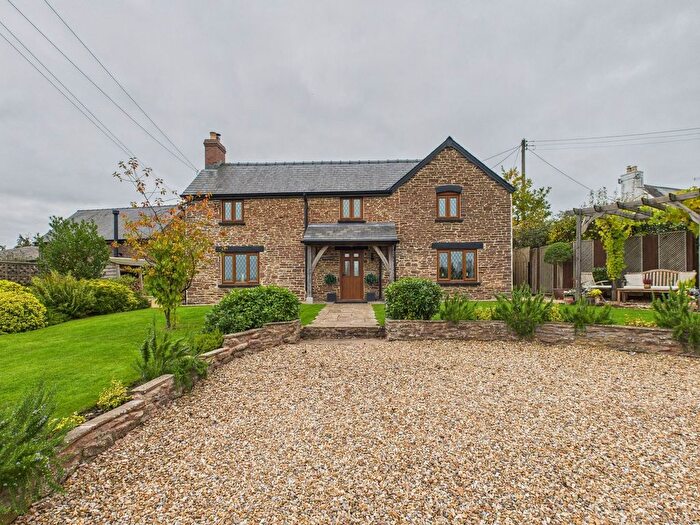
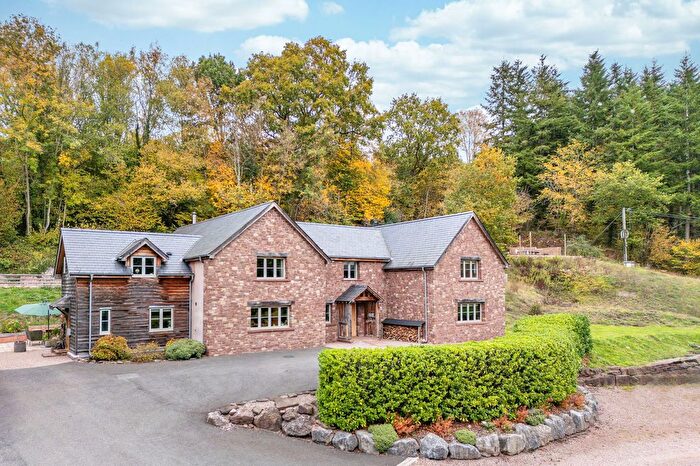
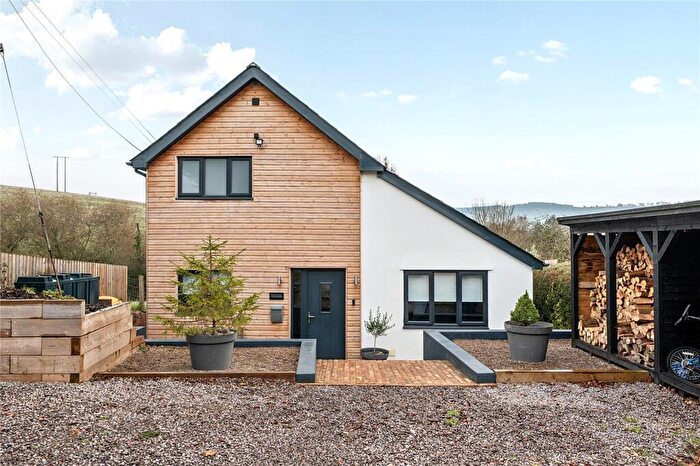
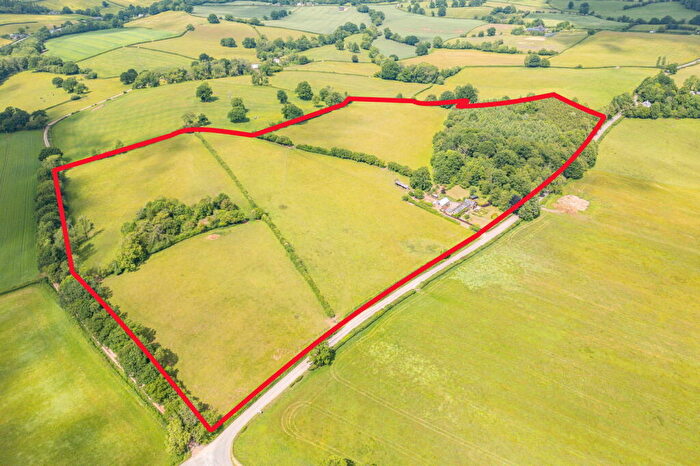
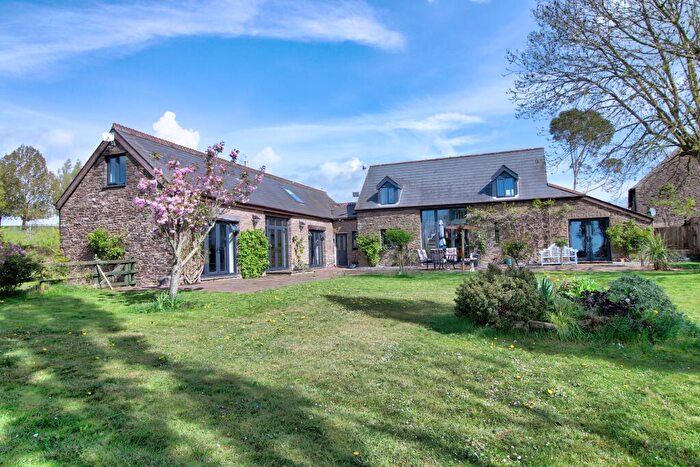
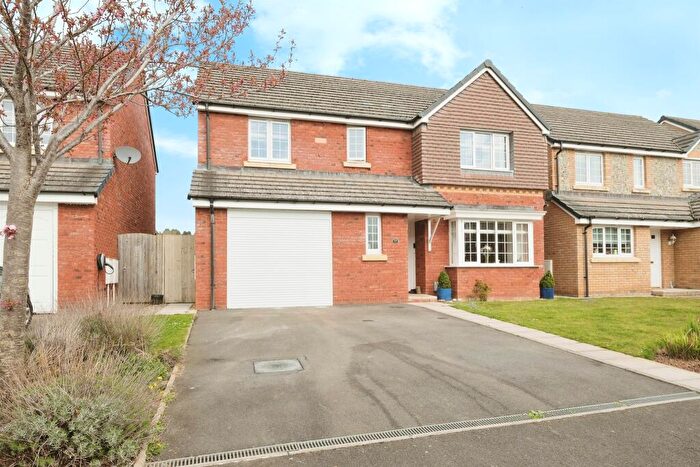
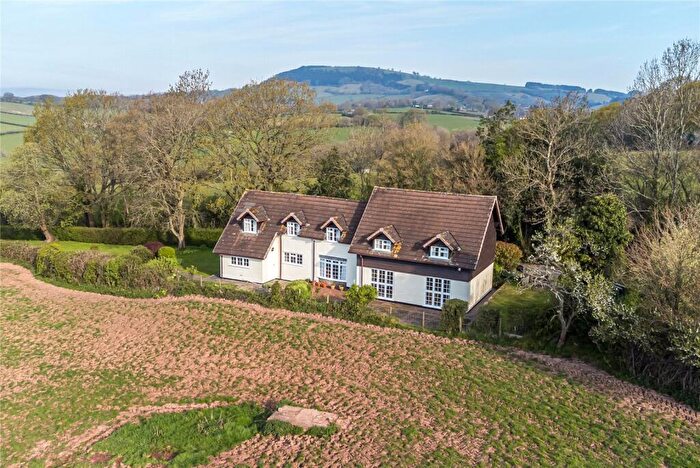
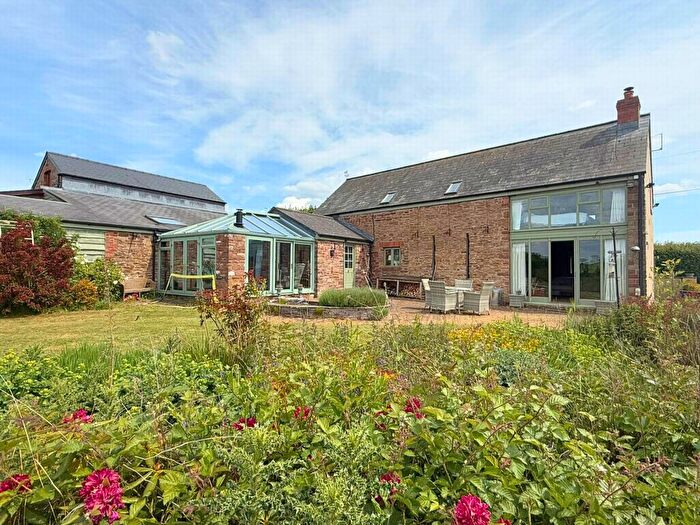
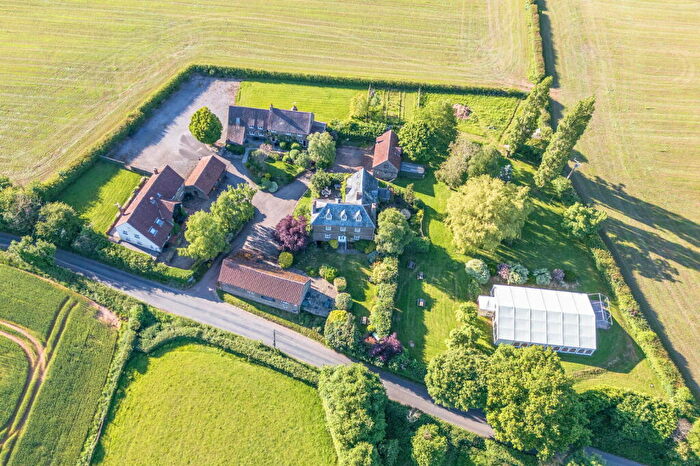
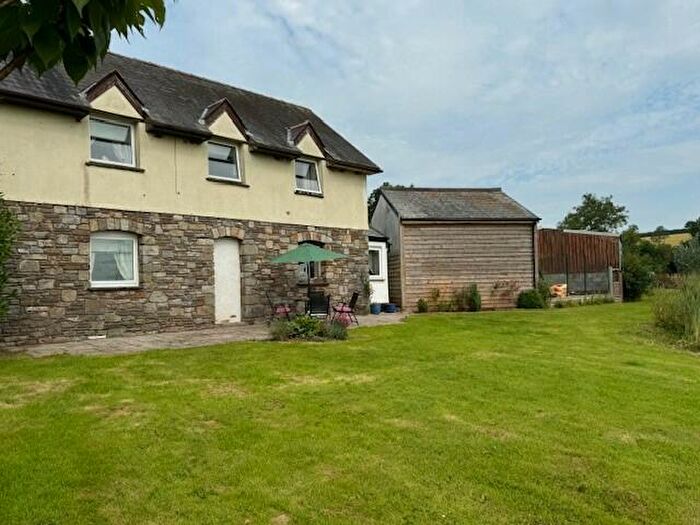
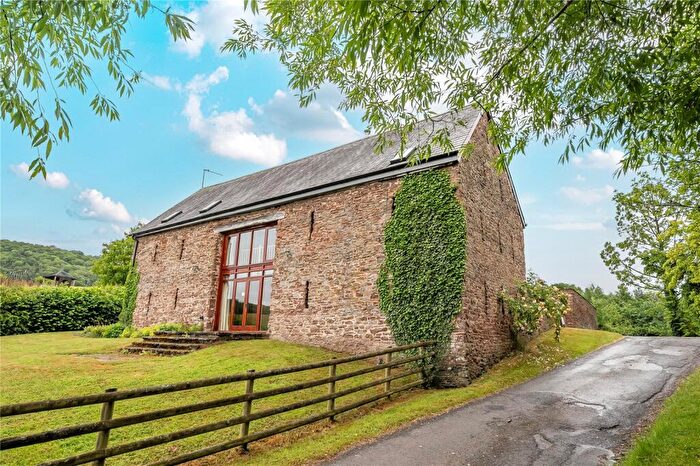
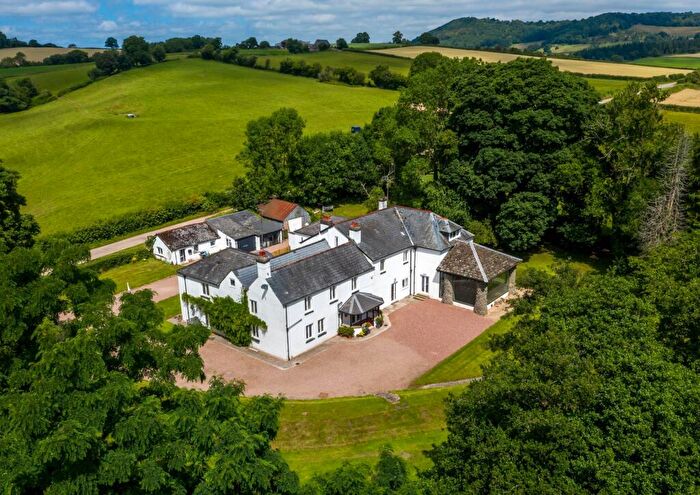
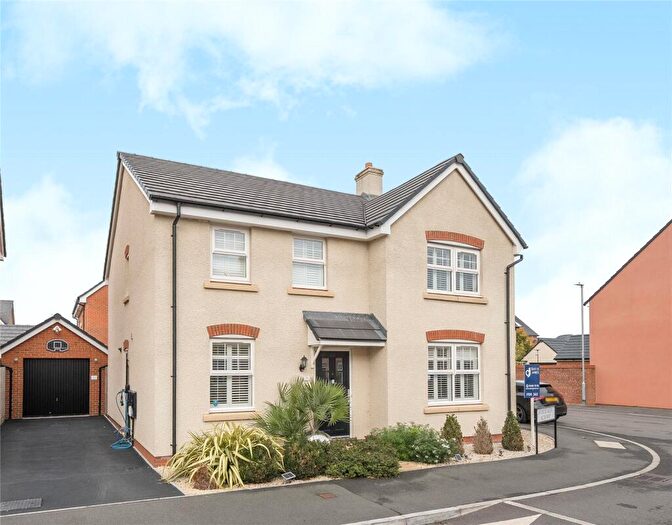
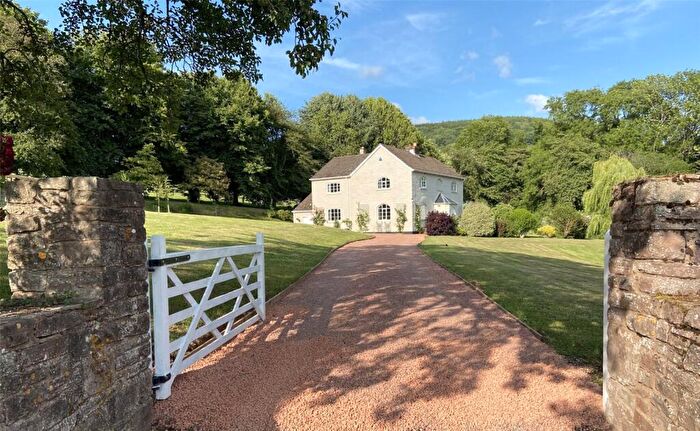
Properties for sale in Llantilio Crossenny
Previously listed properties in Llantilio Crossenny
Roads and Postcodes in Llantilio Crossenny
Navigate through our locations to find the location of your next house in Llantilio Crossenny, Monmouth for sale or to rent.
| Streets | Postcodes |
|---|---|
| Crossways | NP25 5NN NP25 5NP NP25 5NR NP25 5NS |
| Llanvolda | NP25 5HD |
| Nantycoy | NP25 5HF |
| Oak Grove | NP25 5PY |
| Rosedale | NP25 5HP |
| The Hendre | NP25 5HB NP25 5HG NP25 5HH NP25 5HJ NP25 5HQ NP25 5NL NP25 5SX NP25 5HE NP25 5NX |
| The Hendre Drive | NP25 5HT |
| The Onen | NP25 5EN |
| NP25 5HL NP25 5HN NP25 5HR NP25 5NF NP25 5NG NP25 5NJ NP25 5NQ NP25 5NT NP25 5NU NP25 5QB NP25 5QE NP25 5QF NP25 5QG NP25 5QH NP25 5QQ NP25 5SU NP25 5SZ NP25 4DJ NP25 5HW NP25 5NH NP25 5NW NP25 5NY NP25 5PW NP25 5PX NP25 5PZ NP25 5QA NP25 5QD NP25 5SW NP25 5SY |
Transport near Llantilio Crossenny
- FAQ
- Price Paid By Year
- Property Type Price
Frequently asked questions about Llantilio Crossenny
What is the average price for a property for sale in Llantilio Crossenny?
The average price for a property for sale in Llantilio Crossenny is £720,062. This amount is 93% higher than the average price in Monmouth. There are 97 property listings for sale in Llantilio Crossenny.
What streets have the most expensive properties for sale in Llantilio Crossenny?
The street with the most expensive properties for sale in Llantilio Crossenny is The Hendre at an average of £820,750.
What streets have the most affordable properties for sale in Llantilio Crossenny?
The street with the most affordable properties for sale in Llantilio Crossenny is Oak Grove at an average of £251,000.
Which train stations are available in or near Llantilio Crossenny?
Some of the train stations available in or near Llantilio Crossenny are Abergavenny, Pontypool and New Inn and Lydney.
Property Price Paid in Llantilio Crossenny by Year
The average sold property price by year was:
| Year | Average Sold Price | Price Change |
Sold Properties
|
|---|---|---|---|
| 2025 | £425,666 | -93% |
3 Properties |
| 2024 | £820,000 | -10% |
4 Properties |
| 2023 | £903,375 | 42% |
8 Properties |
| 2022 | £523,450 | -19% |
5 Properties |
| 2021 | £624,666 | 22% |
15 Properties |
| 2020 | £488,325 | 2% |
6 Properties |
| 2019 | £478,785 | -33% |
7 Properties |
| 2018 | £636,111 | 48% |
9 Properties |
| 2017 | £332,277 | -18% |
9 Properties |
| 2016 | £391,363 | 12% |
11 Properties |
| 2015 | £344,034 | 6% |
13 Properties |
| 2014 | £322,487 | -22% |
4 Properties |
| 2013 | £394,799 | 27% |
10 Properties |
| 2012 | £287,500 | -23% |
4 Properties |
| 2011 | £353,428 | 15% |
7 Properties |
| 2010 | £300,625 | -53% |
4 Properties |
| 2009 | £460,000 | - |
3 Properties |
| 2008 | £460,000 | 31% |
1 Property |
| 2007 | £319,166 | -25% |
6 Properties |
| 2006 | £400,077 | 20% |
9 Properties |
| 2005 | £319,189 | -10% |
5 Properties |
| 2004 | £350,416 | 23% |
6 Properties |
| 2003 | £271,083 | -1% |
6 Properties |
| 2002 | £275,000 | 29% |
13 Properties |
| 2001 | £194,333 | 12% |
9 Properties |
| 2000 | £170,583 | 59% |
12 Properties |
| 1999 | £69,500 | -131% |
2 Properties |
| 1998 | £160,500 | 31% |
4 Properties |
| 1997 | £110,285 | 13% |
7 Properties |
| 1996 | £95,777 | -29% |
9 Properties |
| 1995 | £123,123 | - |
3 Properties |
Property Price per Property Type in Llantilio Crossenny
Here you can find historic sold price data in order to help with your property search.
The average Property Paid Price for specific property types in the last three years are:
| Property Type | Average Sold Price | Sold Properties |
|---|---|---|
| Semi Detached House | £381,250.00 | 4 Semi Detached Houses |
| Detached House | £841,616.00 | 15 Detached Houses |
| Terraced House | £252,000.00 | 1 Terraced House |

