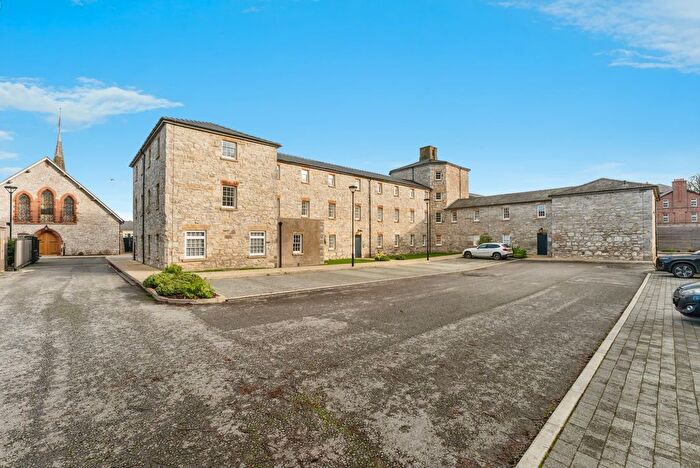
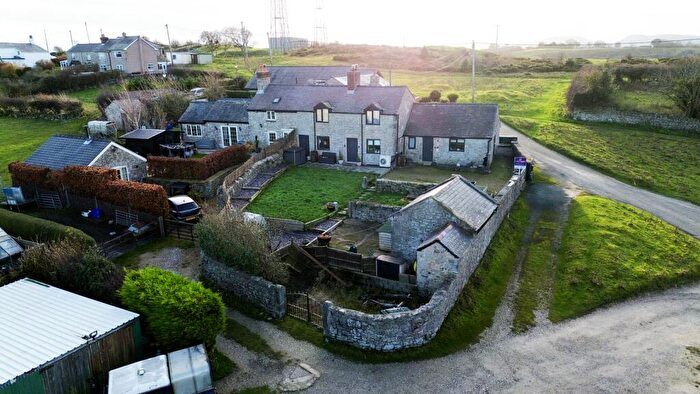
Houses for sale & to rent in Brynford, Holywell
House Prices in Brynford
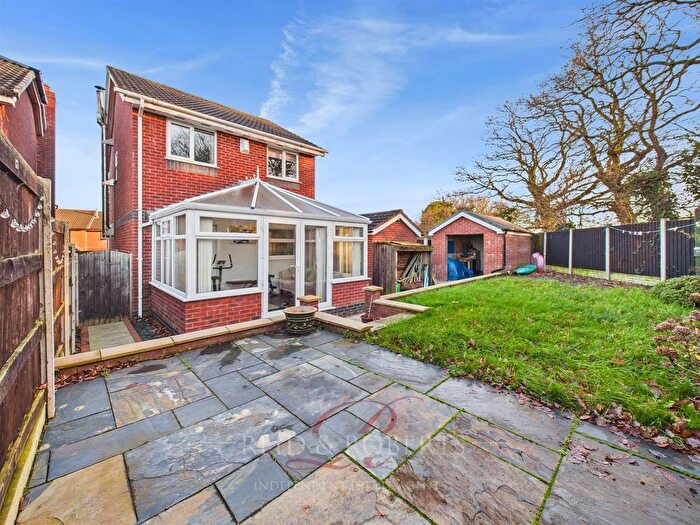
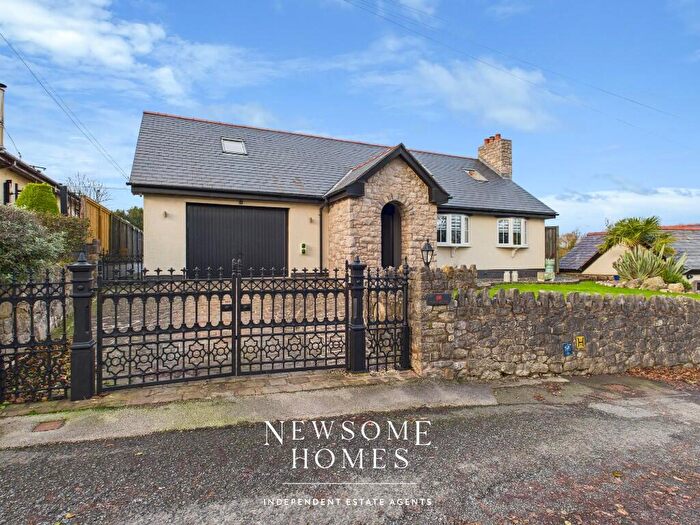
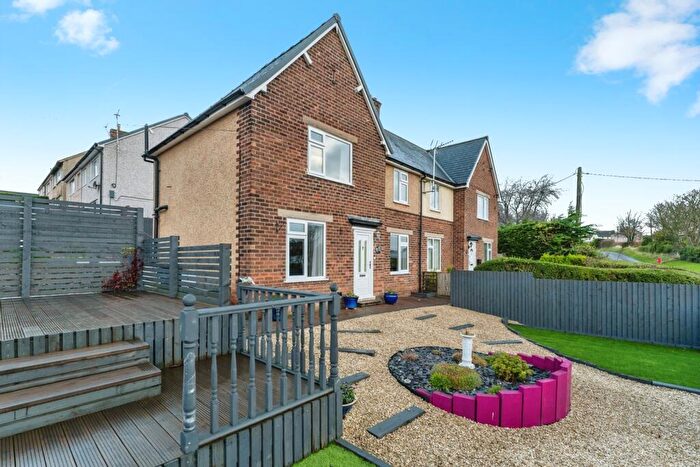
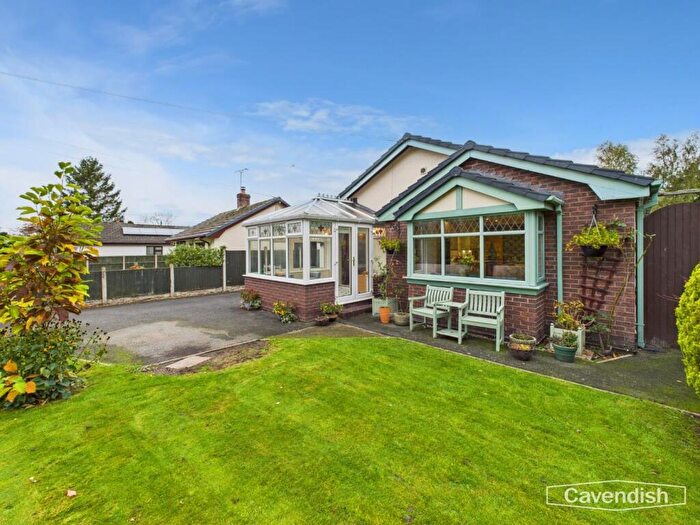
Properties in Brynford have an average house price of £271,874.00 and had 111 Property Transactions within the last 3 years¹.
Brynford is an area in Holywell, Sir y Fflint - Flintshire with 926 households², where the most expensive property was sold for £1,150,000.00.
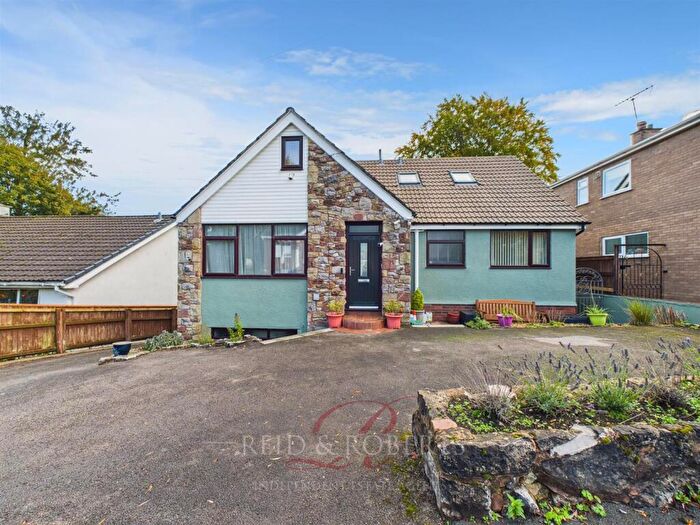
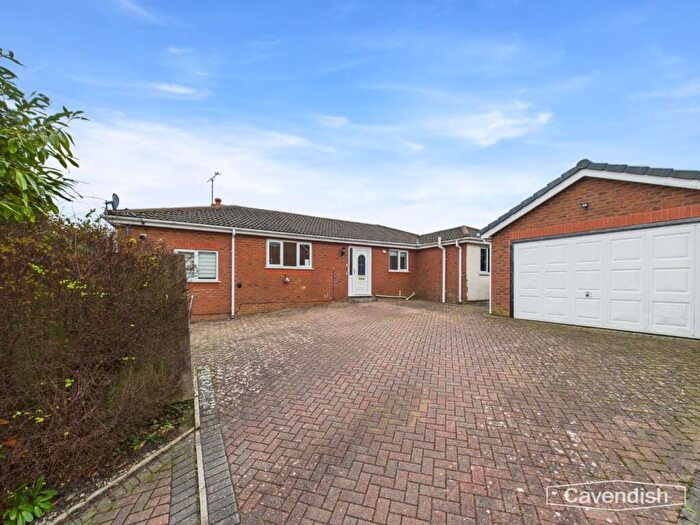
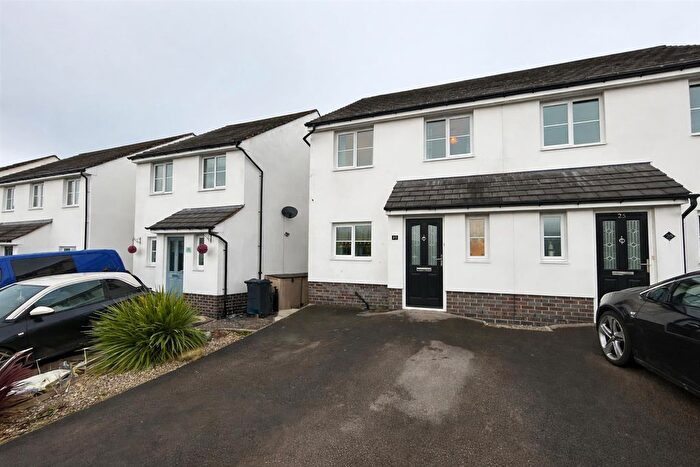
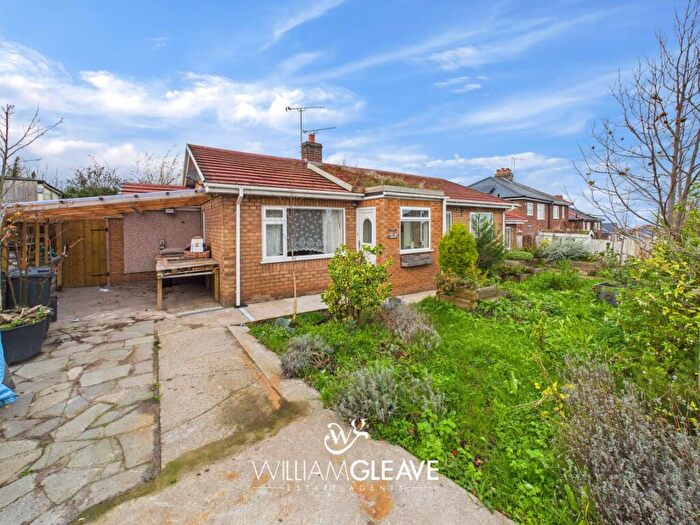
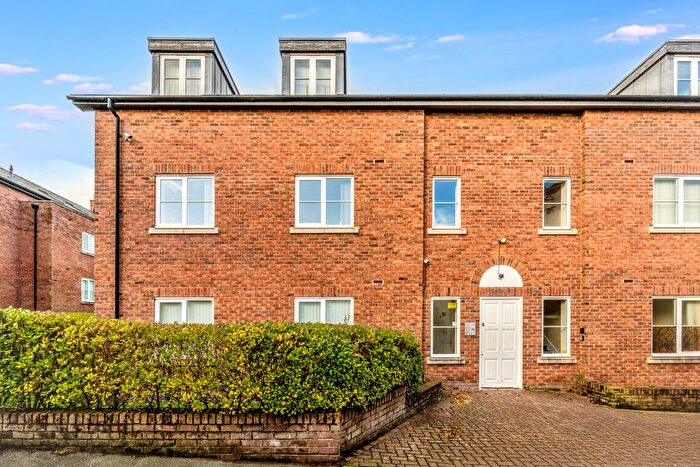
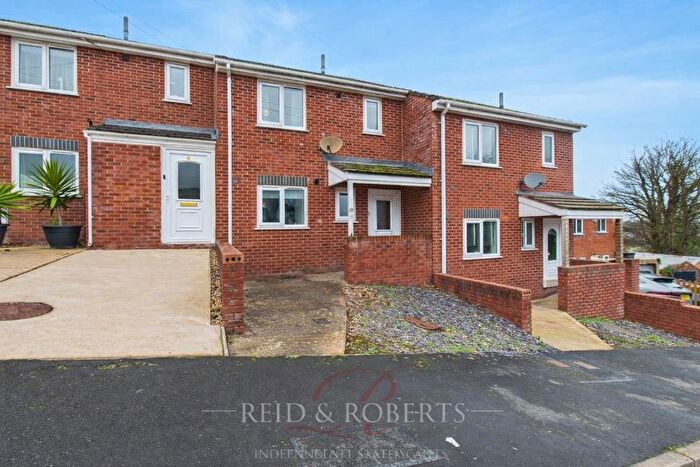
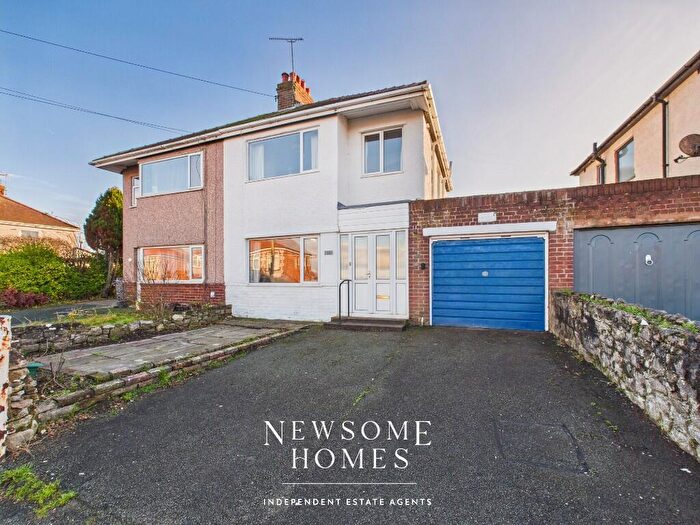
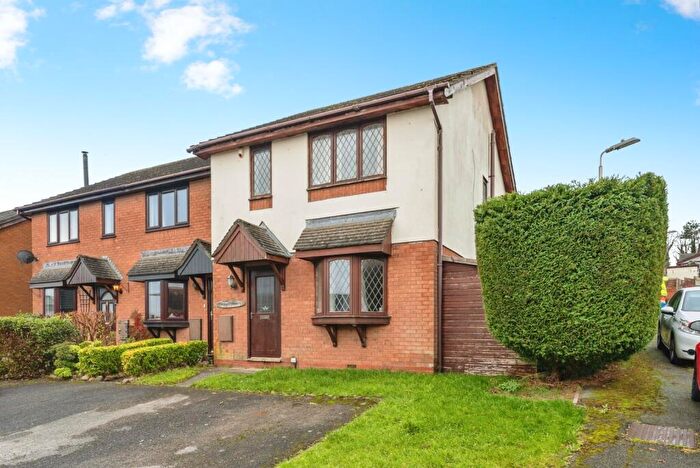
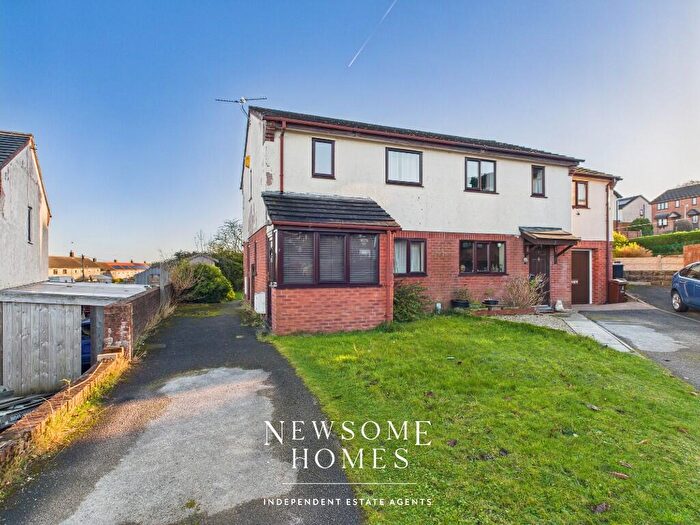
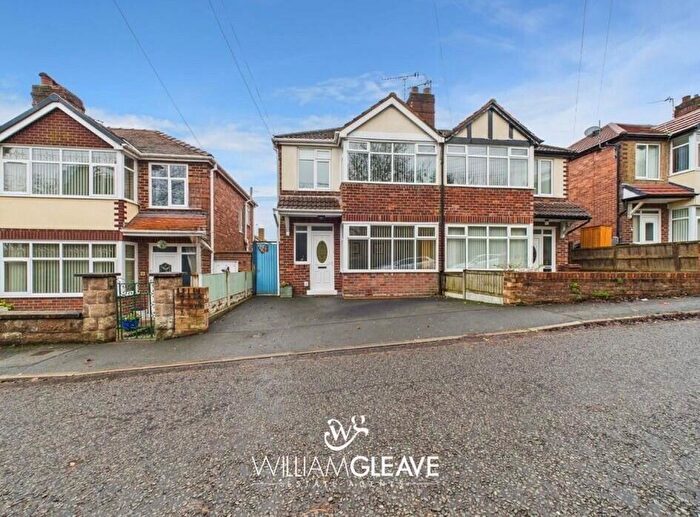
Properties for sale in Brynford
Roads and Postcodes in Brynford
Navigate through our locations to find the location of your next house in Brynford, Holywell for sale or to rent.
| Streets | Postcodes |
|---|---|
| Allt Y Plas | CH8 8JE CH8 8JF |
| Bryn Awel | CH8 8JB |
| Bryn Eithin | CH8 8HZ |
| Bryn Emlyn | CH8 8HW |
| Bryn Felin | CH8 8JU |
| Bryn Y Gwynt | CH8 8HU |
| Brynford Road | CH8 8AW |
| Brynsannan | CH8 8AX |
| Buxton Lane | CH8 8HH |
| Cae Derw | CH8 8JZ |
| Cae Helyg | CH8 8JA |
| Cae Masarn | CH8 8JY |
| Caelcoed Lane | CH8 8LE CH8 8LF |
| Caer Onnen | CH8 8JX |
| Calcoed | CH8 8AQ |
| Calcoed Lane | CH8 8PT |
| Flaxfield Close | CH8 8LB |
| Hafod Drive | CH8 8HT |
| Hafod Y Bryn | CH8 8AL |
| Halkyn Hall Estate | CH8 8HS |
| Heol Tywysog | CH8 8HA |
| Lily Terrace | CH8 8AF |
| Lixwm Road | CH8 8LR |
| Lleprog Lane | CH6 5RL |
| Llys Dedwydd | CH8 8AN |
| Llys Saron | CH8 8AS |
| Llys Y Nant | CH8 8LN |
| Lon Y Fron | CH8 8HX |
| Lon Y Mynydd | CH8 8LL |
| Maes Cynfaen | CH8 8LA |
| Maes Gwelfor | CH8 8AR |
| Maes Lygan | CH8 8JD |
| Naid Y March | CH8 8LG |
| Narrow Lane | CH8 8LH CH8 8LJ |
| Northop Road | CH8 8BE |
| Pen Y Ball | CH8 8LD CH8 8SU |
| Pen Y Pylle | CH8 8HB CH8 8HD |
| Pentre Road | CH8 8BS |
| Poplars Estate | CH8 8AU |
| Rhydymynydd | CH8 8AJ |
| Springfield Hill | CH8 8BA |
| The Nant | CH8 8BD |
| Uwch Y Mor | CH8 8HF |
| Willow Field Estate | CH8 8HQ |
| CH8 8AD CH8 8AG CH8 8AH CH8 8AP CH8 8BB CH8 8HE CH8 8HJ CH8 8HP CH8 8HR CH8 8LQ CH8 8LS CH8 8AT CH8 8HG CH8 8HL CH8 8HN CH8 8JP CH8 8LP |
Transport near Brynford
-
Flint Station
-
Neston Station
-
Shotton Station
-
Hawarden Bridge Station
-
Heswall Station
-
West Kirby Station
-
Hawarden Station
-
Buckley Station
-
Hoylake Station
-
Prestatyn Station
- FAQ
- Price Paid By Year
- Property Type Price
Frequently asked questions about Brynford
What is the average price for a property for sale in Brynford?
The average price for a property for sale in Brynford is £271,874. This amount is 26% higher than the average price in Holywell. There are 975 property listings for sale in Brynford.
What streets have the most expensive properties for sale in Brynford?
The streets with the most expensive properties for sale in Brynford are Pentre Road at an average of £902,500, Brynsannan at an average of £482,392 and Llys Y Nant at an average of £382,200.
What streets have the most affordable properties for sale in Brynford?
The streets with the most affordable properties for sale in Brynford are Caer Onnen at an average of £115,000, Maes Cynfaen at an average of £120,000 and Hafod Y Bryn at an average of £148,333.
Which train stations are available in or near Brynford?
Some of the train stations available in or near Brynford are Flint, Neston and Shotton.
Property Price Paid in Brynford by Year
The average sold property price by year was:
| Year | Average Sold Price | Price Change |
Sold Properties
|
|---|---|---|---|
| 2025 | £287,100 | 19% |
20 Properties |
| 2024 | £233,896 | -22% |
29 Properties |
| 2023 | £286,475 | 1% |
20 Properties |
| 2022 | £283,894 | 13% |
42 Properties |
| 2021 | £248,200 | 19% |
35 Properties |
| 2020 | £201,343 | 6% |
16 Properties |
| 2019 | £189,919 | -1% |
34 Properties |
| 2018 | £192,696 | -11% |
30 Properties |
| 2017 | £213,676 | 14% |
34 Properties |
| 2016 | £184,315 | -5% |
29 Properties |
| 2015 | £193,910 | 7% |
28 Properties |
| 2014 | £180,913 | 7% |
36 Properties |
| 2013 | £168,033 | -15% |
28 Properties |
| 2012 | £192,961 | 0,3% |
13 Properties |
| 2011 | £192,456 | 11% |
24 Properties |
| 2010 | £171,533 | 8% |
15 Properties |
| 2009 | £157,916 | -12% |
12 Properties |
| 2008 | £177,473 | -23% |
17 Properties |
| 2007 | £217,786 | 17% |
37 Properties |
| 2006 | £181,292 | 3% |
39 Properties |
| 2005 | £176,386 | 4% |
36 Properties |
| 2004 | £169,008 | 11% |
40 Properties |
| 2003 | £150,951 | 36% |
38 Properties |
| 2002 | £96,652 | -6% |
38 Properties |
| 2001 | £102,060 | 39% |
48 Properties |
| 2000 | £62,348 | -32% |
25 Properties |
| 1999 | £82,536 | 27% |
23 Properties |
| 1998 | £60,239 | -4% |
30 Properties |
| 1997 | £62,904 | 8% |
57 Properties |
| 1996 | £58,176 | -4% |
34 Properties |
| 1995 | £60,437 | - |
28 Properties |
Property Price per Property Type in Brynford
Here you can find historic sold price data in order to help with your property search.
The average Property Paid Price for specific property types in the last three years are:
| Property Type | Average Sold Price | Sold Properties |
|---|---|---|
| Semi Detached House | £186,772.00 | 33 Semi Detached Houses |
| Detached House | £361,403.00 | 59 Detached Houses |
| Terraced House | £141,671.00 | 19 Terraced Houses |

