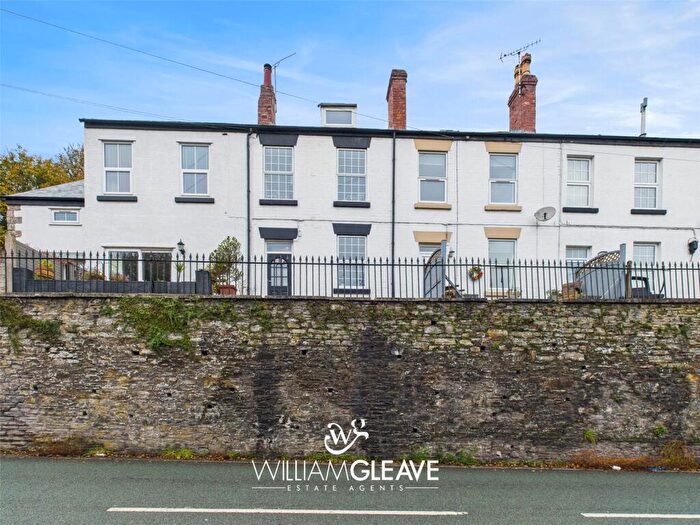
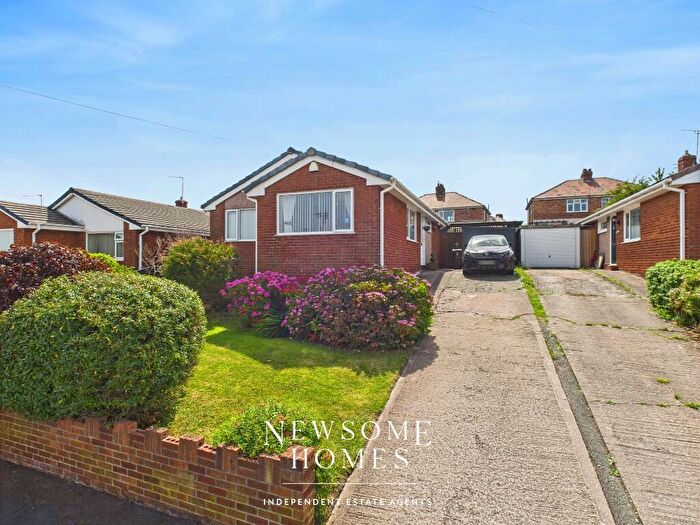
Houses for sale & to rent in Holywell Central, Holywell
House Prices in Holywell Central
Properties in Holywell Central have an average house price of £161,726.00 and had 83 Property Transactions within the last 3 years¹.
Holywell Central is an area in Holywell, Sir y Fflint - Flintshire with 891 households², where the most expensive property was sold for £330,000.00.
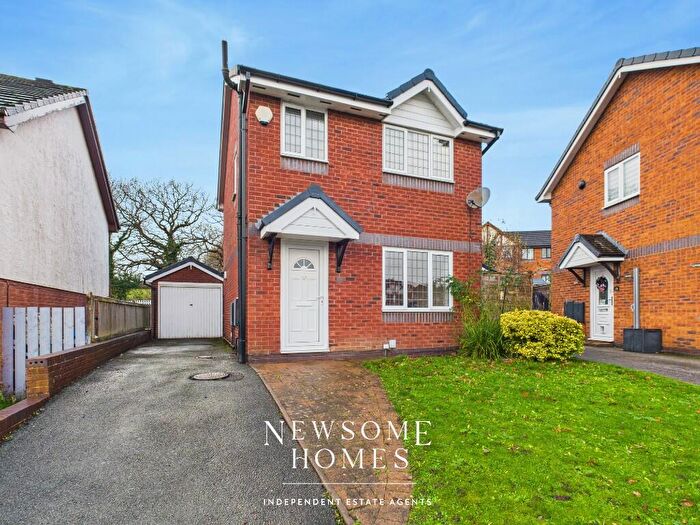
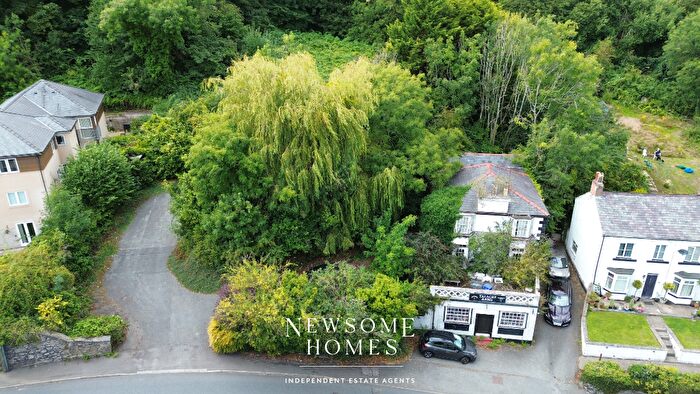
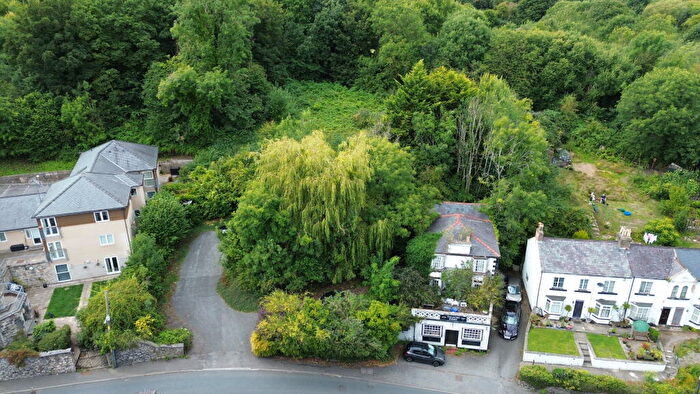
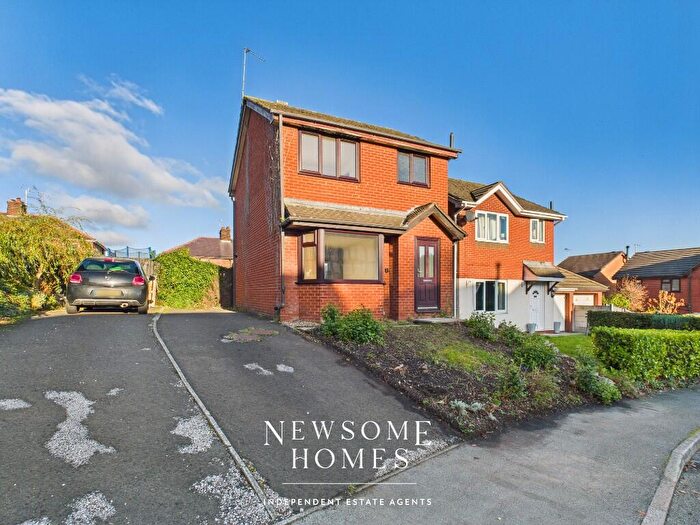
Properties for sale in Holywell Central
Roads and Postcodes in Holywell Central
Navigate through our locations to find the location of your next house in Holywell Central, Holywell for sale or to rent.
| Streets | Postcodes |
|---|---|
| Ael Y Ffynnon | CH8 7ND |
| Bagillt Road | CH8 7UA |
| Bagillt Street | CH8 7TR |
| Bank Place | CH8 7TJ |
| Brownsway | CH8 7PD |
| Bryn Mawr Road | CH8 7AP CH8 7AR |
| Bryn Y Coed | CH8 7AU |
| Bryn Y Felin | CH8 7AJ |
| Brynford Street | CH8 7RD CH8 7RA CH8 7FJ |
| Brynford Villas | CH8 7FD |
| Castle View | CH8 7NB |
| Clos Llwyn Onn | CH8 7UD |
| Coleshill Street | CH8 7UP CH8 7RS CH8 7XF |
| Court Place | CH8 7RE |
| Cross Roads | CH8 7UN |
| Cross Street | CH8 7LP |
| Deva Avenue | CH8 7AT |
| Dewi Avenue | CH8 7UG |
| Fron Park Mews | CH8 7US |
| Fron Park Road | CH8 7UX CH8 7UY |
| Greenfield Street | CH8 7PN |
| Gwenffrwd Road | CH8 7UZ |
| Gwenllys | CH8 7UL |
| Halkyn Road | CH8 7TZ CH8 7GA |
| Halkyn Street | CH8 7TX CH8 7XG |
| Hen Fuarth | CH8 7HN |
| Heol Y Brenin | CH8 7AH |
| High Street | CH8 7LE CH8 7LH CH8 7TD CH8 7TE CH8 7TF CH8 7AA CH8 7LA CH8 7LL CH8 7SR CH8 7TN CH8 7UB |
| High Street Square | CH8 7TW |
| Hillside Court | CH8 7PJ |
| Jenard Court | CH8 7SL |
| Llwyn Aled | CH8 7JA |
| Llwyn Beuno | CH8 7NE |
| Llys Y Fron | CH8 7UU |
| Maes Yr Odyn | CH8 7AD |
| New Road | CH8 7LS |
| North Road | CH8 7TQ |
| Panton Place | CH8 7LD |
| Park Lane | CH8 7UR |
| Pen Y Ball Street | CH8 7LU CH8 7LW |
| Pen-y-maes Road | CH8 7EN CH8 7UH |
| Plas Dewi | CH8 7PP |
| Plas Gwenfrewi | CH8 7LY |
| St Peters Estate | CH8 7UW |
| St Winefrides Court | CH8 7QY |
| Strand Close | CH8 7AL |
| Strand Crescent | CH8 7PE CH8 7PF |
| Strand Lane | CH8 7AG |
| Strand Park | CH8 7AE CH8 7AF |
| Strand Walk | CH8 7AN CH8 7AW |
| The Close | CH8 7RQ |
| Tower Gardens | CH8 7TG |
| Tudor Close | CH8 7JL |
| Tudor Villas | CH8 7NF |
| Wats Dyke Avenue | CH8 7AS |
| Well Street | CH8 7PL CH8 7GB |
| West Drive | CH8 7LR |
| Whitford Street | CH8 7NG CH8 7NJ CH8 7NL |
| CH8 7AX CH8 7PH CH8 7PQ CH8 7TH CH8 7UF CH8 7FE |
Transport near Holywell Central
-
Flint Station
-
Neston Station
-
West Kirby Station
-
Heswall Station
-
Hoylake Station
-
Manor Road Station
-
Shotton Station
-
Hawarden Bridge Station
-
Prestatyn Station
-
Meols Station
- FAQ
- Price Paid By Year
- Property Type Price
Frequently asked questions about Holywell Central
What is the average price for a property for sale in Holywell Central?
The average price for a property for sale in Holywell Central is £161,726. This amount is 25% lower than the average price in Holywell. There are 465 property listings for sale in Holywell Central.
What streets have the most expensive properties for sale in Holywell Central?
The streets with the most expensive properties for sale in Holywell Central are Clos Llwyn Onn at an average of £324,333, The Close at an average of £249,700 and Hillside Court at an average of £216,428.
What streets have the most affordable properties for sale in Holywell Central?
The streets with the most affordable properties for sale in Holywell Central are Tower Gardens at an average of £45,000, Plas Dewi at an average of £74,500 and Pen Y Ball Street at an average of £94,500.
Which train stations are available in or near Holywell Central?
Some of the train stations available in or near Holywell Central are Flint, Neston and West Kirby.
Property Price Paid in Holywell Central by Year
The average sold property price by year was:
| Year | Average Sold Price | Price Change |
Sold Properties
|
|---|---|---|---|
| 2025 | £175,850 | -6% |
11 Properties |
| 2024 | £185,977 | 32% |
24 Properties |
| 2023 | £125,650 | -28% |
20 Properties |
| 2022 | £161,160 | 19% |
28 Properties |
| 2021 | £130,660 | 14% |
28 Properties |
| 2020 | £112,277 | -17% |
18 Properties |
| 2019 | £130,925 | -9% |
20 Properties |
| 2018 | £142,225 | -6% |
30 Properties |
| 2017 | £151,315 | 22% |
22 Properties |
| 2016 | £117,746 | 10% |
26 Properties |
| 2015 | £106,096 | 10% |
14 Properties |
| 2014 | £95,296 | -6% |
21 Properties |
| 2013 | £101,430 | 18% |
15 Properties |
| 2012 | £82,818 | -7% |
11 Properties |
| 2011 | £88,571 | -37% |
14 Properties |
| 2010 | £121,115 | 19% |
13 Properties |
| 2009 | £98,272 | -4% |
11 Properties |
| 2008 | £102,575 | -56% |
10 Properties |
| 2007 | £160,342 | 18% |
26 Properties |
| 2006 | £131,616 | 18% |
25 Properties |
| 2005 | £107,609 | -1% |
28 Properties |
| 2004 | £108,485 | 40% |
27 Properties |
| 2003 | £65,123 | 16% |
29 Properties |
| 2002 | £54,563 | 0,4% |
33 Properties |
| 2001 | £54,332 | 17% |
37 Properties |
| 2000 | £45,061 | 7% |
27 Properties |
| 1999 | £42,025 | -11% |
16 Properties |
| 1998 | £46,631 | 14% |
11 Properties |
| 1997 | £40,297 | 7% |
20 Properties |
| 1996 | £37,576 | -62% |
17 Properties |
| 1995 | £60,700 | - |
5 Properties |
Property Price per Property Type in Holywell Central
Here you can find historic sold price data in order to help with your property search.
The average Property Paid Price for specific property types in the last three years are:
| Property Type | Average Sold Price | Sold Properties |
|---|---|---|
| Semi Detached House | £143,081.00 | 36 Semi Detached Houses |
| Detached House | £228,834.00 | 28 Detached Houses |
| Terraced House | £109,272.00 | 11 Terraced Houses |
| Flat | £82,875.00 | 8 Flats |

