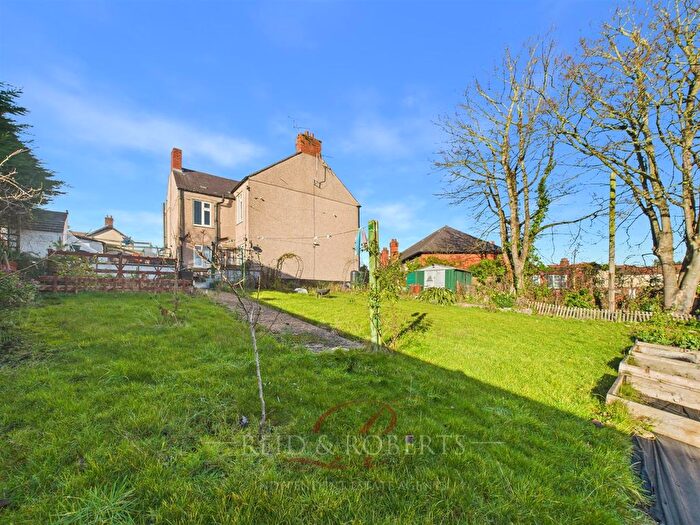
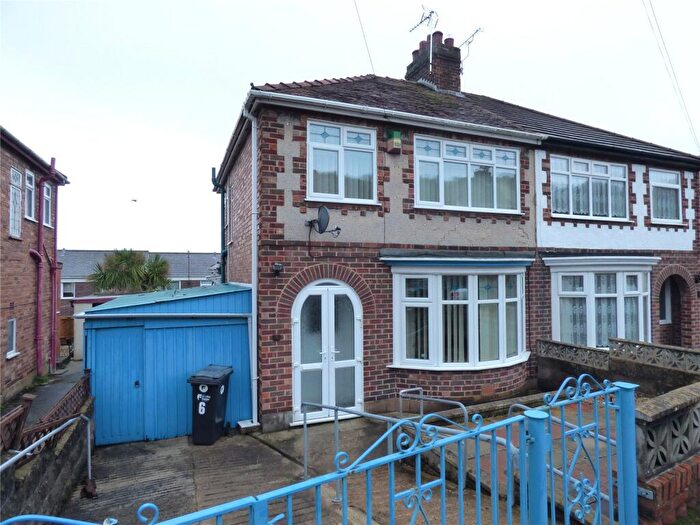
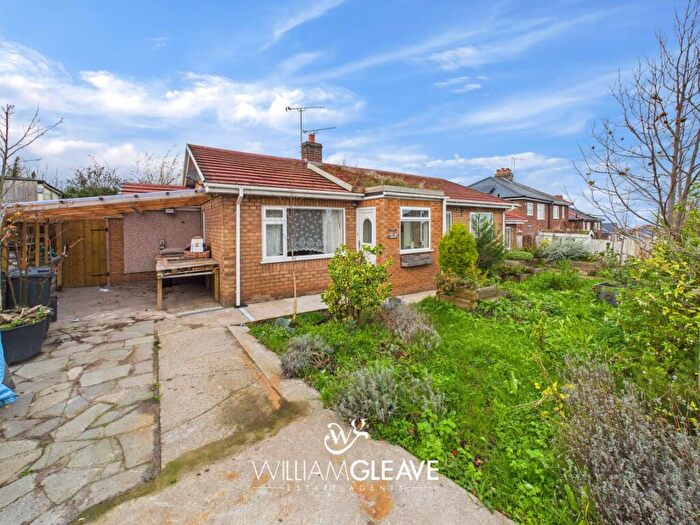
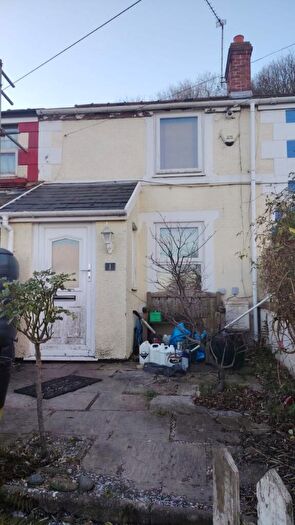
Houses for sale & to rent in Holywell West, Holywell
House Prices in Holywell West
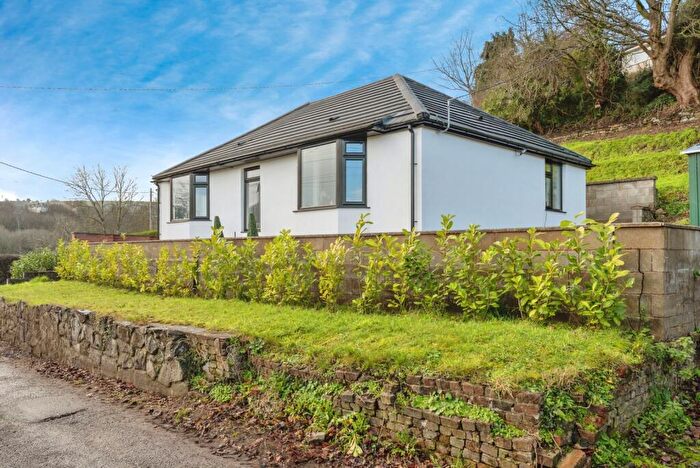
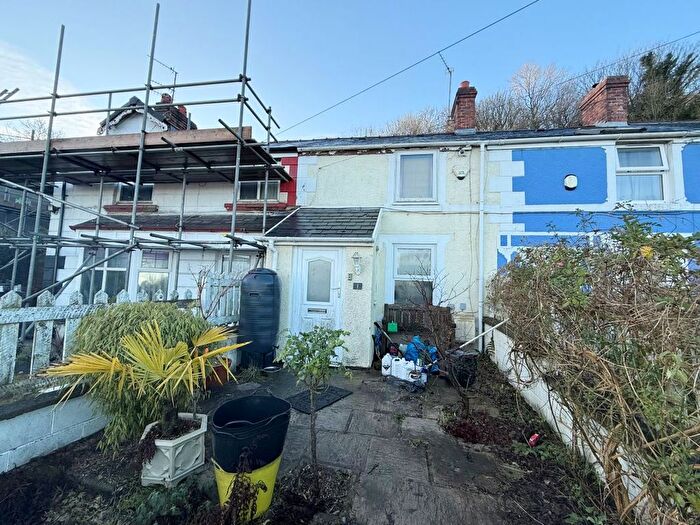
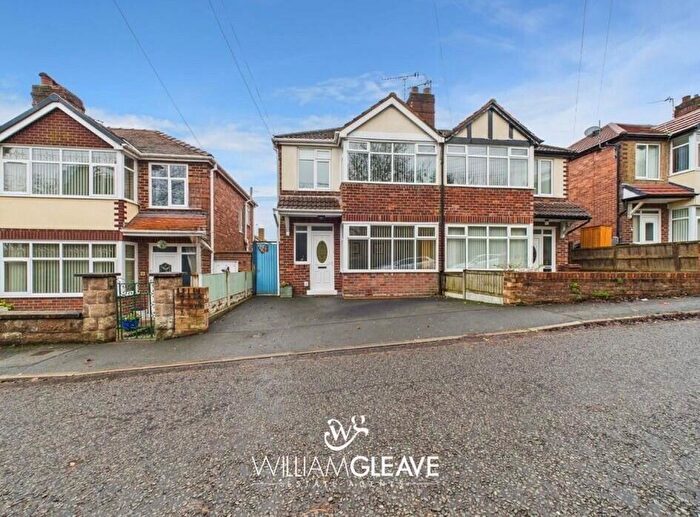
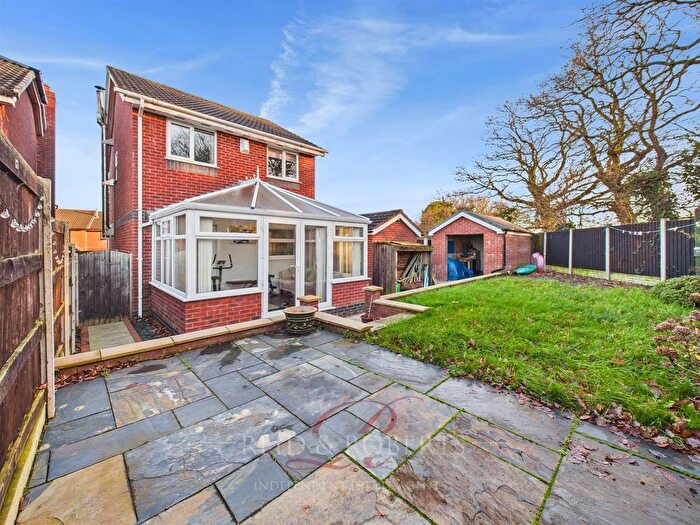
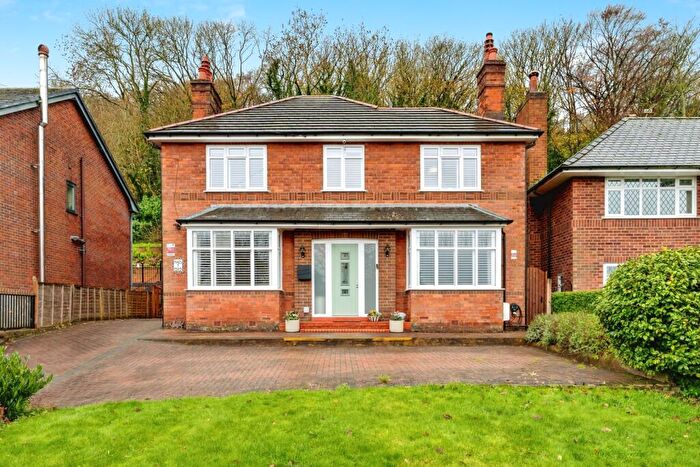
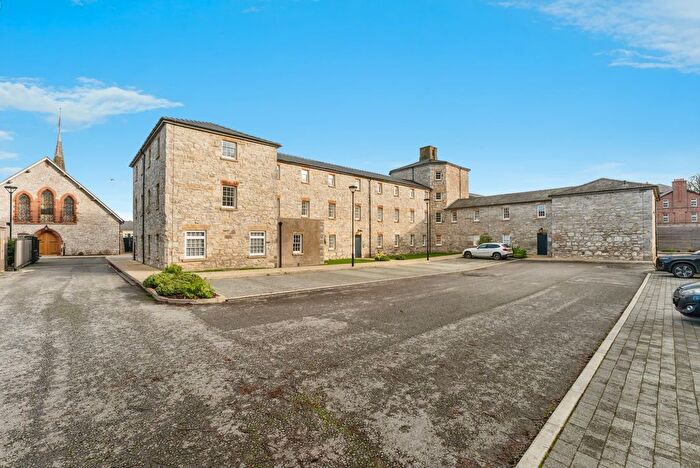
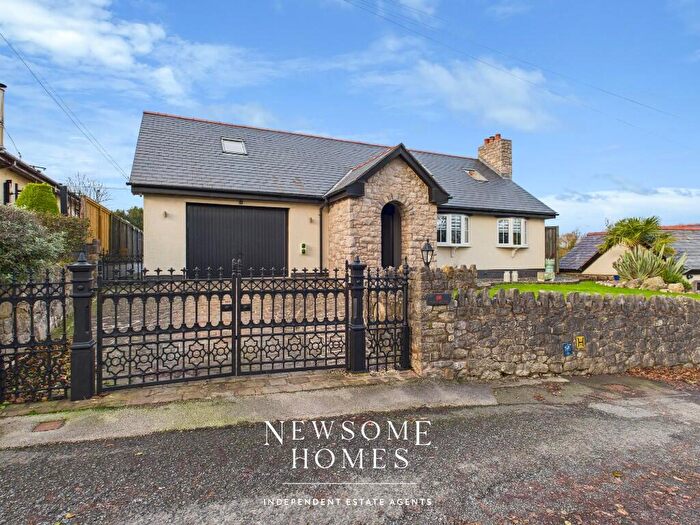
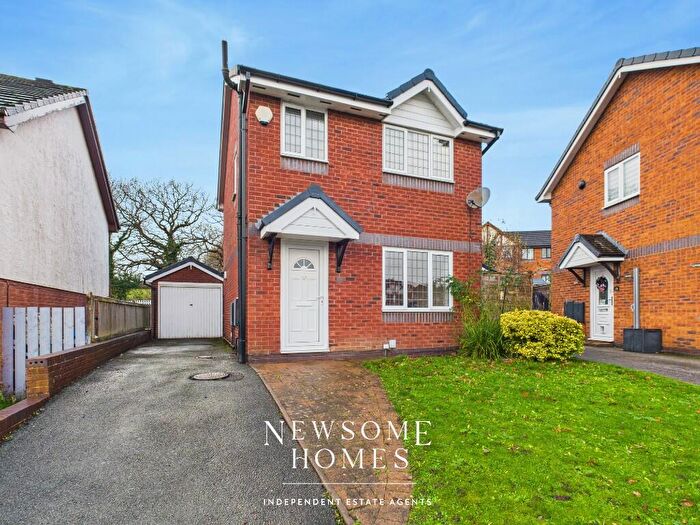
Properties in Holywell West have an average house price of £208,055.00 and had 93 Property Transactions within the last 3 years¹.
Holywell West is an area in Holywell, Sir y Fflint - Flintshire with 950 households², where the most expensive property was sold for £470,000.00.
Properties for sale in Holywell West
Roads and Postcodes in Holywell West
Navigate through our locations to find the location of your next house in Holywell West, Holywell for sale or to rent.
| Streets | Postcodes |
|---|---|
| Bryn Aber | CH8 7NZ |
| Bryn Dyffryn | CH8 7DX |
| Bryn Ffynnon Terrace | CH8 7NW |
| Brynford Road | CH8 7RP CH8 7RL |
| Caer Fron | CH8 7RG |
| Coed Y Fron | CH8 7UJ |
| Ffordd Beuno | CH8 7PA |
| Ffordd Brynffynon | CH8 7EH |
| Ffordd Y Faenol Fach | CH8 7LG |
| Fron Park Road | CH8 7SD CH8 7SP CH8 7UT CH8 7UQ |
| Gladstone Cottages | CH8 7NQ |
| Grange Road | CH8 8ST |
| Greenfield Road | CH8 7PX |
| Gwel Afon | CH8 7NT |
| Hafan Deg | CH8 7DB |
| Halkyn Road | CH8 7RZ CH8 7SJ CH8 7SG |
| Holway Road | CH8 7NA CH8 7NH CH8 7NN CH8 7NS CH8 7LQ |
| Level Lane | CH8 7FB |
| Lluesty Gardens | CH8 7FL |
| Llys Bychan | CH8 7SX |
| Llys Delyn | CH8 7SY |
| Lon Goed | CH8 7PG |
| Maes Y Plwm | CH8 7XE |
| Meadow Bank | CH8 7EE CH8 7EF |
| Milwr Road | CH8 7SE |
| Moor Avenue | CH8 7DS |
| Moor Lane | CH8 7DN CH8 7DW |
| Moorfields | CH8 7DY CH8 7DZ |
| Nant Eos | CH8 7DA |
| Old Chester Road | CH8 7RX CH8 7RH CH8 7RY CH8 7SA CH8 7SQ |
| Pen Y Ball | CH8 8SZ |
| Pistyll | CH8 7SH |
| Seaview Terrace | CH8 7NR |
| Springfields | CH8 7DT |
| St James Place | CH8 7NP |
| Stamford Way | CH8 7SB |
| The Beeches | CH8 7SW |
| The Grove | CH8 7RJ |
| The Mount | CH8 7SF |
| The Ridgeway | CH8 7SN |
| Wedgewood Heights | CH8 7NY |
| Yr Aber | CH8 7RN |
Transport near Holywell West
-
Flint Station
-
Neston Station
-
West Kirby Station
-
Heswall Station
-
Hoylake Station
-
Prestatyn Station
-
Manor Road Station
-
Shotton Station
-
Hawarden Bridge Station
-
Meols Station
- FAQ
- Price Paid By Year
- Property Type Price
Frequently asked questions about Holywell West
What is the average price for a property for sale in Holywell West?
The average price for a property for sale in Holywell West is £208,055. This amount is 4% lower than the average price in Holywell. There are 386 property listings for sale in Holywell West.
What streets have the most expensive properties for sale in Holywell West?
The streets with the most expensive properties for sale in Holywell West are Ffordd Y Faenol Fach at an average of £395,000, Pen Y Ball at an average of £358,400 and Llys Bychan at an average of £353,500.
What streets have the most affordable properties for sale in Holywell West?
The streets with the most affordable properties for sale in Holywell West are Moorfields at an average of £88,000, Bryn Dyffryn at an average of £90,666 and Springfields at an average of £108,333.
Which train stations are available in or near Holywell West?
Some of the train stations available in or near Holywell West are Flint, Neston and West Kirby.
Property Price Paid in Holywell West by Year
The average sold property price by year was:
| Year | Average Sold Price | Price Change |
Sold Properties
|
|---|---|---|---|
| 2025 | £229,742 | 18% |
22 Properties |
| 2024 | £189,231 | -15% |
40 Properties |
| 2023 | £216,953 | 0,1% |
31 Properties |
| 2022 | £216,720 | 8% |
43 Properties |
| 2021 | £198,369 | 11% |
54 Properties |
| 2020 | £176,750 | 7% |
34 Properties |
| 2019 | £163,878 | -3% |
38 Properties |
| 2018 | £168,542 | 9% |
33 Properties |
| 2017 | £153,369 | 4% |
23 Properties |
| 2016 | £147,949 | -8% |
41 Properties |
| 2015 | £159,996 | -1% |
34 Properties |
| 2014 | £161,457 | 9% |
39 Properties |
| 2013 | £146,582 | -4% |
14 Properties |
| 2012 | £152,816 | -29% |
25 Properties |
| 2011 | £197,609 | 31% |
16 Properties |
| 2010 | £136,458 | -22% |
25 Properties |
| 2009 | £166,592 | -14% |
25 Properties |
| 2008 | £190,122 | 23% |
24 Properties |
| 2007 | £146,723 | -5% |
30 Properties |
| 2006 | £153,679 | 18% |
60 Properties |
| 2005 | £126,007 | 7% |
41 Properties |
| 2004 | £117,730 | 30% |
45 Properties |
| 2003 | £82,722 | 12% |
46 Properties |
| 2002 | £72,674 | -5% |
69 Properties |
| 2001 | £76,624 | 12% |
50 Properties |
| 2000 | £67,396 | -23% |
33 Properties |
| 1999 | £82,609 | 19% |
25 Properties |
| 1998 | £67,077 | 19% |
30 Properties |
| 1997 | £54,021 | -5% |
30 Properties |
| 1996 | £56,548 | 15% |
31 Properties |
| 1995 | £47,882 | - |
20 Properties |
Property Price per Property Type in Holywell West
Here you can find historic sold price data in order to help with your property search.
The average Property Paid Price for specific property types in the last three years are:
| Property Type | Average Sold Price | Sold Properties |
|---|---|---|
| Semi Detached House | £136,443.00 | 32 Semi Detached Houses |
| Detached House | £289,725.00 | 45 Detached Houses |
| Terraced House | £121,581.00 | 16 Terraced Houses |

