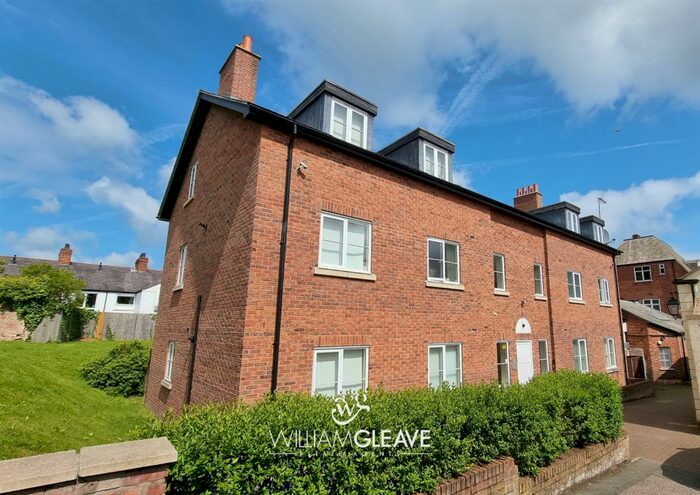
Houses for sale & to rent in Holywell East, Holywell
House Prices in Holywell East
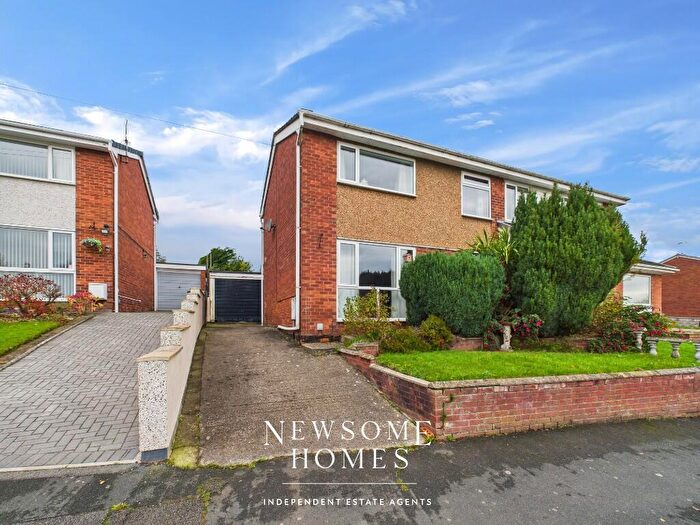
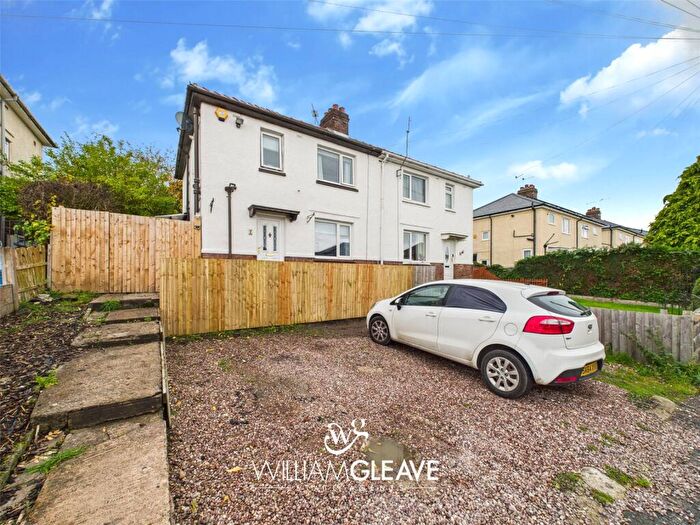
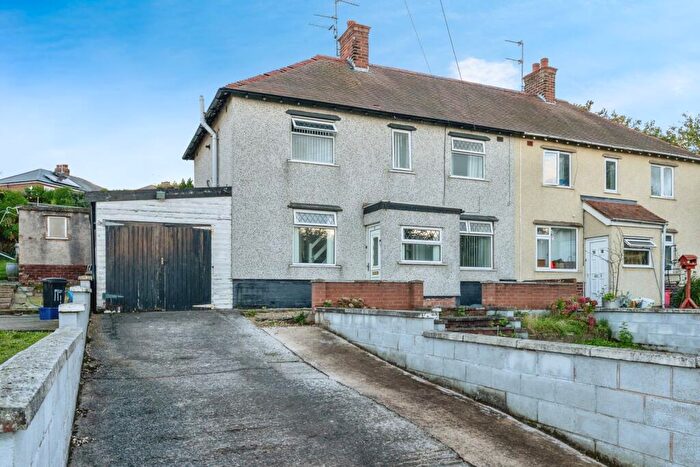
Properties in Holywell East have an average house price of £169,950.00 and had 72 Property Transactions within the last 3 years¹.
Holywell East is an area in Holywell, Sir y Fflint - Flintshire with 747 households², where the most expensive property was sold for £340,000.00.
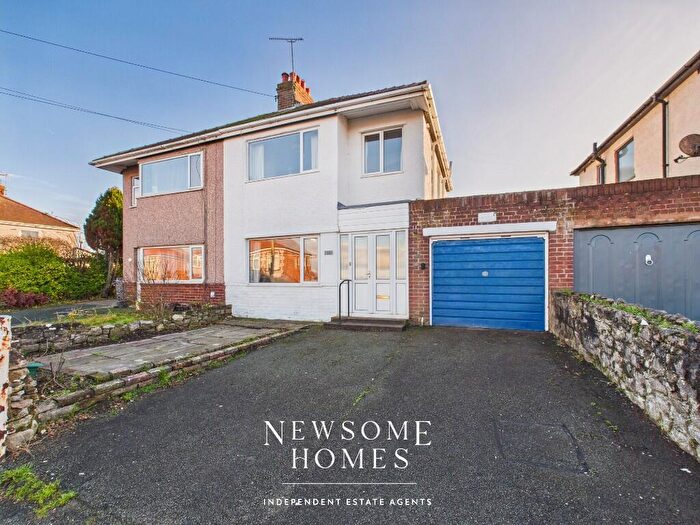
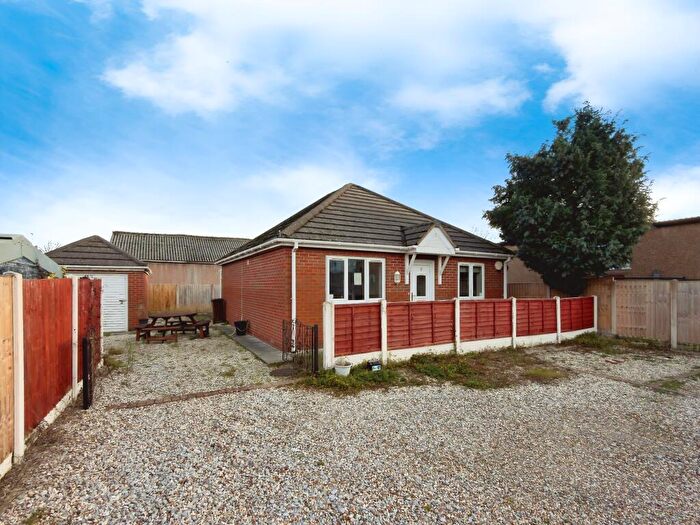
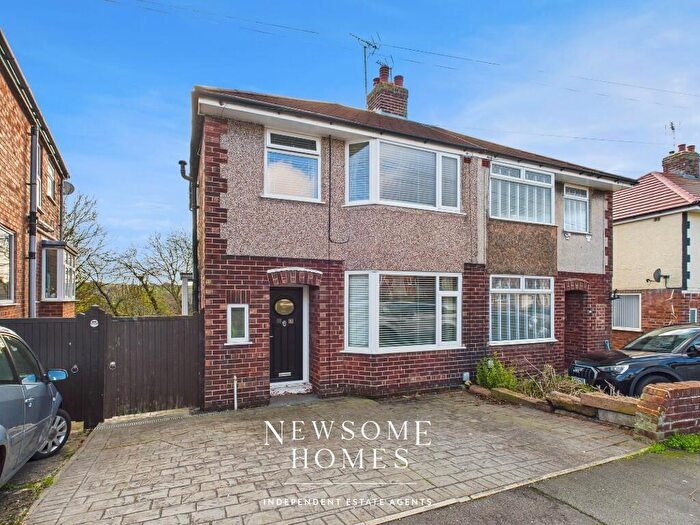
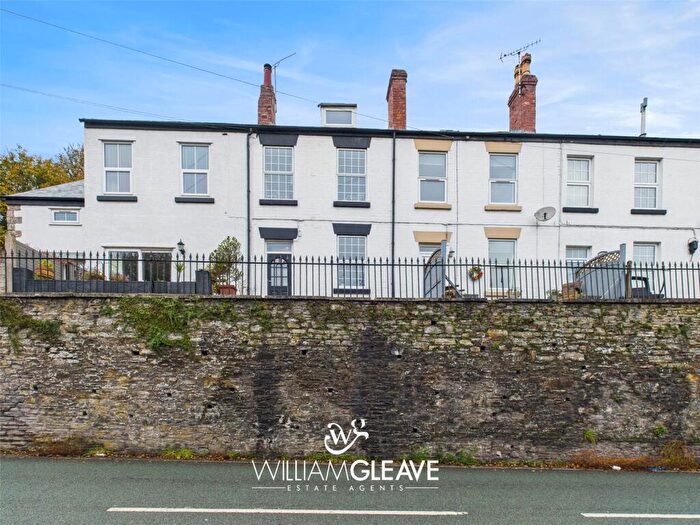
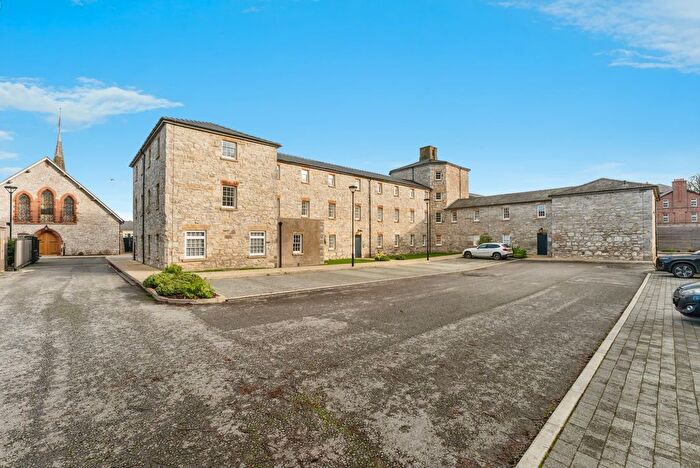
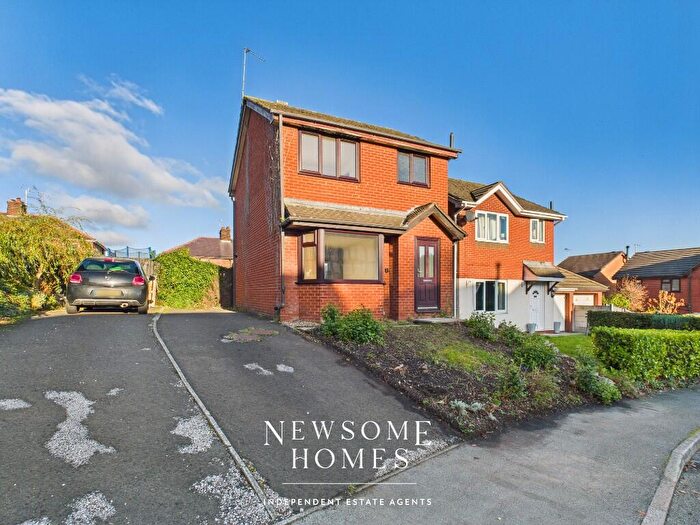
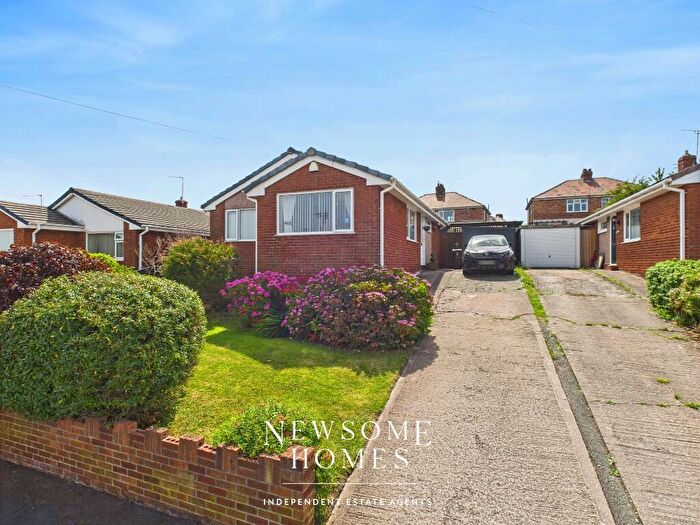
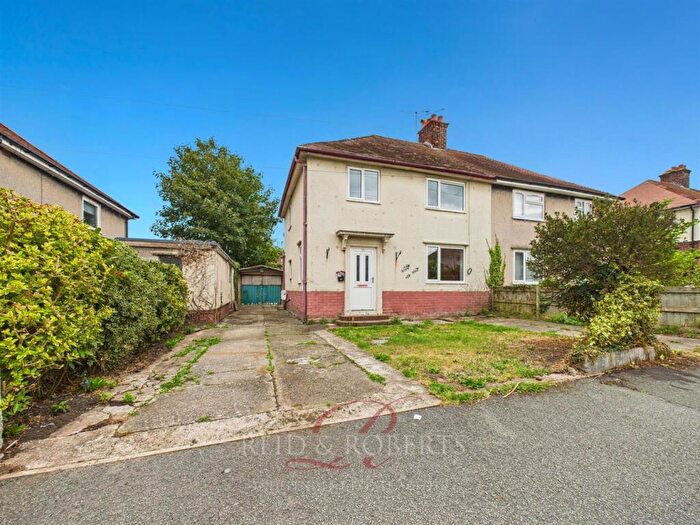
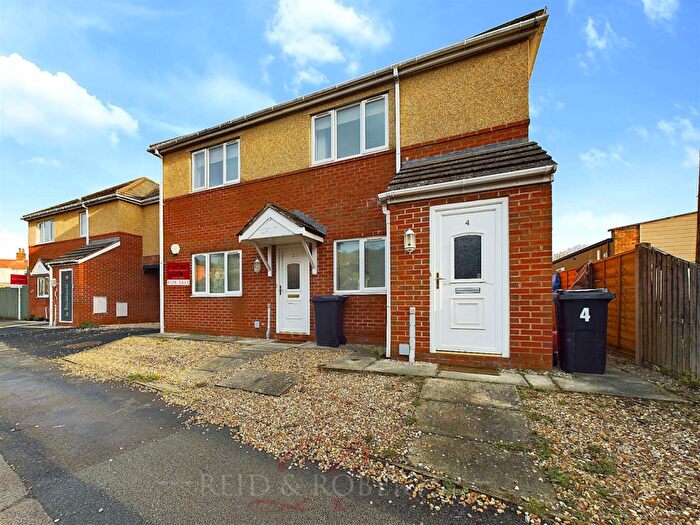
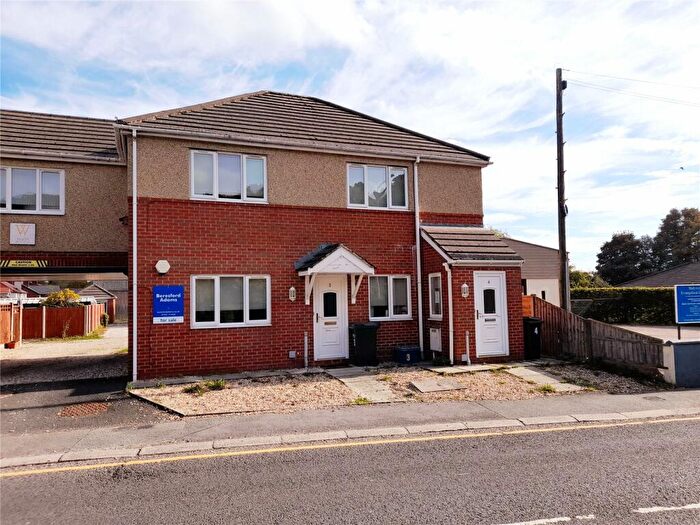
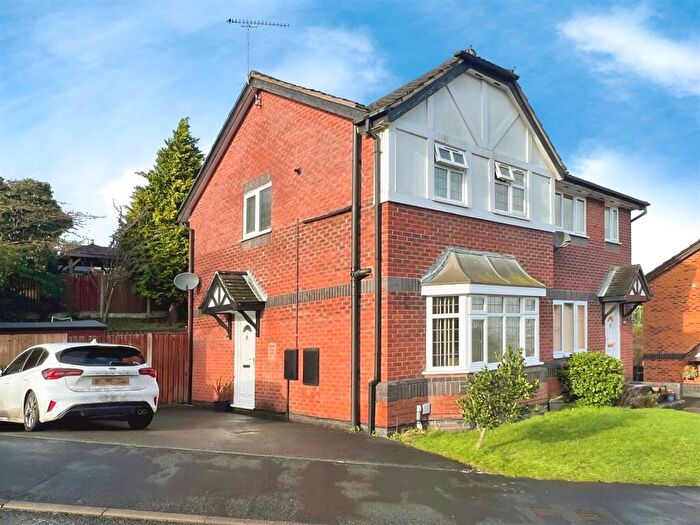
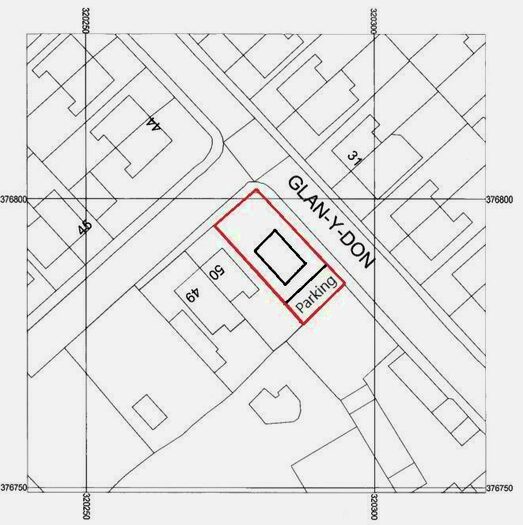
Properties for sale in Holywell East
Roads and Postcodes in Holywell East
Navigate through our locations to find the location of your next house in Holywell East, Holywell for sale or to rent.
| Streets | Postcodes |
|---|---|
| Abbots Walk | CH8 7BY CH8 7BZ |
| Awel Y Mor | CH8 7HA |
| Bagillt Road | CH8 7PB CH8 7EZ CH8 7JS |
| Bryn Teg | CH8 7DP |
| Bryn Y Gwynt | CH8 7BX |
| Fair Haven | CH8 7HB |
| Fron Las | CH8 7HX |
| Glan Y Don | CH8 7HG CH8 7HQ |
| Glyn Abbott Avenue | CH8 7ED |
| Maes Yr Afon | CH8 7HP |
| Myrtle Lane | CH8 7BS CH8 7BT |
| Nant Y Coed | CH8 7AY CH8 7AZ CH8 7BA CH8 7BP CH8 7AQ CH8 7BQ |
| Pen Y Maes Road | CH8 7BB CH8 7BD CH8 7BE CH8 7BG CH8 7EG CH8 7HH CH8 7HL CH8 7TS |
| Penrhyn | CH8 7EB |
| Penymaes Gardens | CH8 7BL CH8 7BN CH8 7BW |
| Prince Of Wales Avenue | CH8 7BJ CH8 7BR |
| Rhoslan | CH8 7EA |
| Rose Hill | CH8 7TL |
| Sealand Avenue | CH8 7BU |
| Sundawn Avenue | CH8 7BH |
| Tir Glas | CH8 7LB |
| Trem Y Mor | CH8 7LF |
| Wood Lane | CH8 7DU CH8 7HU |
Transport near Holywell East
-
Flint Station
-
Neston Station
-
Heswall Station
-
West Kirby Station
-
Hoylake Station
-
Manor Road Station
-
Shotton Station
-
Hawarden Bridge Station
-
Meols Station
-
Upton Station
- FAQ
- Price Paid By Year
- Property Type Price
Frequently asked questions about Holywell East
What is the average price for a property for sale in Holywell East?
The average price for a property for sale in Holywell East is £169,950. This amount is 21% lower than the average price in Holywell. There are 438 property listings for sale in Holywell East.
What streets have the most expensive properties for sale in Holywell East?
The streets with the most expensive properties for sale in Holywell East are Wood Lane at an average of £238,200, Pen Y Maes Road at an average of £198,366 and Bagillt Road at an average of £191,250.
What streets have the most affordable properties for sale in Holywell East?
The streets with the most affordable properties for sale in Holywell East are Nant Y Coed at an average of £114,636, Penymaes Gardens at an average of £128,592 and Glan Y Don at an average of £128,800.
Which train stations are available in or near Holywell East?
Some of the train stations available in or near Holywell East are Flint, Neston and Heswall.
Property Price Paid in Holywell East by Year
The average sold property price by year was:
| Year | Average Sold Price | Price Change |
Sold Properties
|
|---|---|---|---|
| 2025 | £157,215 | -9% |
6 Properties |
| 2024 | £170,863 | -4% |
22 Properties |
| 2023 | £177,467 | 6% |
17 Properties |
| 2022 | £167,302 | 5% |
27 Properties |
| 2021 | £158,836 | 18% |
34 Properties |
| 2020 | £130,666 | - |
18 Properties |
| 2019 | £130,725 | -1% |
22 Properties |
| 2018 | £132,372 | 16% |
20 Properties |
| 2017 | £110,782 | -7% |
23 Properties |
| 2016 | £118,761 | -3% |
21 Properties |
| 2015 | £122,152 | 6% |
18 Properties |
| 2014 | £115,388 | -3% |
18 Properties |
| 2013 | £119,184 | 12% |
16 Properties |
| 2012 | £105,396 | -14% |
15 Properties |
| 2011 | £120,400 | 14% |
10 Properties |
| 2010 | £104,083 | -8% |
12 Properties |
| 2009 | £112,363 | -16% |
11 Properties |
| 2008 | £130,830 | -2% |
18 Properties |
| 2007 | £133,167 | 15% |
20 Properties |
| 2006 | £112,563 | -7% |
23 Properties |
| 2005 | £120,078 | 21% |
19 Properties |
| 2004 | £94,831 | 19% |
30 Properties |
| 2003 | £76,658 | 21% |
31 Properties |
| 2002 | £60,703 | 10% |
43 Properties |
| 2001 | £54,557 | 20% |
37 Properties |
| 2000 | £43,514 | -7% |
31 Properties |
| 1999 | £46,352 | 7% |
17 Properties |
| 1998 | £43,192 | 21% |
20 Properties |
| 1997 | £34,163 | -5% |
15 Properties |
| 1996 | £35,972 | -4% |
18 Properties |
| 1995 | £37,314 | - |
21 Properties |
Property Price per Property Type in Holywell East
Here you can find historic sold price data in order to help with your property search.
The average Property Paid Price for specific property types in the last three years are:
| Property Type | Average Sold Price | Sold Properties |
|---|---|---|
| Semi Detached House | £150,160.00 | 43 Semi Detached Houses |
| Detached House | £234,000.00 | 19 Detached Houses |
| Terraced House | £129,555.00 | 9 Terraced Houses |
| Flat | £167,500.00 | 1 Flat |

