Houses for sale & to rent in Northop, Mold
House Prices in Northop
Properties in Northop have an average house price of £287,037.00 and had 98 Property Transactions within the last 3 years¹.
Northop is an area in Mold, Sir y Fflint - Flintshire with 1,272 households², where the most expensive property was sold for £882,500.00.
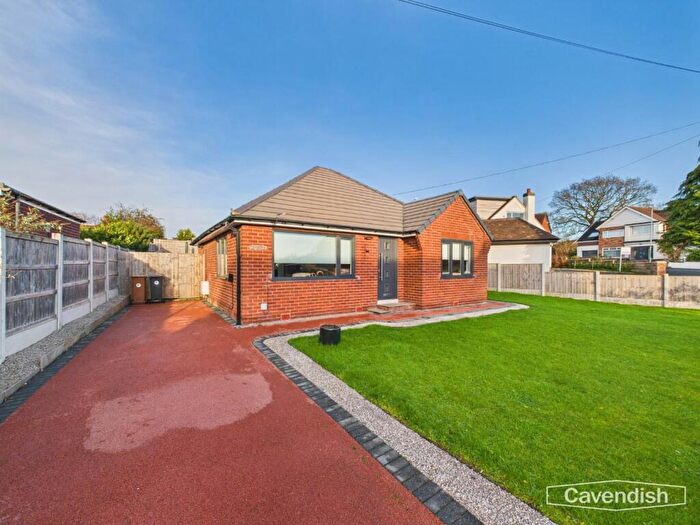
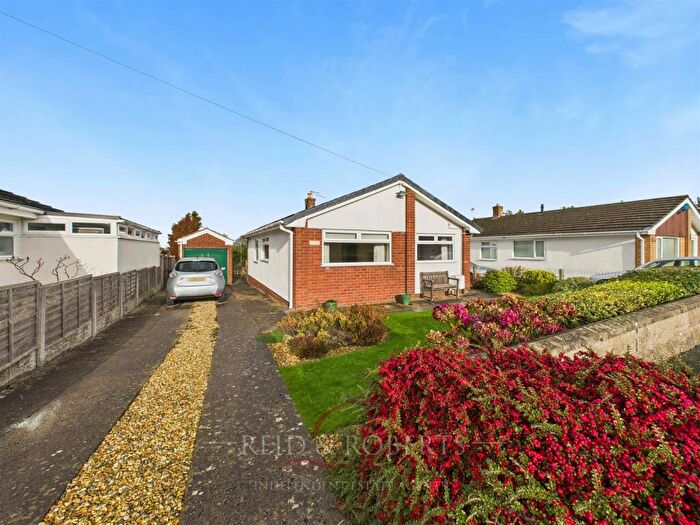
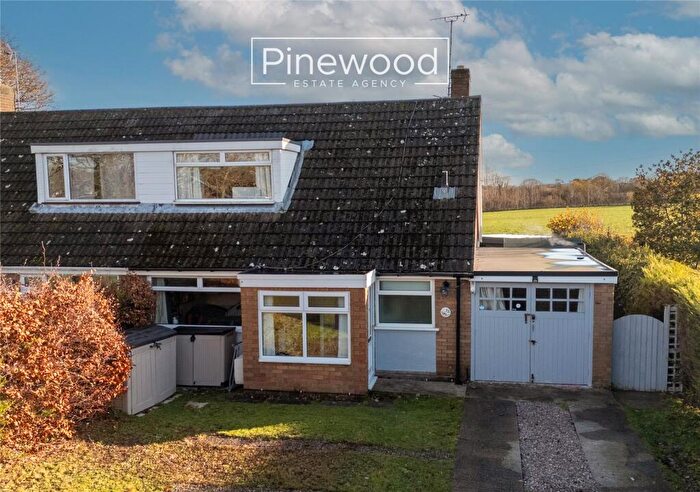
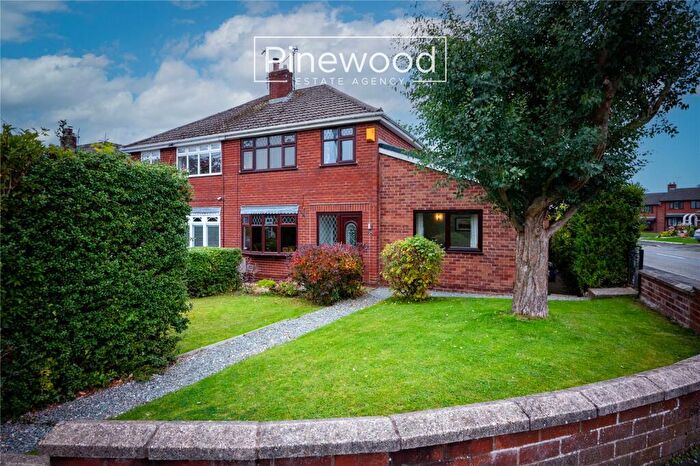
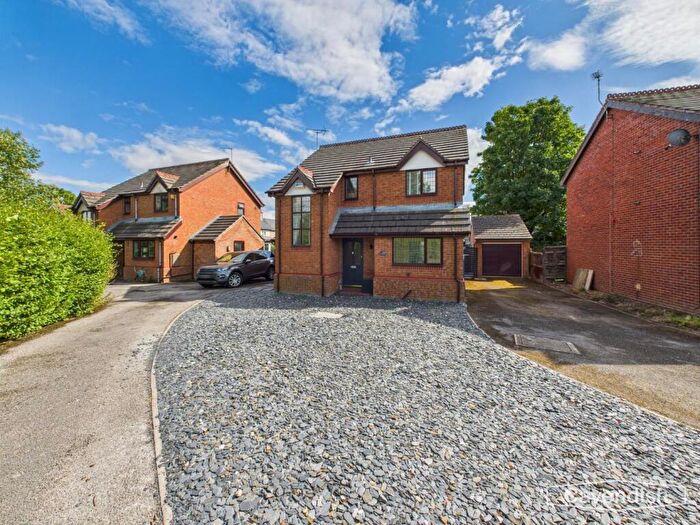
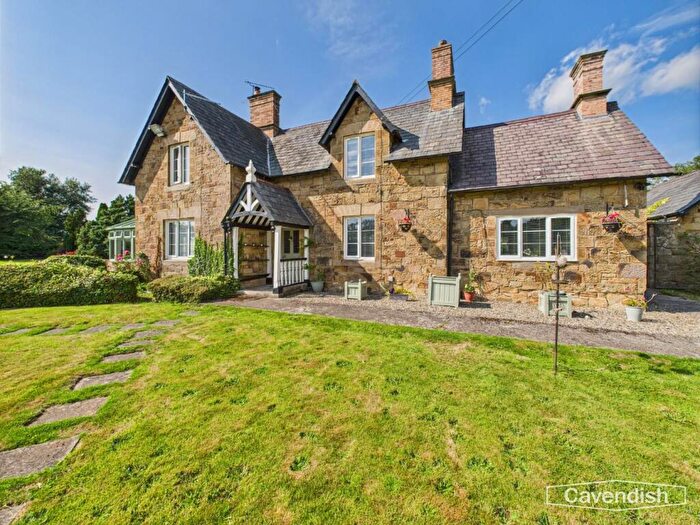
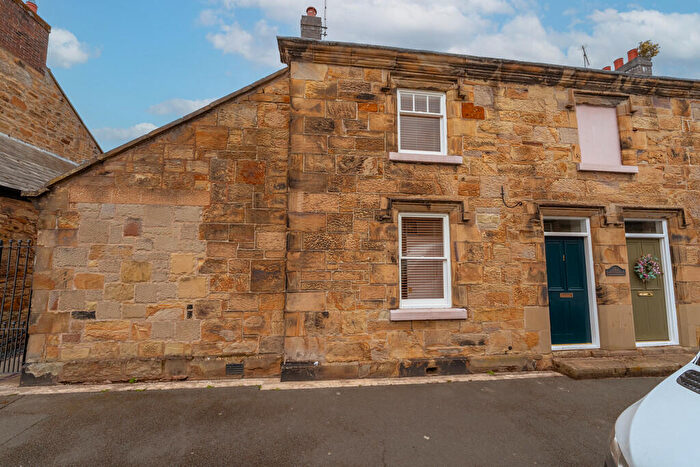
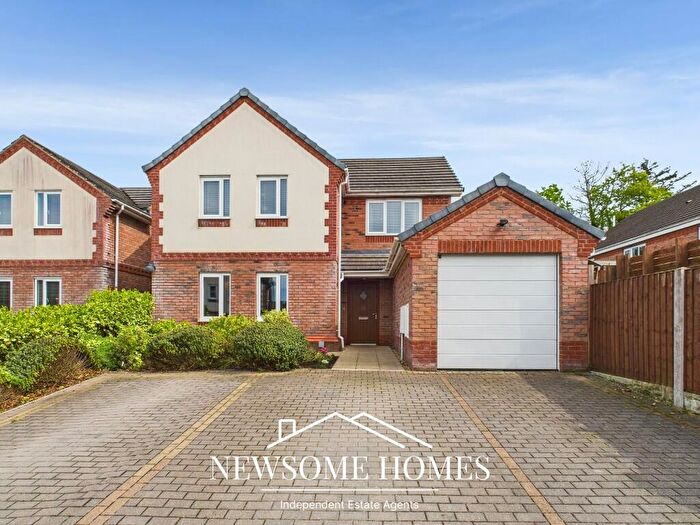
Properties for sale in Northop
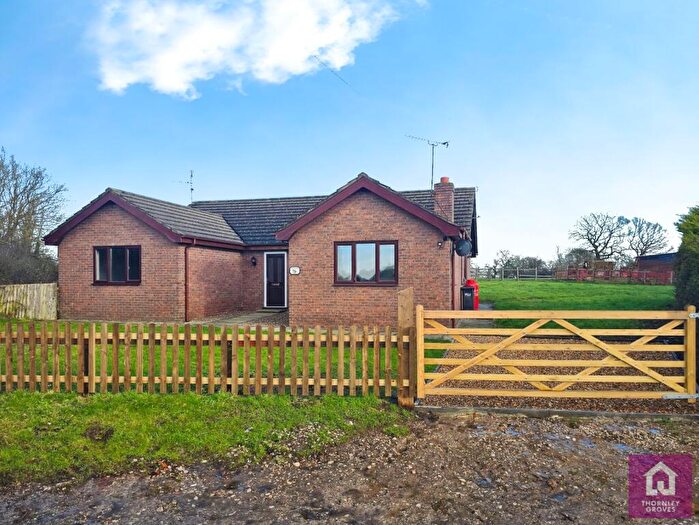
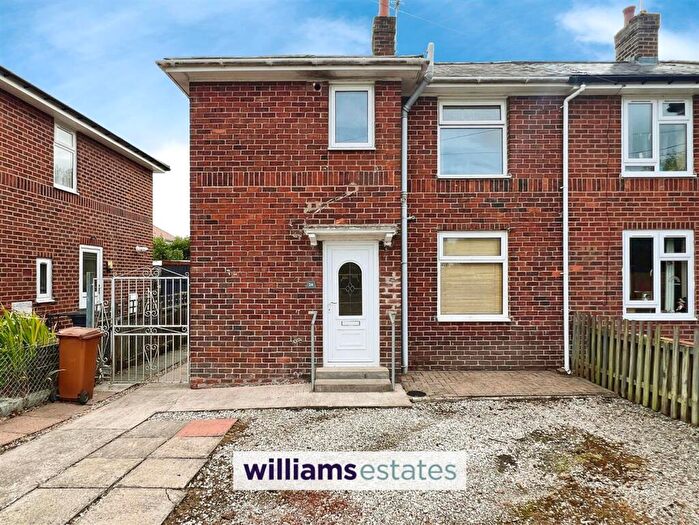
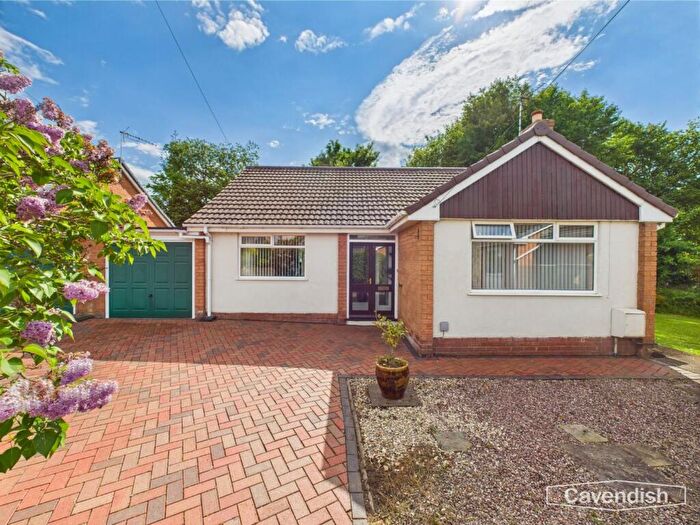
Previously listed properties in Northop
Roads and Postcodes in Northop
Navigate through our locations to find the location of your next house in Northop, Mold for sale or to rent.
| Streets | Postcodes |
|---|---|
| Aber Crescent | CH7 6DB |
| Alltami Road | CH7 6RH |
| Ash Road | CH7 6WN |
| Badgers Court | CH7 6GR |
| Black Brook | CH7 6LT |
| Brook Street | CH7 6BL CH7 6BN |
| Bryn Hyfryd | CH7 6FB |
| Bryn Offa Lane | CH7 6RQ |
| Bryn Rhyd | CH7 6EH |
| Bryn Seion Lane | CH7 6YY |
| Bryn Seion Terrace | CH7 6EN |
| Bryn Teg | CH7 6GG |
| Cae Berwyn | CH7 6AJ |
| Cae Glas | CH7 6FD |
| Caernarvon Terrace | CH7 6BU |
| Capel Y Nant | CH7 6DJ |
| Chapel Walk | CH7 6EB |
| Chester Road | CH7 6AH CH7 6AZ |
| Chestnut Close | CH7 6RP |
| Church Cottages | CH7 6BP |
| Church Road | CH7 6BS |
| Connahs Quay Road | CH7 6BT CH7 6GP CH7 6DH |
| Duke Street | CH7 6EJ CH7 6EY |
| Ffordd Celyn | CH7 6SS |
| Ffordd Dawel | CH7 6DA |
| Ffordd Edwin | CH7 6AX |
| Ffordd Eldon | CH7 6ST |
| Ffordd Ganol | CH7 6DZ |
| Ffordd Glyndwr | CH7 6AT |
| Ffordd Gwynedd | CH7 6AY |
| Ffordd Las | CH7 6DU |
| Ffordd Owen | CH7 6AU |
| Ffordd Tirion | CH7 6DY |
| Flint Road | CH7 6BR |
| Fox Field | CH7 6GQ |
| Glan Yr Eglwys | CH7 6QF |
| Greenbank Lane | CH7 6ES CH7 6ET |
| Grosvenor Court | CH7 6EU |
| Hall Lane | CH7 6AD CH7 6AE |
| Haulfryn | CH7 6SX |
| High Street | CH7 6BH CH7 6BQ CH7 6BW |
| Holywell Road | CH7 6AN CH7 6AA CH7 6AR |
| Llys Caer Glo | CH7 6GH |
| Llys Y Wern | CH7 6BJ |
| London Road | CH7 6EL |
| Maes Celyn | CH7 6BA |
| Maes Gruffydd | CH7 6LS |
| Maes Gwalia | CH7 6RR |
| Main Road | CH7 6EA |
| Manor Park | CH7 6EQ |
| Mold Road | CH7 6BE CH7 6BG |
| New Brighton Road | CH7 6EF |
| Northop Country Park | CH7 6WD CH7 6WA |
| Oak Drive | CH7 6WH |
| Pant Glas | CH7 6SY |
| Pant Isa | CH7 6YT |
| Pant Ucha | CH7 6EX |
| Park View | CH7 6DD |
| Pen Y Bryn | CH7 6EE |
| Pen Y Pentre | CH7 6EZ |
| Pilgrims Close | CH7 6BF |
| Quarry Lane | CH7 6EG |
| Raikes Lane | CH7 6LR |
| Rhosesmor Road | CH7 6AF |
| St Peters Park | CH7 6DT CH7 6DP CH7 6DR CH7 6DS CH7 6YU |
| Sychdyn Road | CH7 6AW |
| Tan Y Bryn | CH7 6SU |
| Tan Y Coed | CH7 6TU |
| Tan Yr Ysgol | CH7 6SR |
| The Green | CH7 6BD CH7 6BB |
| The Vownog | CH7 6EW |
| Trem Y Foel | CH7 6HA |
| Vownog Newydd | CH7 6ER |
| Vownog Road | CH7 6ED |
| Wats Dyke Way | CH7 6DX |
| CH7 6AB |
Transport near Northop
-
Flint Station
-
Buckley Station
-
Shotton Station
-
Hawarden Station
-
Hawarden Bridge Station
-
Penyffordd Station
- FAQ
- Price Paid By Year
- Property Type Price
Frequently asked questions about Northop
What is the average price for a property for sale in Northop?
The average price for a property for sale in Northop is £287,037. This amount is 16% higher than the average price in Mold. There are 302 property listings for sale in Northop.
What streets have the most expensive properties for sale in Northop?
The streets with the most expensive properties for sale in Northop are Northop Country Park at an average of £676,250, Bryn Rhyd at an average of £645,000 and Ffordd Dawel at an average of £599,950.
What streets have the most affordable properties for sale in Northop?
The streets with the most affordable properties for sale in Northop are Brook Street at an average of £146,666, Holywell Road at an average of £158,250 and Ffordd Owen at an average of £162,500.
Which train stations are available in or near Northop?
Some of the train stations available in or near Northop are Flint, Buckley and Shotton.
Property Price Paid in Northop by Year
The average sold property price by year was:
| Year | Average Sold Price | Price Change |
Sold Properties
|
|---|---|---|---|
| 2025 | £311,364 | 16% |
35 Properties |
| 2024 | £261,851 | -11% |
37 Properties |
| 2023 | £290,130 | -9% |
26 Properties |
| 2022 | £316,441 | 20% |
46 Properties |
| 2021 | £253,258 | -16% |
52 Properties |
| 2020 | £294,189 | 9% |
34 Properties |
| 2019 | £267,945 | 11% |
78 Properties |
| 2018 | £237,828 | -4% |
51 Properties |
| 2017 | £248,194 | 15% |
54 Properties |
| 2016 | £210,448 | -6% |
39 Properties |
| 2015 | £222,255 | 5% |
42 Properties |
| 2014 | £211,216 | 14% |
43 Properties |
| 2013 | £181,012 | -42% |
34 Properties |
| 2012 | £256,737 | 13% |
46 Properties |
| 2011 | £224,430 | -3% |
29 Properties |
| 2010 | £230,894 | 24% |
19 Properties |
| 2009 | £175,552 | -9% |
28 Properties |
| 2008 | £191,875 | -21% |
14 Properties |
| 2007 | £232,107 | -1% |
46 Properties |
| 2006 | £235,299 | 14% |
43 Properties |
| 2005 | £202,960 | 0,2% |
42 Properties |
| 2004 | £202,631 | 26% |
43 Properties |
| 2003 | £149,979 | 5% |
53 Properties |
| 2002 | £141,875 | -10% |
86 Properties |
| 2001 | £156,405 | 26% |
64 Properties |
| 2000 | £115,705 | -11% |
73 Properties |
| 1999 | £128,491 | 35% |
36 Properties |
| 1998 | £83,272 | 2% |
63 Properties |
| 1997 | £81,361 | -4% |
78 Properties |
| 1996 | £84,540 | -28% |
82 Properties |
| 1995 | £107,823 | - |
39 Properties |
Property Price per Property Type in Northop
Here you can find historic sold price data in order to help with your property search.
The average Property Paid Price for specific property types in the last three years are:
| Property Type | Average Sold Price | Sold Properties |
|---|---|---|
| Semi Detached House | £213,935.00 | 31 Semi Detached Houses |
| Detached House | £365,075.00 | 51 Detached Houses |
| Terraced House | £194,618.00 | 11 Terraced Houses |
| Flat | £147,600.00 | 5 Flats |

