
Properties for sale in FY
Blackpool
- Info
- Price Paid By Year
- Property Type Price
House Prices in FY
Properties in FY have an average house price of £178,763 and had 13921 Property Transactions within the last 3 years.
The most expensive property was sold for £1,845,000.
Property Price Paid in FY by Year
The average sold property price by year was:
| Year | Average Sold Price | Sold Properties |
|---|---|---|
| 2025 | £186,566.00 | 4,043 Properties |
| 2024 | £176,194.00 | 5,122 Properties |
| 2023 | £174,897.00 | 4,756 Properties |
| 2022 | £178,347.00 | 6,138 Properties |
| 2021 | £174,358.00 | 7,044 Properties |
| 2020 | £166,413.00 | 4,942 Properties |
| 2019 | £157,117.00 | 5,460 Properties |
| 2018 | £155,116.00 | 5,536 Properties |
| 2017 | £156,944.00 | 5,442 Properties |
| 2016 | £148,814.00 | 5,428 Properties |
| 2015 | £142,652.00 | 4,878 Properties |
| 2014 | £140,595.00 | 4,756 Properties |
| 2013 | £138,231.00 | 4,023 Properties |
| 2012 | £135,120.00 | 3,120 Properties |
| 2011 | £137,718.00 | 3,287 Properties |
| 2010 | £145,531.00 | 3,080 Properties |
| 2009 | £143,717.00 | 3,209 Properties |
| 2008 | £152,080.00 | 3,790 Properties |
| 2007 | £153,478.00 | 7,518 Properties |
| 2006 | £147,399.00 | 7,920 Properties |
| 2005 | £136,291.00 | 6,413 Properties |
| 2004 | £124,827.00 | 8,345 Properties |
| 2003 | £100,088.00 | 8,941 Properties |
| 2002 | £81,669.00 | 9,525 Properties |
| 2001 | £68,978.00 | 8,597 Properties |
| 2000 | £64,607.00 | 7,190 Properties |
| 1999 | £61,174.00 | 6,935 Properties |
| 1998 | £56,200.00 | 6,194 Properties |
| 1997 | £55,672.00 | 6,470 Properties |
| 1996 | £51,765.00 | 5,588 Properties |
| 1995 | £51,038.00 | 4,654 Properties |
Property Price per Property Type in FY
Here you can find historic sold price data in order to help with your property search.
The average Property Paid Price for specific property types in the last three years are:
| Property Type | Average Sold Price | Sold Properties |
|---|---|---|
| Semi Detached House | £180,989.00 | 5,497 Semi Detached Houses |
| Terraced House | £127,778.00 | 4,445 Terraced Houses |
| Detached House | £324,227.00 | 2,180 Detached Houses |
| Flat | £121,667.00 | 1,799 Flats |
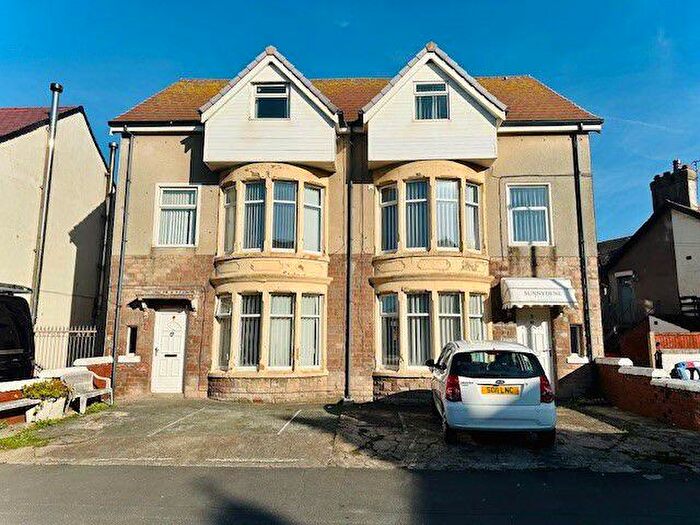
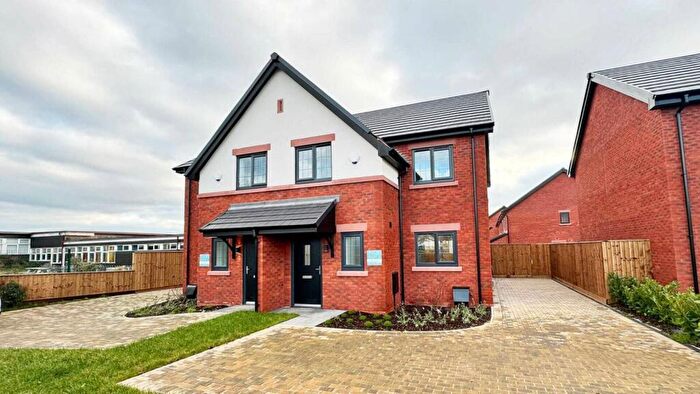
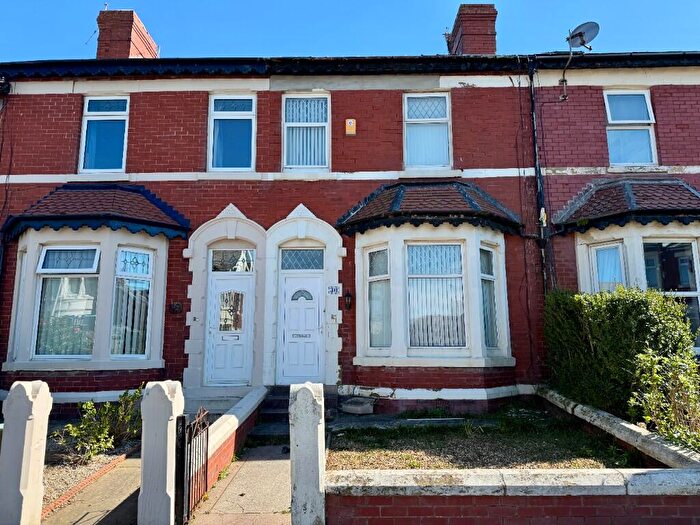
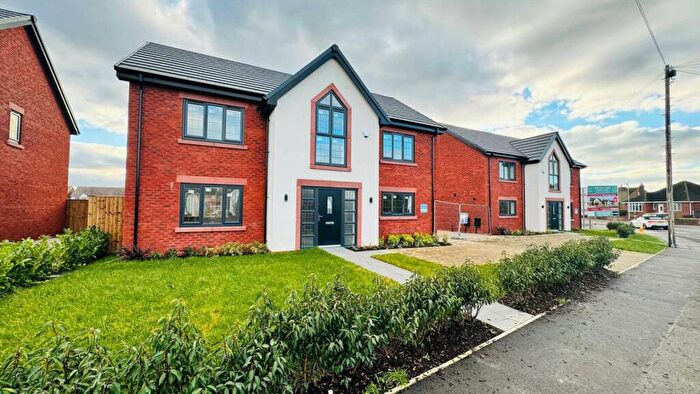
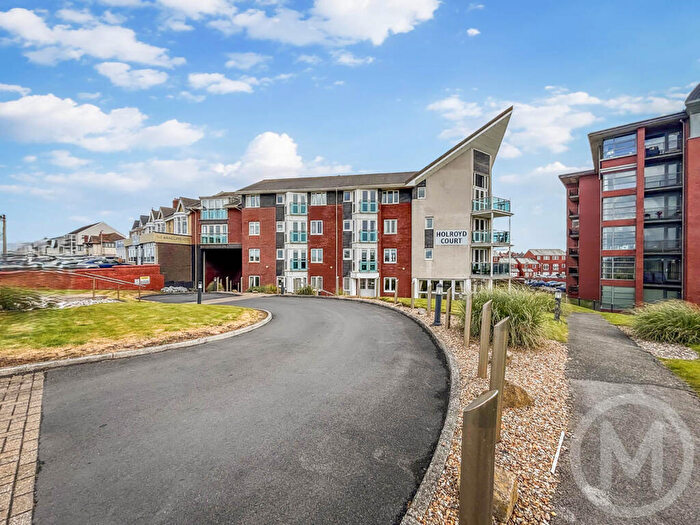
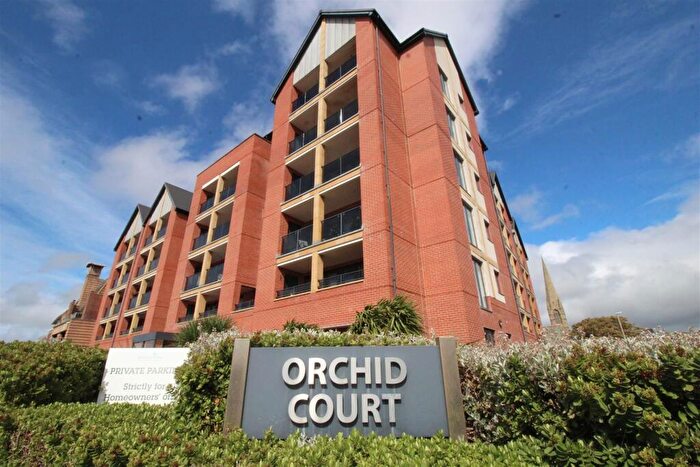
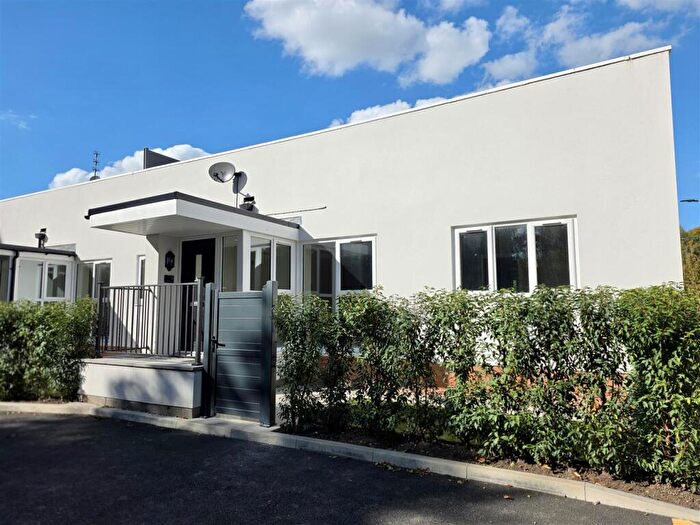
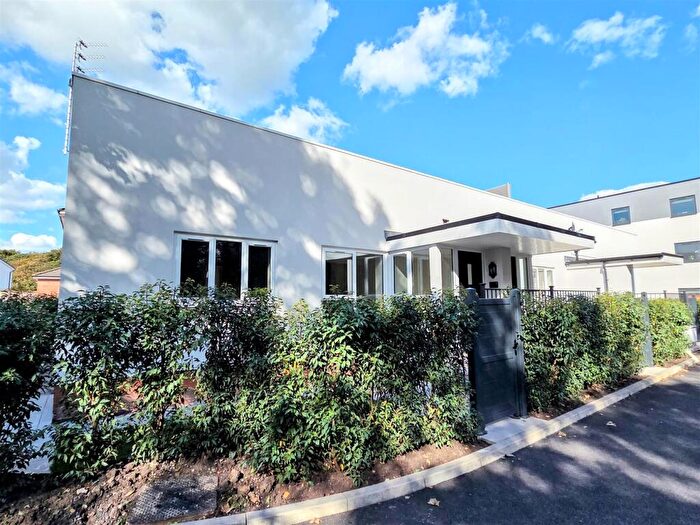
Houses and Flats for sale in FY, Blackpool
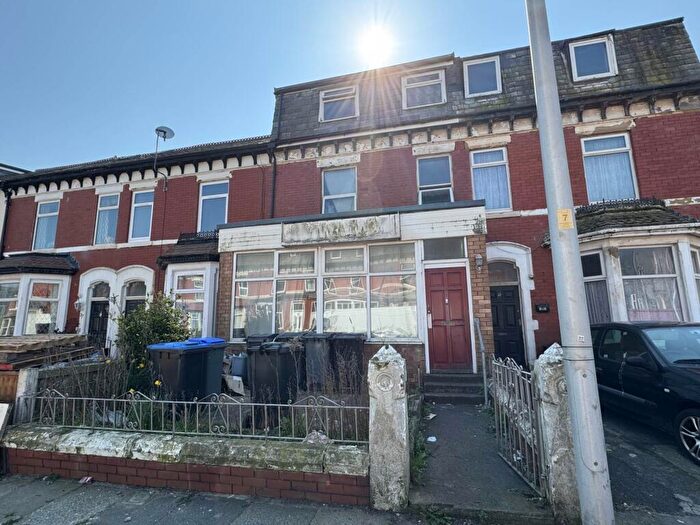
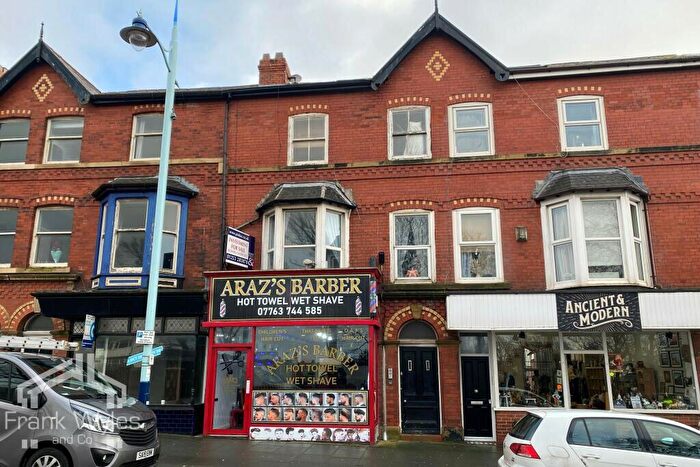
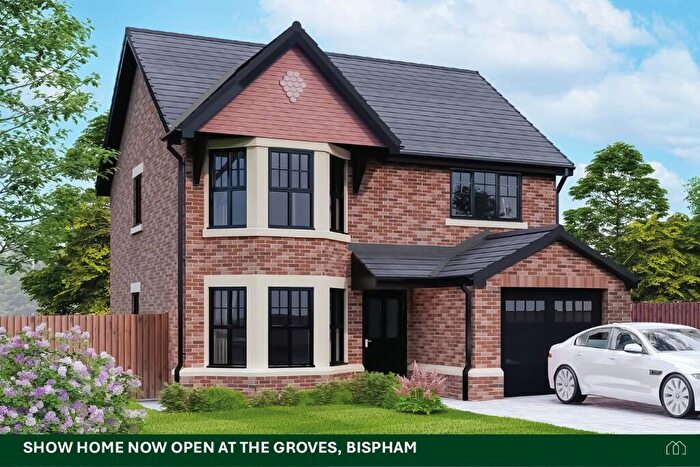
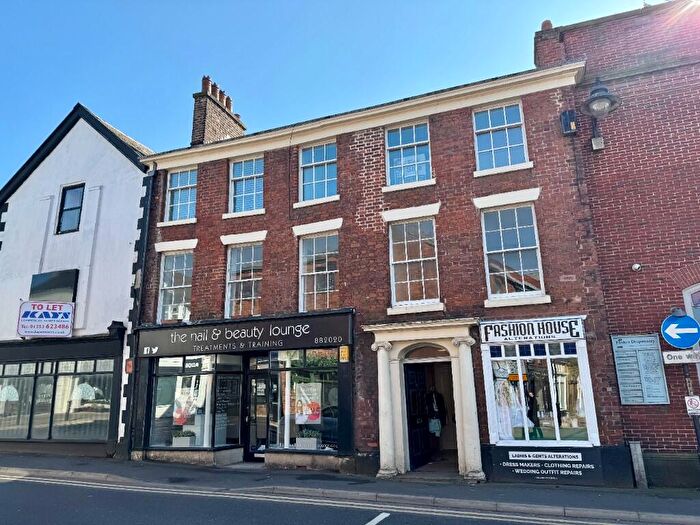
![]()
If you are looking to sell your house, let it out, or receive a property valuation, an expert can help you.
Click the button below to get started.


Postcode districts in FY, Blackpool
Navigate through our locations to find the location of your next house in FY, Blackpool, England for sale or to rent.
Transport in FY, Blackpool
Please see below transportation links in this area:

Frequently asked questions about FY
What is the average price for a property for sale in FY?
The average price for a property for sale in FY is £178,763. This amount is 50% lower than the average price in England. There are 2,748 property listings for sale in FY.
What locations have the most expensive properties for sale in FY?
The locations with the most expensive properties for sale in FY are FY8 at an average of £269,748, FY6 at an average of £236,834 and FY5 at an average of £178,927.
What locations have the most affordable properties for sale in FY?
The locations with the most affordable properties for sale in FY are FY1 at an average of £107,312, FY7 at an average of £141,234 and FY3 at an average of £149,482.
Which train stations are available in or near FY?
Some of the train stations available in or near FY are Layton, Blackpool North and Poulton-Le-Fylde.